10 Best Business Intelligence Platforms in 2026

Best Business Intelligence Platforms Shortlist


Business intelligence platforms are software tools that let you collect, analyze, and visualize data to support smarter business decisions. If you’re comparing the best business intelligence platforms, you’re likely looking for tools that can handle complex data, give you actionable insights, and fit how your team works—not just another dashboard. The right choice here shapes your ability to track performance, spot trends, and react quickly to real business challenges. In this list, you’ll find options that support different industries, use cases, and team needs so you can pick the solution that moves your business forward in 2026.
Why Trust Our Software Reviews
We’ve been testing and reviewing product management software since 2020. As product managers ourselves, we know how critical and difficult it is to make the right decision when selecting software.
We invest in deep research to help our audience make better software purchasing decisions. We’ve tested more than 2,000 tools for different product management use cases and written over 1,000 comprehensive software reviews. Learn how we stay transparent & our software review methodology.
Best Business Intelligence Platforms Summary
This comparison chart summarizes pricing details for my top business intelligence platform selections to help you find the best one for your budget and business needs.
| Tool | Best For | Trial Info | Price | ||
|---|---|---|---|---|---|
| 1 | Best for advanced visual analytics tools | Free trial + free plan available | From $15/user/month (billed annually) | Website | |
| 2 | Best for real-time associative data exploration | 30-day free trial + free demo available | From $300/month (billed annually) | Website | |
| 3 | Best for scalable cloud data management | 30-day free trial + free demo available | Pricing upon request | Website | |
| 4 | Best for integrated strategy tracking | 14-day free trial + free demo available | From $13/user/month | Website | |
| 5 | Best for native Microsoft ecosystem integration | Free plan available | From £10.80/user/month (billed annually) | Website | |
| 6 | Best for open-source analytical flexibility | Free plan available | From $90/month (billed annually) | Website | |
| 7 | Best for customizable data experiences | 7-day free trial + free demo available | Pricing upon request | Website | |
| 8 | Best for automated insight discovery | 30-day free trial + free demo available | Pricing upon request | Website | |
| 9 | Best for centralized enterprise reporting | Free demo available | Pricing upon request | Website | |
| 10 | Best for AI-powered analytics assistance | 14-day free trial + free demo available | Pricing upon request | Website |
Best Business Intelligence Platforms Reviews
Below are my detailed summaries of the best business intelligence platforms that made it onto my shortlist. My reviews offer a detailed look at the features, capabilities, and integrations of each platform to help you find the best one for you.

Tableau is a data visualization and business intelligence platform that lets analysts build interactive charts, maps, and dashboards from live or static data sources.
Who Is Tableau Best For?
Tableau is a natural fit for data analysts and BI teams at mid-to-enterprise companies that work with complex, high-volume datasets.
Why I Picked Tableau
Tableau earns its spot on my shortlist because no other BI tool gives me the same level of control over how data gets visualized. I use LOD expressions to pin calculations to a fixed dimension regardless of what's in the view, which is something I can't replicate in most competing tools. Tableau's motion charts and animated visualizations also let me track metric changes over time in a way that static dashboards just don't support.
Tableau Key Features
- Tableau Prep Builder: A visual data preparation tool that lets you clean, shape, and combine datasets before analysis.
- Ask Data: A natural language query interface that returns instant visualizations based on typed questions about your data.
- Hyper extract engine: A high-performance in-memory data engine that accelerates query speeds on large datasets.
- Dashboard actions: Interactive filters, URL links, and sheet swaps triggered by clicking elements within a published dashboard.
Tableau Integrations
Tableau offers native integrations with Snowflake, Google BigQuery, Amazon Redshift, Salesforce, Databricks, SAP HANA, Oracle, and Jira. An API is available for custom integrations.
Pros and Cons
Pros:
- Built-in geospatial mapping for location analysis
- Extensive visualization options for complex datasets
- Interactive dashboards support real-time data exploration
Cons:
- Scheduled refreshes limited on Tableau Public
- Data preparation requires the separate Tableau Prep tool

Qlik is a business intelligence and analytics platform centered on an associative data engine, offering self-service visualization, real-time data integration, and AI-assisted insight generation across enterprise data environments.
Who Is Qlik Best For?
Qlik is a strong fit for mid-to-large enterprises with complex, multi-source data environments where analysts need to explore relationships across datasets without predefined query paths.
Why I Picked Qlik
Qlik earns its spot on my shortlist because its associative engine genuinely works differently from query-based BI tools. Instead of following predefined drill paths, I can click any data point and Qlik instantly recalculates every relationship across the entire dataset. It also surfaces what's excluded, not just what's selected, which I find invaluable when investigating anomalies. That combination of in-memory association and real-time exclusion logic makes exploratory analysis far more intuitive.
Qlik Key Features
- Insight Advisor: An AI-assisted feature that automatically generates chart suggestions and natural language explanations based on your selected data fields.
- Qlik AutoML: A built-in automated machine learning tool that lets analysts build and deploy predictive models without writing code.
- Multi-cloud deployment: Qlik runs on AWS, Google Cloud, and Azure, letting teams deploy in the environment that fits their infrastructure.
- Data lineage tracking: Visualizes the full path of data from source to dashboard, so you can trace where any metric originates.
Qlik Integrations
Qlik offers hundreds of connectors including Salesforce, SAP, Snowflake, Databricks, Google BigQuery, Amazon Redshift, Slack, Jira, ServiceNow, and Microsoft 365. An API is available for custom integrations.
Pros and Cons
Pros:
- AI-driven insights suggest relevant visualizations
- In-memory processing supports fast data analysis
- Associative engine uncovers hidden data relationships
Cons:
- Large data export process requires time
- Script-based data modelling requires technical skill

Domo is a cloud-native business intelligence platform that centralizes data from 1,000+ sources, combining real-time dashboards, low-code data transformation, workflow automation, and custom app building in a single environment.
Who Is Domo Best For?
Domo is a strong fit for mid-to-large enterprises managing high data volumes across multiple business units, where data teams need centralized governance without relying on on-premises infrastructure.
Why I Picked Domo
Domo earns its spot on my shortlist because its entire architecture is built around cloud-native data management at scale. I like that Magic ETL lets my team build visual data pipelines that process millions of rows without writing SQL, and Domo's Adrenaline query engine handles those volumes without degrading dashboard performance. The platform also stores and governs all data in a single cloud environment, so there's no fragmented infrastructure to manage as data volume grows.
Domo Key Features
- Analyzer: A drag-and-drop chart builder for creating custom visualizations without writing code.
- Domo Everywhere: Embeds live Domo dashboards and data apps directly into external-facing products and portals.
- Domo.AI: A built-in AI layer that lets teams deploy predictive models and run AI-generated data summaries.
- Alerts: Configurable, threshold-based notifications that trigger when data meets specified conditions.
Domo Integrations
Domo offers 1,000+ native connectors for pulling data from sources like Salesforce, Snowflake, Google BigQuery, Amazon Redshift, Google Sheets, and QuickBooks, plus generic connectors for ODBC, JDBC, and SFTP connections.
Pros and Cons
Pros:
- Extensive library of pre-built connectors
- Drag-and-drop Magic ETL for data prep
- Real-time data updates for live monitoring
Cons:
- Mobile app lacks some desktop dashboard features
- Initial setup can require vendor assistance

Strategy is a business intelligence platform built around a universal semantic layer that unifies metric definitions across BI tools, AI agents, and data sources like Snowflake, Databricks, and Google BigQuery.
Who Is Strategy Best For?
Strategy is a strong fit for large enterprises running multi-tool data environments where inconsistent metric definitions across teams, BI tools, and AI agents are creating data governance issues.
Why I Picked Strategy
Strategy earns its spot on my shortlist because of how Mosaic's universal semantic layer solves a problem every large enterprise has: metric definitions that mean different things in different tools. I like that you define revenue, churn, or margin once inside Mosaic, and that logic automatically governs Tableau, Power BI, AI agents, and embedded applications simultaneously. The Mosaic Sentinel layer is what really sets it apart, giving my team real-time monitoring of every data access event, PII exposure detection, and a full audit trail without any additional setup.
Strategy Key Features
- Mosaic Studio: An AI-powered modeling environment where business users define metrics, hierarchies, and attributes in plain language without writing code.
- Smart Caching and push-down optimization: A query efficiency layer that routes requests intelligently to reduce redundant processing and control cloud compute costs.
- BI tool migration support: Migrates existing business logic from tools like Power BI, BOBJ, or Cognos into the Mosaic semantic layer without rebuilding metrics.
- 200+ native data connectors: Pre-built connections to cloud, on-premises, and hybrid data sources, including Snowflake, Databricks, Azure Synapse, SAP, Oracle, Salesforce, and Workday.
Strategy Integrations
Strategy Mosaic offers 200+ native connectors, including Snowflake, Databricks, Google BigQuery, Azure Synapse, SAP, Oracle, Salesforce, Workday, Power BI, Tableau, and Microsoft Excel. It also exposes governed data through REST APIs, SQL, DAX, and MDX interfaces.
Pros and Cons
Pros:
- Goal alignment mapping supports strategy execution
- Automated alerts for missed or met targets
- KPI dashboards update in real time
Cons:
- Report templates lack modification documentation
- Restricts advanced metric tracking on base tiers

Microsoft Power BI is a cloud-based business intelligence platform that combines self-service data visualization, interactive dashboards, and AI-powered analytics built directly into the Microsoft ecosystem.
Who Is Microsoft Power BI Best For?
Microsoft Power BI is a natural fit for organizations already running Microsoft 365 or Azure, where analysts want BI tools that work within the environment they already use daily.
Why I Picked Microsoft Power BI
I picked Microsoft Power BI because it's the only BI platform where the ecosystem integration isn't just a connector, it's the foundation. My team can publish Excel models directly to Power BI without rebuilding anything, and reports embed natively inside Microsoft Teams channels so stakeholders view live data without leaving their workflow. I also like DirectLake mode, which queries data directly from OneLake without importing it, keeping dashboards current without manual refreshes.
Microsoft Power BI Key Features
- DAX calculations: A formula language for building custom measures, calculated columns, and KPIs within your data model.
- Power Query editor: A built-in ETL tool for shaping, cleaning, and transforming data before it loads into reports.
- Row-level security: Restricts data visibility at the row level so each user only sees data relevant to their role.
- Paginated reports: Produces fixed-layout, print-ready reports designed for distributing structured data across large datasets.
Microsoft Power BI Integrations
Microsoft Power BI offers 100+ native data connectors through Power Query, including Salesforce, SAP HANA, Snowflake, Google BigQuery, Amazon Redshift, Oracle, Databricks, Google Analytics, Google Sheets, and SharePoint.
Pros and Cons
Pros:
- Large library of custom visualizations
- Built-in AI features for data analysis
- Direct integration with Microsoft 365 applications
Cons:
- Performance slows with very large datasets
- Complex data modelling can require DAX expertise

Metabase is an open-source business intelligence platform with a visual query builder, SQL editor, interactive dashboards, and embedded analytics that lets both technical and non-technical users explore and share data.
Who Is Metabase Best For?
Metabase works well for data engineers and analysts who need a self-hosted BI tool they can deploy, extend, and govern on their own infrastructure.
Why I Picked Metabase
Metabase earns its spot on my shortlist because the open-source version gives teams full control over deployment, whether that's on-premise, in a private cloud, or containerized via Docker. I particularly like its embedded analytics feature, which lets my team publish live dashboards directly inside internal tools or customer-facing products. On top of that, I use the SQL snippet library to store and reuse complex query logic across multiple reports.
Metabase Key Features
- Interactive dashboard filters: Apply click-through filters across all charts on a dashboard simultaneously, without editing individual questions.
- Automated alerts: Set threshold-based alerts that trigger email or Slack notifications when a metric crosses a defined value.
- X-ray exploration: Generate an automatic visual summary of any table, chart, or segment with a single click for quick data profiling.
- Data permissions sandboxing: Restrict row-level data access per user group so different teams only see the data they're authorized to query.
Metabase Integrations
Metabase offers native integrations with PostgreSQL, MySQL, MongoDB, Snowflake, BigQuery, Amazon Redshift, Athena, and Databricks. An API is available for custom integrations.
Pros and Cons
Pros:
- X-ray auto-generates summaries of any table
- Visual query builder needs no SQL
- Self-hosted deployment with full source access
Cons:
- No built-in write-back or data entry
- Limited formatting options for dashboard visuals

Sisense is an embedded analytics and BI platform built around flexible APIs, AI-powered querying, and an SDK that lets developers embed interactive dashboards and data visualizations directly into external products and applications.
Who Is Sisense Best For?
Sisense is a strong fit for product and engineering teams at mid-to-large SaaS companies who need to build and embed analytics directly into their own software.
Why I Picked Sisense
I picked Sisense as one of the best because its Compose SDK gives developers granular control over how analytics are built and embedded into external products, which is rare in this category. I like that you can use the natural language assistant to query governed data without writing a single line of SQL, then surface those results as auto-generated narratives using the Narrative feature. The forecast and trend tools go a step further, letting me move from describing what happened to anticipating what comes next, all within the same embedded experience.
Sisense Key Features
- Data modeling: Build and blend data from multiple sources using an AI-assisted modeling interface, without needing a dedicated data engineering team.
- Data connectivity: Connect to over 400 data sources, with options to consolidate data within Sisense or maintain a live connection to your data warehouse.
- MCP connectivity: Link Sisense analytics to external AI tools via Model Context Protocol (MCP), so teams can query governed data across third-party AI environments.
- Cloud deployment: Access and manage your analytics environment in the cloud, with automatic updates and multi-user collaboration built in.
Sisense Integrations
Sisense offers native integrations with Snowflake, Google BigQuery, Amazon Redshift, Databricks, SQL Server, Salesforce, Google Sheets, and Slack. An API is available for custom integrations.
Pros and Cons
Pros:
- Connects data from entirely different sources
- Multiple embedding options including Compose SDK
- Fast query performance on large datasets
Cons:
- Implementation from development to production is slow
- Widget styling often requires JavaScript coding
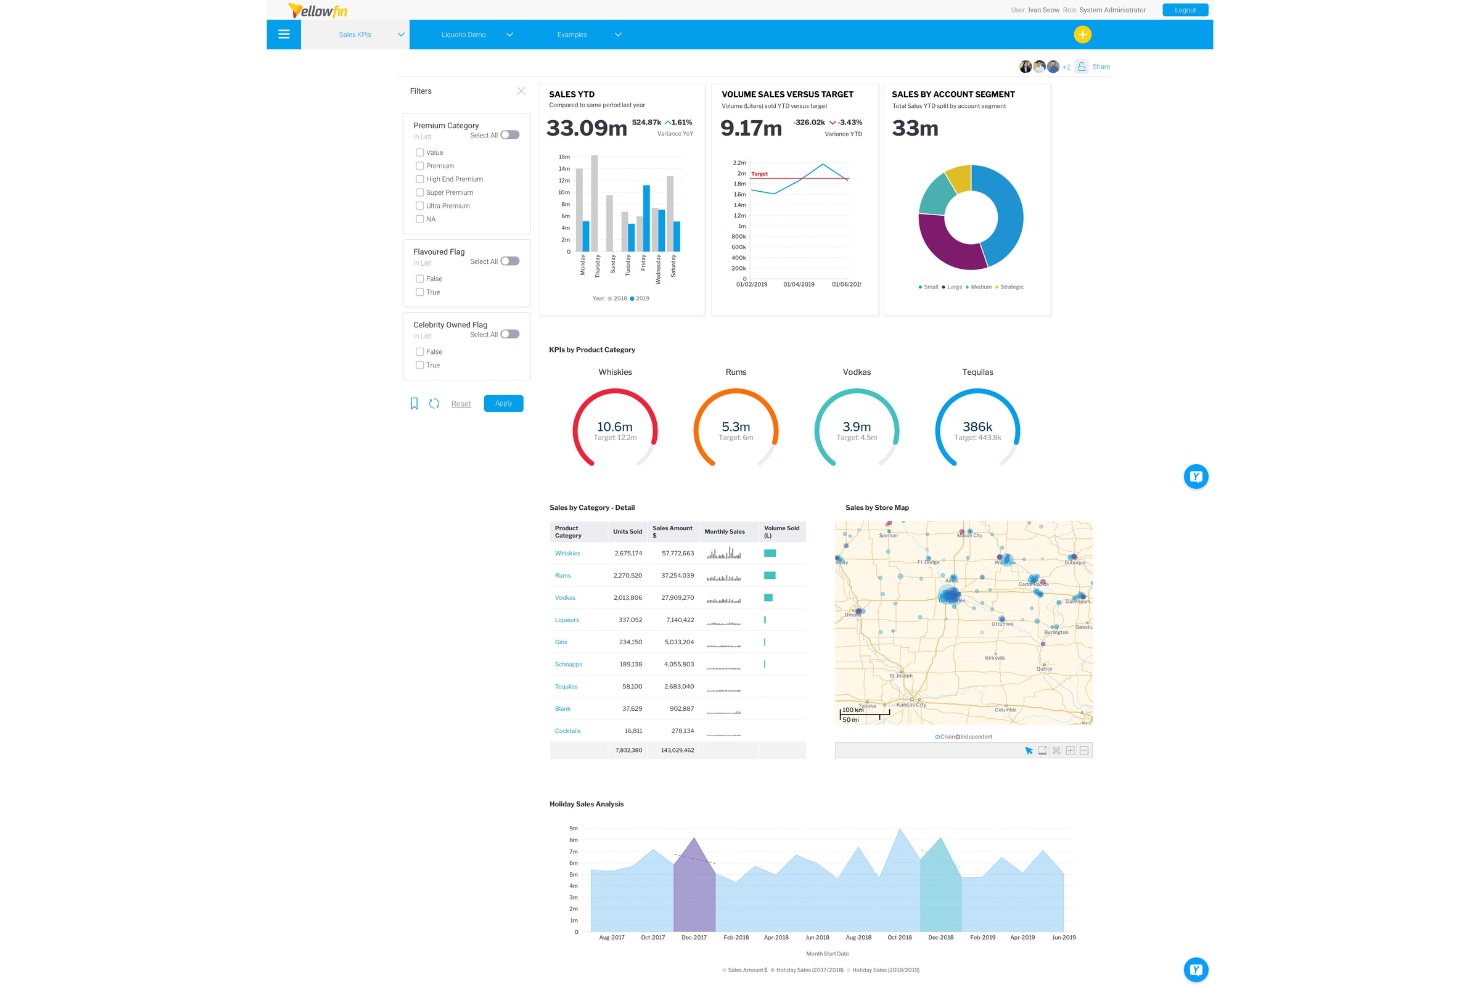
Yellowfin is a business intelligence platform with dashboards, AI-driven signals, natural language querying, and embedded analytics designed for both internal teams and product developers.
Who Is Yellowfin Best For?
Yellowfin suits mid-size to enterprise organizations that want automated anomaly detection and proactive data alerts without relying on analysts to manually surface insights.
Why I Picked Yellowfin
I picked Yellowfin as one of the best because its Signals feature does something most BI tools don't: it automatically scans your data for statistically significant changes and delivers those findings to you, without requiring you to build a report first. In practice, that means my team can get alerted to a step change in payment error rates or a sudden drop in conversion without ever opening a dashboard. Each signal also comes with a natural language explanation and correlated metric overlays, so you can move straight to root cause without the extra digging.
Yellowfin Key Features
- Assisted insights: Automatically analyzes a selected data point and generates visualizations that show statistical patterns, correlations, and drivers behind the data.
- Data storytelling (Stories): Lets you build narrative-driven reports directly in Yellowfin by combining text, charts, and live data into a shareable presentation.
- Action-based dashboards: Embeds operational workflows into dashboard views so users can trigger actions, such as updating a record or flagging an issue, without leaving the dashboard.
- Data prep: Connects to databases, spreadsheets, and web APIs, then lets you shape and govern datasets before they're used in reports or dashboards.
Yellowfin Integrations
Yellowfin offers 200+ data connectors powered by CData, covering databases, cloud platforms, and SaaS applications like Salesforce, Google Analytics, Google Sheets, Zendesk, Snowflake, SAP HANA, Amazon Redshift, Google BigQuery, HubSpot, and Jira. An API is also available for custom integrations.
Pros and Cons
Pros:
- Built-in collaboration tools enable team discussions
- Automated insights highlight trends and outliers
- Storyboard feature supports interactive data presentations
Cons:
- Visualization plugins require proprietary platform integration
- Data preparation tools lack advanced options

SAP BusinessObjects Business Intelligence is an on-premises business intelligence suite that centralizes data reporting, visualization, and sharing across large-scale enterprise environments, sitting on top of SAP's Business Technology Platform.
Who Is SAP BusinessObjects Business Intelligence Best For?
SAP BusinessObjects Business Intelligence is a strong fit for large enterprises that already run SAP infrastructure and need centralized reporting across complex organizational structures.
Why I Picked SAP BusinessObjects Business Intelligence
I picked SAP BusinessObjects Business Intelligence as one of the best because it's one of the few BI platforms built specifically around centralized enterprise reporting at scale. I like how its cross-enterprise sharing functionality lets my team distribute consistent, governed reports across departments without each team pulling their own version of the data. The role-based dashboards are a real differentiator too: I can configure exactly what each decision-maker sees based on their function, so finance, operations, and sales aren't wading through irrelevant data. The direct connectivity to SAP HANA and SAP Business Warehouse also means real-time analytics without additional data pipeline work.
SAP BusinessObjects Business Intelligence Key Features
- Crystal Reports: A formatted report design tool for building pixel-perfect, print-ready reports from multiple data sources.
- Web Intelligence: An ad hoc query and analysis tool that lets users explore data and build reports without IT involvement.
- Scheduled report distribution: Automated delivery of reports to specified users or groups on a set cadence via email or file export.
- Universe semantic layer: A metadata layer that maps complex database structures into business-friendly terms for non-technical users.
SAP BusinessObjects Business Intelligence Integrations
SAP BusinessObjects Business Intelligence connects natively to SAP data sources like SAP HANA, SAP Business Warehouse, and SAP S/4HANA, and supports connections to Oracle, Microsoft SQL Server, and IBM Db2. It also offers a RESTful Web Service SDK for custom integrations.
Pros and Cons
Pros:
- Centralized management of user access controls
- Strong support for regulatory compliance needs
- Handles complex enterprise reporting requirements
Cons:
- Requires dedicated server infrastructure deployment
- Visualizations require external plugin integration
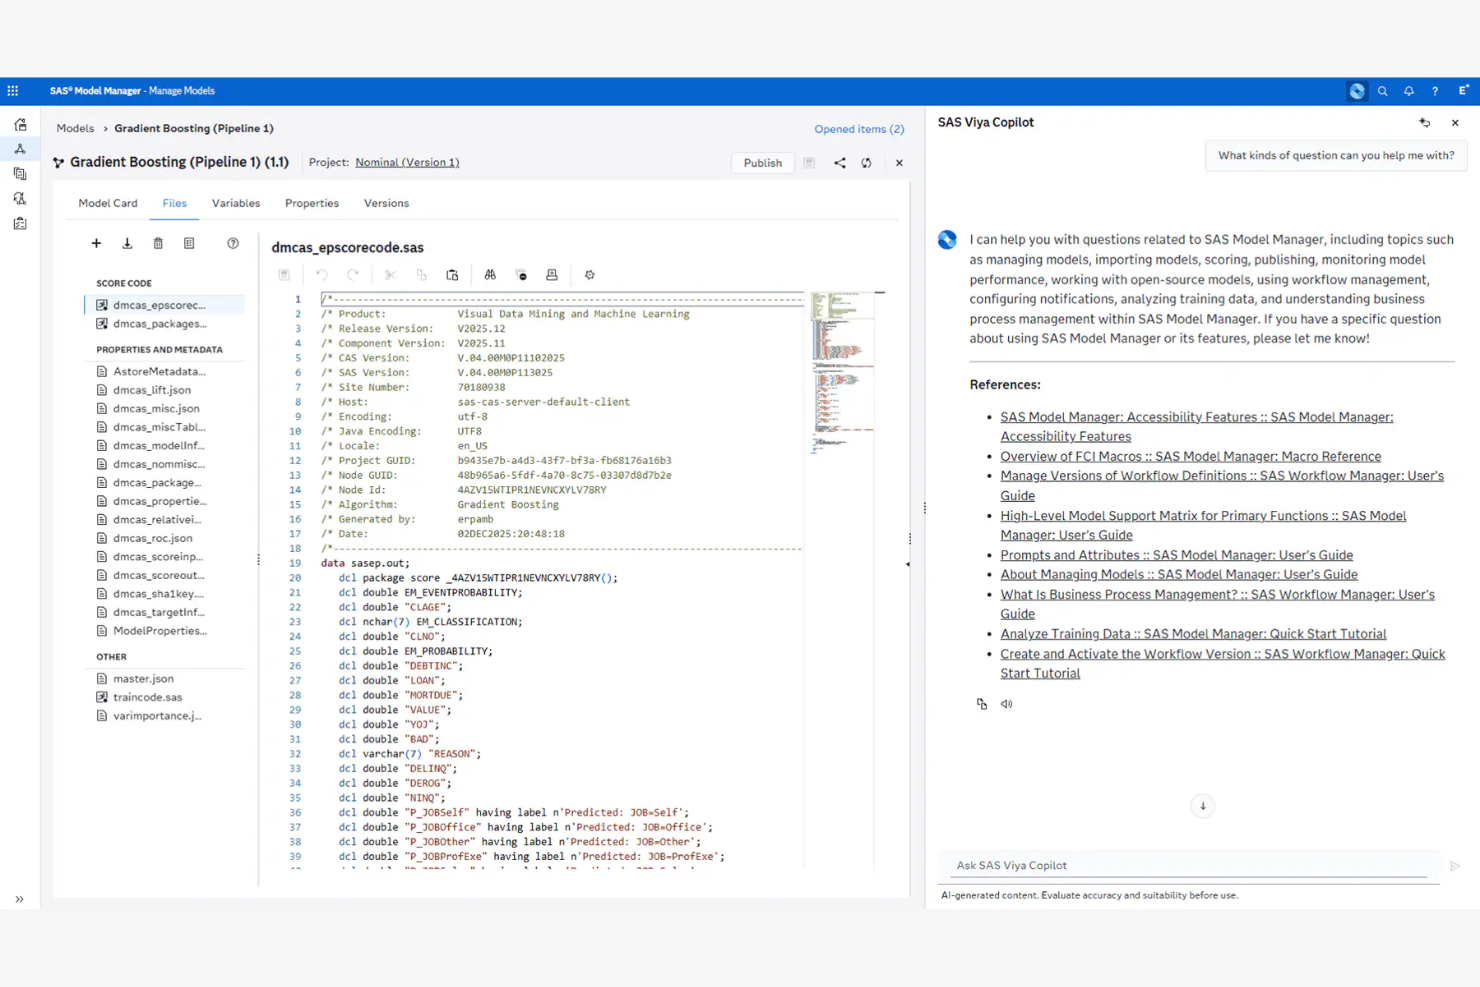
SAS Viya Copilot is a generative AI assistant embedded natively in the SAS Viya platform that converts natural language prompts into analytics actions, including model pipeline development, SAS and Python code generation, and data cataloging.
Who Is SAS Viya Copilot Best For?
SAS Viya Copilot is a strong fit for enterprise data science and analytics teams in regulated industries like financial services, healthcare, and government who need AI-assisted model development at scale.
Why I Picked SAS Viya Copilot
I've included SAS Viya Copilot in my top picks because it's one of the few AI analytics assistants built natively inside a full enterprise analytics platform rather than bolted on top. I like its human-in-the-loop execution model, where every AI-generated action requires explicit approval before it runs. Its code assistance goes beyond generation too: it explains existing SAS and Python code in plain language and adds inline comments, which I find genuinely useful when auditing inherited scripts. The domain-specific governance controls make it a natural pick for regulated environments.
SAS Viya Copilot Key Features
- Natural language querying: Ask questions about your data in plain English and get instant visual results without writing SQL or custom queries.
- Automated pipeline building: Copilot proposes and assembles end-to-end model pipelines, including data preparation, feature engineering, and model selection steps.
- Conversational data exploration: Interact with datasets through a guided chat interface to surface patterns, outliers, and summary statistics during early analysis.
- Contextual documentation generation: Automatically drafts model documentation and analysis summaries based on the actions taken within a session.
SAS Viya Copilot Integrations
SAS Viya platform connects to data sources including Snowflake, Databricks, Google BigQuery, Amazon Redshift, Oracle, Teradata, and MongoDB, and supports Python, R, Java, and REST APIs for custom integrations.
Pros and Cons
Pros:
- Built-in AI models for predictive analytics
- Automated data preparation reduces manual work
- Natural language queries for data exploration
Cons:
- Visualization options are less flexible than peers
- Advanced features may need SAS expertise
Other Business Intelligence Platforms
Here are some additional business intelligence platform options that didn’t make it onto my shortlist, but are still worth checking out:
- Google Cloud Looker
For embedded analytics solutions
- Zoho Analytics
For self-service dashboard creation
- GoodData
For scalable multi-tenant analytics
- ThoughtSpot
For natural language search analytics
- TIBCO
For advanced predictive analytics
- Sigma Computing
For spreadsheet-style data exploration
- Apache Superset
For cloud-native data visualization
- AnalyticsCreator
For automated data warehouse modelling


How I Evaluate Business Intelligence Platforms
I split my evaluation into baseline functionality—like querying adoption metrics or building cross-functional dashboards—and the differentiators that separate the strongest platforms from the rest.
Core Functionality (Table Stakes For This List)
When I'm selecting tools for my list, I rank each one on a scale from 0 (does not offer the functionality) to 5 (excels in this area) for each core functionality listed below. Then, I calculate the tool's total score into a percentage. Each tool needs to achieve a minimum total score of 75% to be considered for inclusion.
- Data source connectors: I check how many native connectors a platform offers and whether it covers warehouses like Snowflake and BigQuery alongside SaaS tools.
- Interactive dashboards: The best platforms let you build dashboards with cross-filtering and drill-through so stakeholders can explore data on their own.
- Data visualization library: I look for a wide range of chart types, including funnels, cohort tables, and heatmaps that product teams actually use day to day.
- Ad hoc querying: I evaluate whether both SQL users and non-technical PMs can explore data freely through a query editor or visual builder.
- Data modeling: A solid modeling layer with reusable metrics and calculated fields keeps dashboards consistent as teams scale their reporting.
- Scheduled reporting and alerts: I look for automated report delivery and threshold alerts that push updates to Slack or email without manual follow-up.
Once I have a list of tools that meet this criteria, I consider what sets each platform apart.
Differentiating Factors (What Sets Vendors Apart)
Here's how I compare and contrast different vendors:
Standout Features
AI-powered insights help surface anomalies you'd otherwise miss, like a sudden drop in feature adoption after a release. Embedded analytics is another big one—it lets you place dashboards directly inside your product or internal tools. That keeps stakeholders from having to log into a separate platform. I also evaluate cohort and funnel analysis, which lets product teams track retention curves and conversion steps natively instead of stitching data together manually.
Beyond Features
Integration depth with your existing product stack is one of the first things I evaluate. A platform that connects natively to tools like Amplitude, Mixpanel, Snowflake, and Jira saves your team from building and maintaining custom pipelines. Pricing structure also matters—I look at whether a vendor offers lower-cost viewer seats so you can share dashboards with engineering and design without inflating costs. Self-service enablement rounds out my evaluation. Product managers who can build their own reports through a no-code interface or natural language queries reduce the bottleneck on data teams.
How to Choose Business Intelligence Platforms
It’s easy to get bogged down in long feature lists and complex pricing structures. To help you stay focused as you work through your unique software selection process, here’s a checklist of factors to keep in mind:
| Factor | What to Consider |
|---|---|
| Scalability | Will the platform support increasing data, users, or feature sets as your organization grows? Check for hidden costs as your data volume or team size expands. |
| Integrations | Does the platform connect natively to your most important tools and data sources, like CRMs, analytics, and warehouses? Avoid manual processes or data silos. |
| Customizability | How well can you adapt dashboards, reports, and permissions to your team's workflows or KPIs? Beware of rigid structures that slow iteration. |
| Ease of use | Can non-technical users create, access, and interact with dashboards, or is heavy training or ongoing IT support necessary for adoption? |
| Implementation and onboarding | How quickly can your team go from signup to actionable dashboards? Look for clear documentation, onboarding resources, and responsive vendor support. |
| Cost | Will the pricing structure fit your usage pattern as you grow? Check if per-user, per-query, or tiered models match how your organization plans to adopt BI. |
| Security safeguards | Are data access controls, SSO, and audit logs available? Confirm the platform supports your company’s data privacy policies and regulatory requirements. |
| Support availability | What channels are available and when? Does the vendor meet your support needs during implementation and after, especially when time-sensitive reporting is needed? |
What Are Business Intelligence Platforms?
Business intelligence platforms are software tools that help organizations connect, analyze, and visualize data from multiple sources. These platforms allow teams to create reports, interactive dashboards, and automated alerts, making it easier to track performance, uncover trends, and support informed business decisions.
Features of Business Intelligence Platforms
When selecting business intelligence platforms, keep an eye out for the following key features:
- Data integration: Connects with various data sources—databases, cloud services, spreadsheets—so you can combine business data for holistic analysis.
- Dashboarding: Lets users build and customize interactive dashboards that track KPIs, visualize trends, and display real-time updates.
- Data visualization: Provides charts, graphs, and tables to help teams understand patterns, spot outliers, and communicate insights clearly.
- Scheduled reporting: Enables automatic distribution of reports and dashboards to specific users or groups on a recurring basis.
- Role-based access: Manages permissions and restricts data access based on user roles, supporting compliance and security.
- Self-service analytics: Allows non-technical users to explore data, build their own reports, and answer questions without writing code.
- Collaboration tools: Supports commenting, annotation, and dashboard sharing for easier discussion and collective analysis.
- Data modeling: Lets you define measures, dimensions, and custom calculations needed for accurate and meaningful reporting.
- Mobile accessibility: Offers access to dashboards and analytics from smartphones and tablets, so teams can stay informed anywhere.
- Audit trails: Tracks changes, user actions, and report history to maintain transparency and support compliance requirements.
Common Business Intelligence Platforms AI Features
Beyond the standard business intelligence platforms features listed above, many of these solutions are incorporating AI with features like:
- Automated anomaly detection: Continuously scans data for unexpected changes or outliers, alerting teams to issues or opportunities without manual monitoring.
- Natural language querying: Lets users ask questions in plain language and receive instant, AI-generated answers or visualizations, making analytics accessible to everyone.
- Predictive analytics: Uses machine learning models to forecast trends, customer behavior, or business outcomes, helping teams plan ahead with data-driven insights.
- Automated insights generation: Surfaces key trends, correlations, and drivers in your data by generating narrative explanations and recommendations, saving time on manual analysis.
- AI-powered data preparation: Cleans, transforms, and enriches raw data using AI algorithms, reducing manual effort and improving data quality for reporting.
Benefits of Business Intelligence Platforms
Implementing business intelligence platforms provides several benefits for your team and your business. Here are a few you can look forward to:
- Real-time insights: Access up-to-date dashboards and dynamic reports to quickly identify trends and performance issues.
- Data-driven decisions: Use comprehensive data visualizations, integration, and analytics to inform choices and reduce guesswork.
- Greater collaboration: Share dashboards, leave comments, and control access easily for better teamwork and communication.
- Self-service analytics: Empower non-technical users to explore data and generate reports using intuitive, no-code interfaces.
- Enhanced data security: Manage permissions, monitor access, and maintain audit trails to protect sensitive business information.
- Automated reporting: Schedule and distribute reports automatically, saving time on manual work and ensuring consistency.
- Mobile accessibility: View and interact with analytics from any device so your team stays informed, even on the go.
Costs and Pricing of Business Intelligence Platforms
Selecting business intelligence platforms requires an understanding of the various pricing models and plans available. Costs vary based on features, team size, add-ons, and more. The table below summarizes common plans, their average prices, and typical features included in business intelligence platforms solutions:
Plan Comparison Table for Business Intelligence Platforms
| Plan Type | Average Price | Common Features |
|---|---|---|
| Free Plan | $0 | Basic dashboards, limited data sources, community support, and restricted sharing. |
| Personal Plan | $10-$25/user/month | Single-user analytics, increased storage, standard reporting tools, and email support. |
| Business Plan | $30-$70/user/month | Multi-user access, advanced dashboards, scheduled reporting, role-based permissions, and enhanced collaboration. |
| Enterprise Plan | $80-$150+/user/month | Unlimited users, custom integrations, advanced security, compliance management, dedicated support, and SLAs. |
Business Intelligence Platforms FAQs
Here are some answers to common questions about business intelligence platforms:
How do business intelligence platforms connect to different data sources?
Business intelligence platforms connect to data sources using built-in connectors, APIs, or database drivers to build secure data pipelines. You can link cloud storage, spreadsheets, databases, and business apps to pull in data automatically, allowing the business intelligence software to keep dashboards and reports up to date.
Can non-technical users build reports and dashboards?
Yes, most BI platforms offer no-code, drag-and-drop interfaces and guided workflows. This powerful self-service analytics setup allows non-technical users to create interactive visualizations and reports without needing to write code or rely on IT support.
What security features should I look for in a business intelligence platform?
Look for role-based access controls, data encryption, audit logs, and compliance certifications. These features help protect sensitive information, improve data management, and ensure only authorized users can access or modify data. Top-tier business intelligence tools will also offer advanced analytics features that maintain these data security protocols across the entire organization.
How long does it take to implement a business intelligence platform?
Implementation time varies, but many platforms offer onboarding resources like product tours, templates, and training videos to maximize operational efficiency quickly. Small teams can often get started with basic data analytics in days, while larger organizations may need several weeks for complex data integration and customization.
What support options are typically available?
Most platforms provide a mix of support channels, including live chat, email, phone, and online knowledge bases to help your team make an informed decision during rollout. Leading vendors recognized by Gartner also offer onboarding webinars, user communities, visual analytics workshops, and dedicated account managers to help teams fully adopt these analytics capabilities.