

10 Best UX Analytics Tools Reviewed in 2026

Best UX Analytics Tools Shortlist


As a product manager, you face the challenge of understanding user behavior and making data-driven decisions to enhance your product.
In my experience, UX analytics tools help bridge the gap between user interaction and actionable insights. They provide the data you need to make informed decisions and improve user satisfaction.
In this listicle, I'll share my top picks for UX analytics tools. I'll give you an unbiased review of each, focusing on how they can meet your team's specific needs. Let's dive into the details and discover the best solutions for enhancing your product's user experience.
Why Trust Our Software Reviews
We’ve been testing and reviewing product management software since 2020. As product managers ourselves, we know how critical and difficult it is to make the right decision when selecting software.
We invest in deep research to help our audience make better software purchasing decisions. We’ve tested more than 2,000 tools for different product management use cases and written over 1,000 comprehensive software reviews. Learn how we stay transparent & our software review methodology.
Best UX Analytics Tools Summary
This comparison chart summarizes pricing details for my top UX analytics tools selections to help you find the best one for your budget and business needs.
| Tool | Best For | Trial Info | Price | ||
|---|---|---|---|---|---|
| 1 | Best for closing analytics and in-app fixes in one loop | 14-day free trial | From $299/month | Website | |
| 2 | Best for user behavior tracking | Free plan available | Pricing upon request | Website | |
| 3 | Best for AI-driven behavioral analysis | Free plan available | Pricing upon request | Website | |
| 4 | Best for mobile app analytics | Free plan available | Pricing upon request | Website | |
| 5 | Best for enterprise friction scoring and VoC | Free demo available | Pricing upon request | Website | |
| 6 | Best for continuous product discovery at scale | Free demo available | Pricing upon request | Website | |
| 7 | Best for session replay | Free plan available | Pricing upon request | Website | |
| 8 | Best for automatic event tracking | Free plan available | Pricing upon request | Website | |
| 9 | Best for digital experience analytics | 15-day free trial + free plan + free demo available | From $39/month (billed annually) | Website | |
| 10 | Best for cross-functional UX and engineering triage | Free plan available | From $83/month | Website |
Best UX Analytics Tool Reviews
Below are my detailed summaries of the best UX analytics tools that made it onto my shortlist. My reviews offer a detailed look at the key features, pros & cons, integrations, and ideal use cases of each tool to help you find the best one for you.

Best for closing analytics and in-app fixes in one loop
My Evaluation Score
- Session Replay
- 5/5
- Event & Behavior Tracking
- 5/5
- Funnel & Journey Analysis
- 5/5
- Heatmaps & Click Tracking
- 1/5
- Frustration & Error Signals
- 5/5
- Segmentation & Cohort Analysis
- 4/5
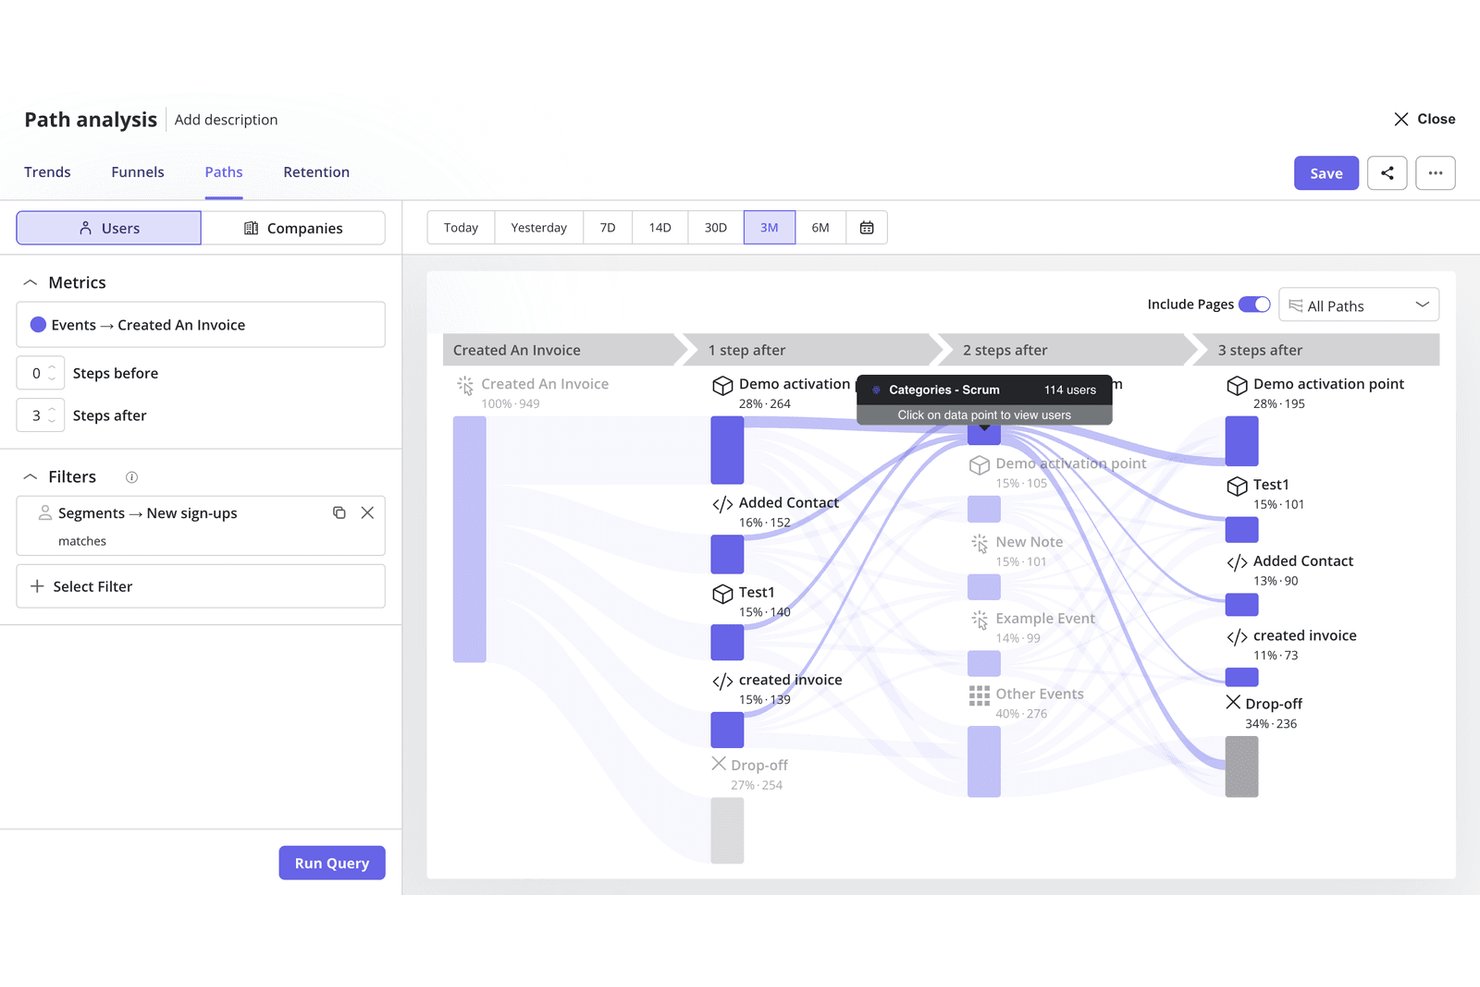
Userpilot is a product analytics and in-app engagement platform that combines session replay, funnel and path analysis, event tracking, frustration signal detection, and native survey tools with built-in in-app flow and guidance building.
Who Is Userpilot Best For?
Userpilot is a strong fit for product teams that want to move from spotting friction to fixing it without bouncing between tools.
Why I Picked Userpilot
Userpilot earns its spot on my shortlist because it's the only tool I've used where spotting a drop-off and deploying a fix happen inside the same platform. I can click from a funnel report directly into the session replays behind that exact drop-off, then launch an in-app flow or tooltip to address the friction without touching another tool. The AI-powered correlation analysis also automatically flags which frustration signals, like rage clicks or u-turns, are driving that drop-off.
Userpilot Key Features
- Retroactive event autocapture: Define new events against historical interaction data already captured, so you can run analysis without re-instrumenting your product.
- AI-powered correlation analysis: Automatically surfaces which user attributes, events, and frustration signals correlate with funnel conversion or drop-off across your reports.
- Native NPS, CSAT, and CES surveys: Trigger behavioral surveys based on specific in-app events, then tie responses directly to retention and engagement data in the same platform.
- MCP Server: Connects your Userpilot product data to external AI tools like Claude, ChatGPT, and Microsoft Copilot so you can query behavioral insights without leaving those environments.
Userpilot Integrations
Userpilot offers native integrations with Segment, Amplitude, Mixpanel, Heap, Google Analytics, Google Tag Manager, Intercom, Slack, HubSpot, and Salesforce. It also supports APIs, webhooks, and Enterprise Data Warehouse Sync.
Pros and Cons
Pros:
- Launch in-app fixes from analytics reports
- Detects frustration signals like rage, dead clicks
- Funnels connect directly to session replays
Cons:
- Most advanced analytics features gated by plan
- No heatmaps for aggregate click visualization
Mixpanel
Best for user behavior tracking

My Evaluation Score
- Session Replay
- 5/5
- Event & Behavior Tracking
- 5/5
- Funnel & Journey Analysis
- 5/5
- Heatmaps & Click Tracking
- 4/5
- Frustration & Error Signals
- 3/5
- Segmentation & Cohort Analysis
- 5/5
Mixpanel is an analytics tool tailored for businesses aiming to track user behavior and interactions with their products. Its main users include product managers and data analysts who need to understand user journeys and engagement.
Why I picked Mixpanel: It specializes in user behavior tracking, allowing you to analyze how users interact with your product in real-time. You can create detailed funnels to track conversion paths and identify drop-off points. Mixpanel also offers cohort analysis, helping you segment users based on their actions over time. This combination of features makes it ideal for understanding user engagement deeply.
Standout features & integrations:
Features include A/B testing to optimize user experiences, push notifications that engage users directly, and retention reports that help you understand user loyalty. These features are designed to give you actionable insights into user behavior.
Integrations include Segment, Zapier, Salesforce, HubSpot, Google Ads, Marketo, Amplitude, Optimizely, Slack, and Intercom.
Pros and Cons
Pros:
- Supports A/B testing
- Customizable dashboards
- Detailed cohort analysis
Cons:
- Advanced features require coding skills
- Slight learning curve

Best for AI-driven behavioral analysis
My Evaluation Score
- Session Replay
- 5/5
- Event & Behavior Tracking
- 5/5
- Funnel & Journey Analysis
- 5/5
- Heatmaps & Click Tracking
- 4/5
- Frustration & Error Signals
- 4/5
- Segmentation & Cohort Analysis
- 5/5
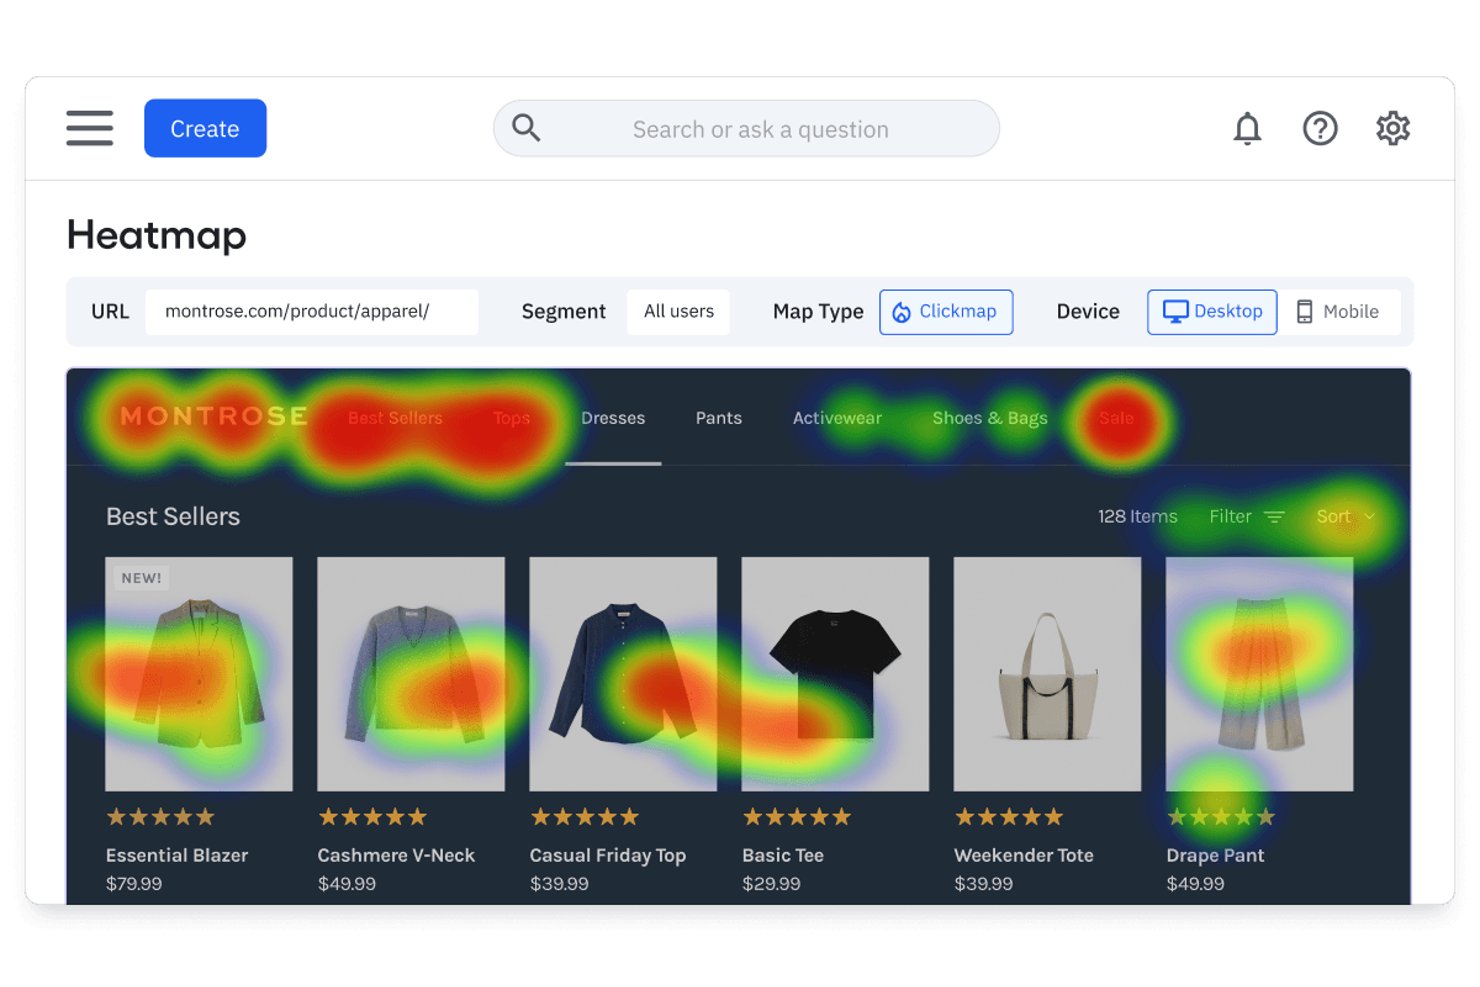
Amplitude is a product analytics platform that combines session replay, heatmaps, funnel analysis, behavioral cohorts, and built-in experimentation with AI-powered agents that surface insights across all of your data.
Who Is Amplitude Best For?
Amplitude is a strong fit for product and growth teams that need behavioral analytics, experimentation, and session replay in a single platform rather than stitched-together point solutions.
Why I Picked Amplitude
Amplitude earns its spot on my shortlist because its AI-driven behavioral analysis goes beyond passive dashboards in ways I haven't seen matched. The Session Replay Agent automatically summarizes sessions and surfaces friction points without manual review, while the Global Agent answers natural language questions like "why are new users dropping before setup?" by synthesizing data across your entire product. I also love that retroactive funnel analysis lets you apply newly defined events to historical data instantly, no re-instrumentation required.
Amplitude Key Features
- Behavioral cohorts: Save groups of users defined by specific in-product actions and reuse them across charts, session replays, experiments, and surveys.
- Web and mobile experimentation: Run A/B tests and feature flag experiments natively, with session replays attached directly to variant results for qualitative validation.
- Guides and surveys: Deploy in-app onboarding guides, NPS prompts, and feedback widgets with session replay linked to moments of feedback collection.
- Visual labeling: Tag UI elements and define named events directly from the Amplitude interface without writing any code.
Amplitude Integrations
Amplitude offers 60+ native integrations, including Twilio Segment, Snowflake, Google BigQuery, Salesforce, HubSpot, Zendesk, Intercom, Braze, and Google Analytics 4. It also provides HTTP, Batch, export, and DSAR APIs for custom data workflows.
Pros and Cons
Pros:
- Retroactive funnel analysis on historical product data
- Behavioral cohorts reusable across analytics and experiments
- AI-powered session replay summarizes friction automatically
Cons:
- No native mobile app heatmaps yet available
- Heatmaps require top-tier plan with add-on

UXCam
Best for mobile app analytics

My Evaluation Score
- Session Replay
- 5/5
- Event & Behavior Tracking
- 4/5
- Funnel & Journey Analysis
- 5/5
- Heatmaps & Click Tracking
- 5/5
- Frustration & Error Signals
- 5/5
- Segmentation & Cohort Analysis
- 4/5
UXCam is a mobile app analytics tool designed to help businesses understand user behavior on their mobile applications. Its main users are app developers and product managers who need insights into app performance and user interactions.
Why I picked UXCam: It excels in mobile app analytics, offering features like session replay to visualize user actions. You can analyze heatmaps to see where users tap and scroll within your app. UXCam also provides crash analytics, helping you identify and resolve issues quickly. These capabilities make it a comprehensive choice for improving your app's user experience.
Standout features & integrations:
Features include funnel analytics that track user journeys through your app, gesture detection that identifies user actions like swipes and pinches, and screen flow analysis that maps out how users navigate through your app. These features provide deep insights into user behavior.
Integrations include Google Analytics, Segment, Mixpanel, Amplitude, Firebase, Adjust, AppsFlyer, Kochava, Airship, and Braze.
Pros and Cons
Pros:
- Offers screen flow mapping and gesture detection
- Provides funnel analytics
- Detailed session replays
Cons:
- Requires technical setup
- High pricing for small teams

Glassbox
Best for enterprise friction scoring and VoC
My Evaluation Score
- Session Replay
- 5/5
- Event & Behavior Tracking
- 5/5
- Funnel & Journey Analysis
- 5/5
- Heatmaps & Click Tracking
- 4/5
- Frustration & Error Signals
- 5/5
- Segmentation & Cohort Analysis
- 4/5
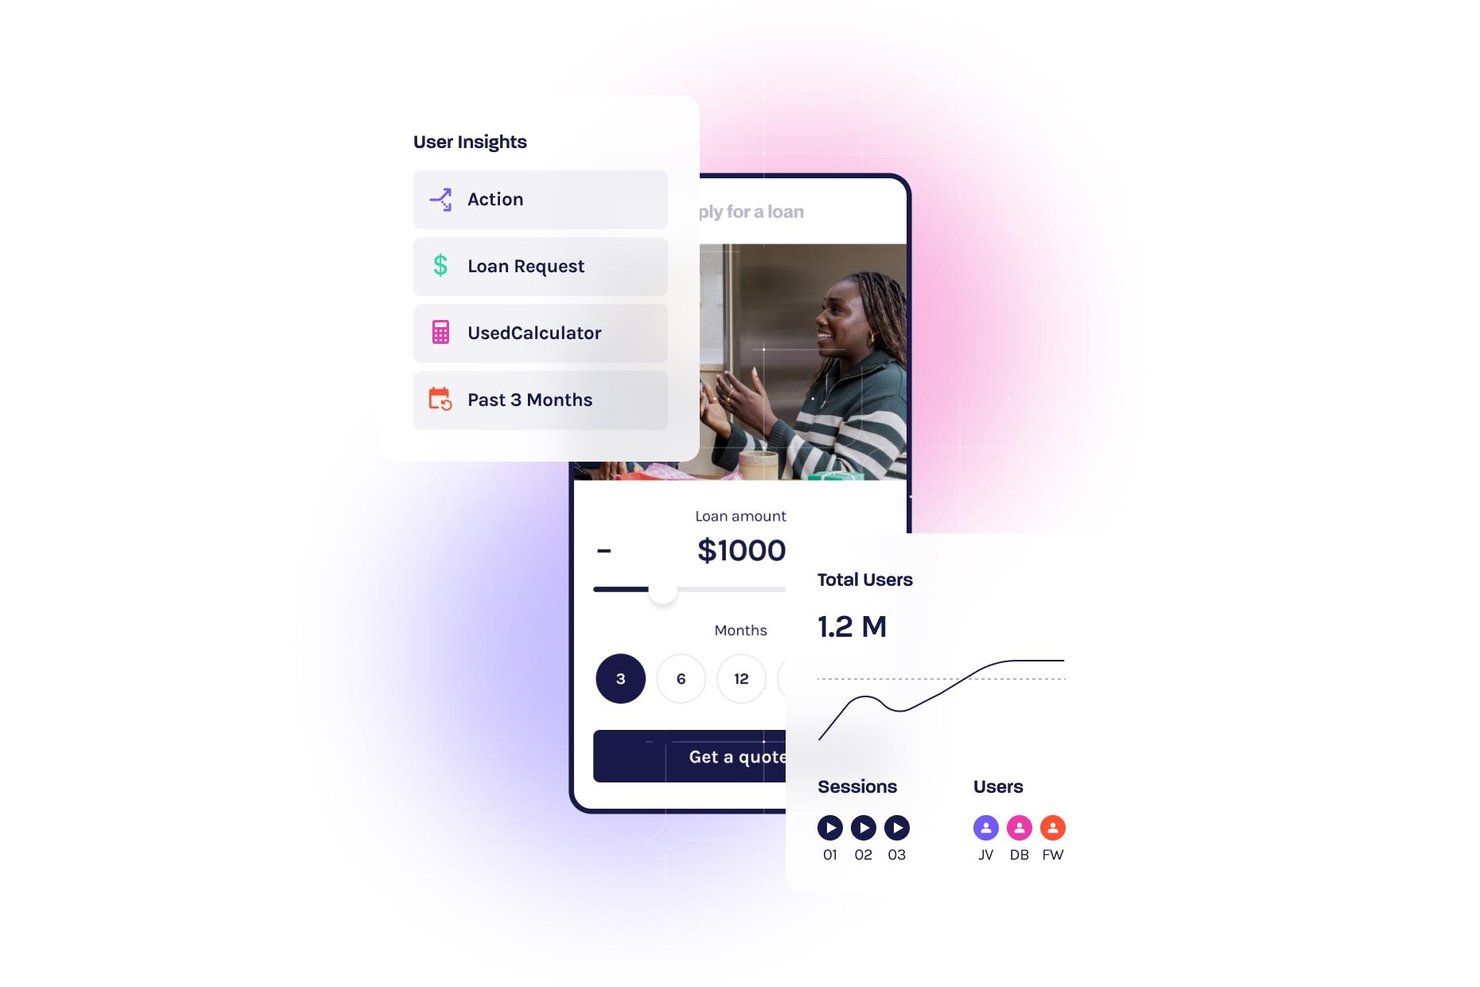
Glassbox is an enterprise UX analytics platform that combines session replay, tagless autocapture, interaction maps, funnel analysis, friction scoring, and native VoC tools across web and mobile.
Who Is Glassbox Best For?
Glassbox is a strong fit for enterprise product and CX teams in regulated industries—like financial services, healthcare, and retail—who need deep behavioral data without the overhead of manual instrumentation.
Why I Picked Glassbox
Glassbox earns its spot on my shortlist because of its proprietary Struggle Score, which quantifies friction across 30+ behavioral signals—rage clicks, u-turns, error clicks—and ties each directly to revenue impact. I love that this isn't just flagging annoyances; it lets product and CX teams rank UX problems by business cost and act on the highest-priority issues first. The Voice of the Silent feature extends that picture further by using AI to apply VoC sentiment from survey respondents to the 95%+ of users who never fill one out.
Glassbox Key Features
- Tagless autocapture: Glassbox automatically records every click, scroll, form input, and server-side event without any manual tagging or engineering instrumentation.
- Augmented Journey Map: A single cross-channel visualization maps the full customer journey from acquisition to conversion across web and mobile in one view.
- GIA (Glassbox Insights Assistant): A generative AI assistant lets you query session data, generate session summaries, and surface behavioral insights using natural language.
- Mobile app analytics: Dedicated SDKs for iOS, Android, React Native, Flutter, and five other frameworks deliver session replay, interaction maps, and crash analytics for native mobile apps.
Glassbox Integrations
Glassbox offers native integrations with Adobe Analytics, Google Analytics 4, Qualtrics, Medallia, Optimizely, VWO, Jira, and Slack. An open API supports custom integrations.
Pros and Cons
Pros:
- AI surfaces hidden session insights instantly
- Tagless autocapture eliminates manual event tagging
- Quantifies friction using proprietary Struggle Score
Cons:
- Can overwhelm teams with session data volume
- Requires sales demo to access platform

Best for continuous product discovery at scale
My Evaluation Score
- Session Replay
- 5/5
- Event & Behavior Tracking
- 5/5
- Funnel & Journey Analysis
- 5/5
- Heatmaps & Click Tracking
- 5/5
- Frustration & Error Signals
- 5/5
- Segmentation & Cohort Analysis
- 4/5
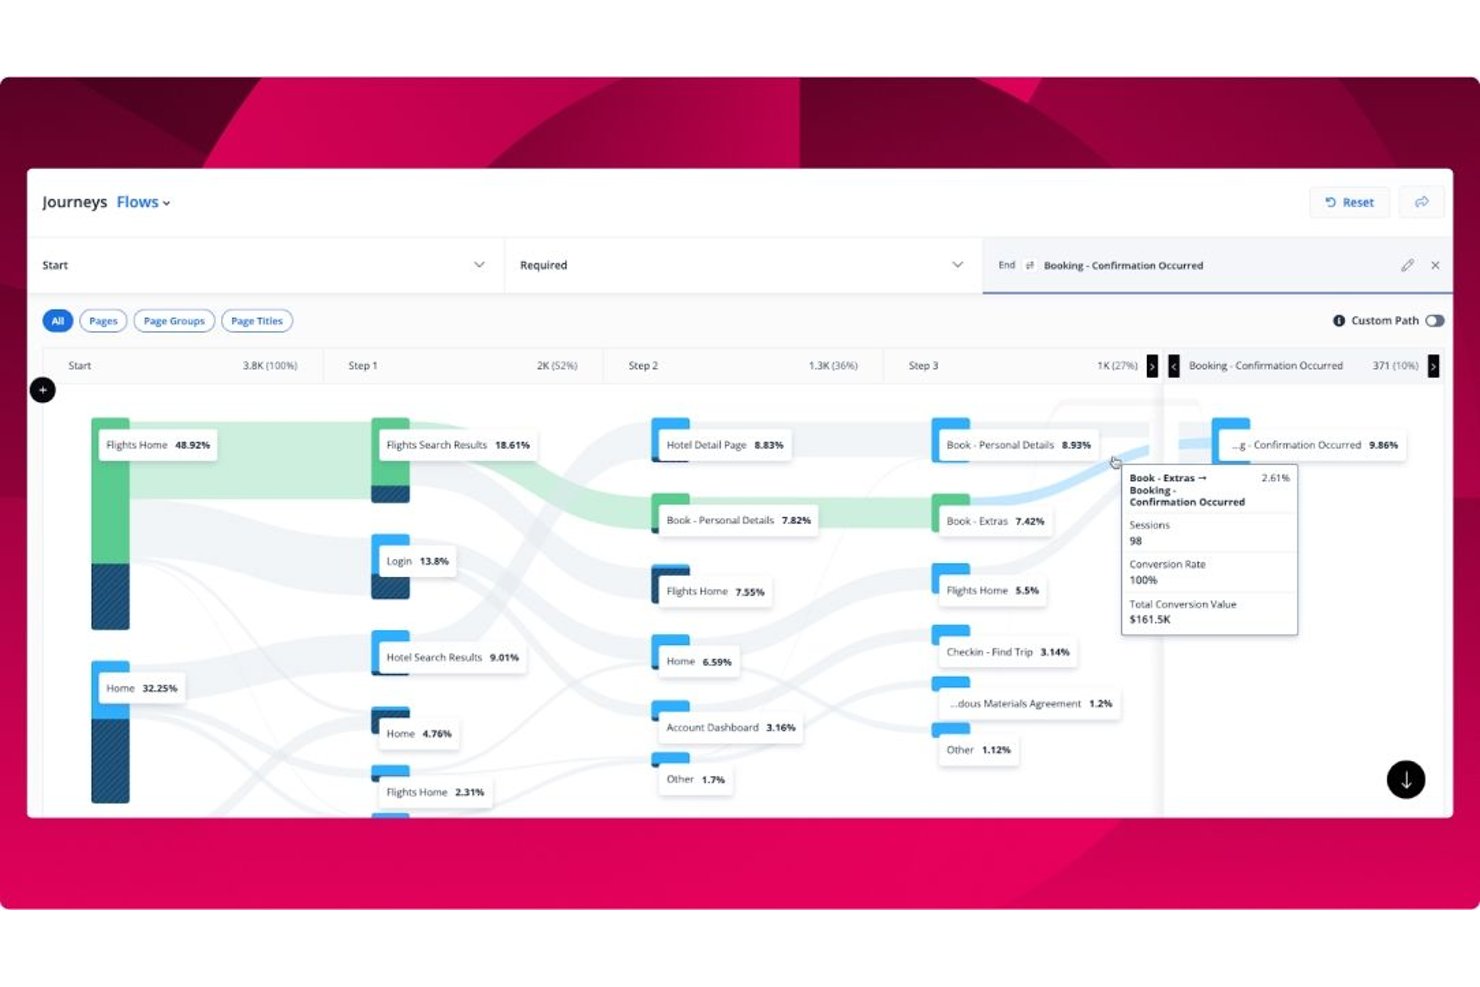
Quantum Metric is an enterprise UX analytics platform that combines 100% unsampled session replay, interaction heatmaps, funnel and journey analysis, AI-powered insight surfacing via Felix AI Agentic, and voice of customer integration across web and native mobile apps.
Who Is Quantum Metric Best For?
Quantum Metric is a strong fit for enterprise product and digital teams that need to connect behavioral data to business impact across web and native mobile at high traffic volumes.
Why I Picked Quantum Metric
Quantum Metric earns its spot on my shortlist because no other platform I've evaluated makes continuous product discovery feel as automatic at enterprise scale. Felix AI Agentic runs autonomously in the background, monitoring your KPIs and surfacing revenue-impacting friction before you think to look for it. Pair that with Opportunity Analysis, which quantifies the business impact of specific drop-offs across web and native mobile journeys, and your team spends less time hunting for problems and more time fixing the right ones.
Quantum Metric Key Features
- Felix AI Chat: A natural language interface that lets you ask plain-English questions about your behavioral data and get direct answers without writing queries.
- Server-side data capture: Sends critical events like transactions and sign-ups directly from your servers, appending them to live session replays even when client-side capture fails.
- AutoPII scanning: Continuously scans for unintended personally identifiable information capture and enforces privacy masking by default across all session data.
- Data streaming: Exports your behavioral data to destinations like Snowflake, Azure, and Databricks for integration with your existing BI and data infrastructure.
Quantum Metric Integrations
Quantum Metric integrates with Qualtrics, Optimizely, Split, UserTesting, Snowflake, Azure, Databricks, Looker, Tealium, and Slack, with data streaming to 20+ destinations. APIs, webhooks, and tag manager integrations support custom connectivity.
Pros and Cons
Pros:
- Enables funnel creation directly from session replays
- Offers 100% unsampled session replay data
- Detects revenue-impacting friction with Felix AI
Cons:
- Data sometimes mismatches other analytics tools
- Advanced segmentation can be confusing for teams

Best for session replay

My Evaluation Score
- Session Replay
- 5/5
- Event & Behavior Tracking
- 5/5
- Funnel & Journey Analysis
- 5/5
- Heatmaps & Click Tracking
- 4/5
- Frustration & Error Signals
- 5/5
- Segmentation & Cohort Analysis
- 4/5
Fullstory is a digital experience analytics platform that helps businesses understand user interactions through session replay. Its main users are UX designers and product teams who need detailed insights into user behavior on websites and apps.
Why I picked Fullstory: It excels in session replay, allowing you to view complete user sessions to identify pain points. You can use heatmaps to visualize user engagement across your site. Fullstory also offers event funnels that help track user paths and analyze conversions. These tools provide a comprehensive view of user experiences, making it easier to optimize your digital presence.
Standout features & integrations:
Features include conversion analysis that tracks the success of user journeys, error detection that alerts you to issues impacting user experience, and custom event tracking that allows you to monitor specific user actions. These features work together to enhance your understanding of user interactions.
Integrations include Slack, Segment, Google Analytics, Optimizely, Mixpanel, HubSpot, Salesforce, Jira, Trello, and Zendesk.
Pros and Cons
Pros:
- Custom event tracking
- Effective error detection
- High-quality session replays
Cons:
- Advanced features need training
- High resource usage

Heap
Best for automatic event tracking
My Evaluation Score
- Session Replay
- 5/5
- Event & Behavior Tracking
- 5/5
- Funnel & Journey Analysis
- 5/5
- Heatmaps & Click Tracking
- 4/5
- Frustration & Error Signals
- 5/5
- Segmentation & Cohort Analysis
- 5/5
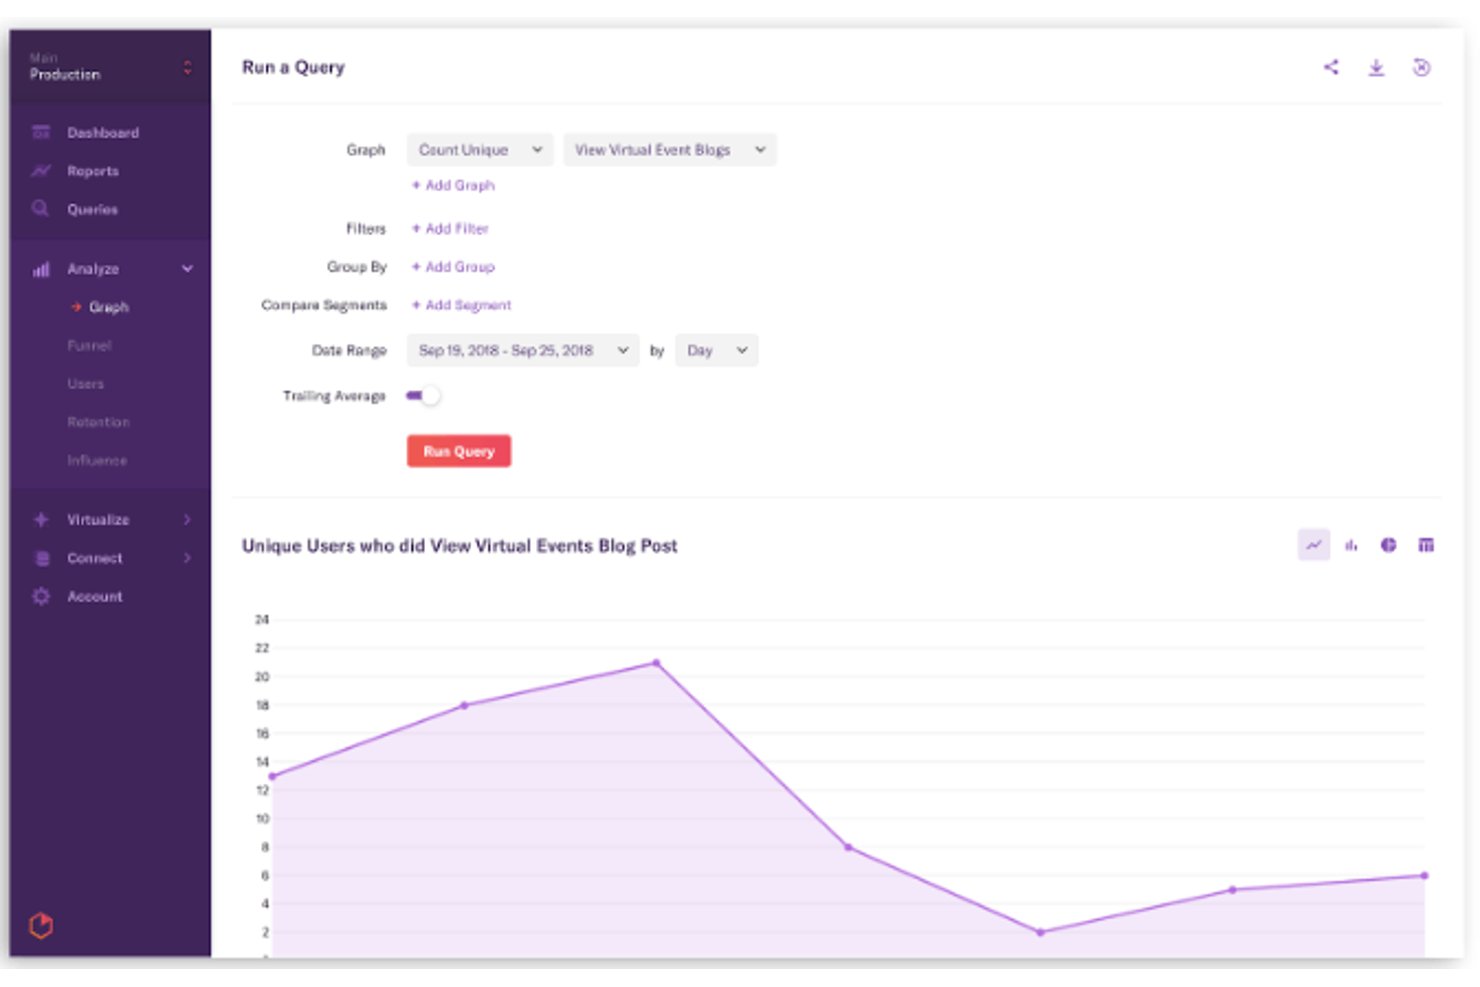
Heap is a UX analytics platform that automatically captures every user interaction—clicks, taps, pageviews, and form fills—across web and mobile, and pairs that behavioral data with funnel analysis, journey mapping, session replay, and AI-powered insight surfacing.
Who Is Heap Best For?
Heap works best for product teams that need immediate behavioral insights without waiting on engineering to instrument every event.
Why I Picked Heap
Heap earns its spot on my shortlist because its autocapture approach genuinely changes what's possible in product analytics. From the moment you drop in a single code snippet, Heap records every click, tap, pageview, and form fill automatically, with no manual event tagging required. What I find most valuable is that you can define new events and build funnels retroactively against historical data, so a question you didn't think to ask six months ago can still be answered today.
Heap Key Features
- Sense Chat: A generative AI assistant that lets any team member ask plain-language questions about user behavior and automatically generates charts from the response.
- Heap Illuminate: A data science layer that proactively surfaces top events, high-impact user segments, and friction patterns without any manual configuration.
- Session Replay Summaries: AI-generated summaries of individual session recordings that highlight key moments, reducing the need to watch full replays.
- Heap Connect: A managed ETL solution that syncs behavioral data to Snowflake or BigQuery for enrichment and analysis alongside external data sources.
Heap Integrations
Heap offers 100+ integrations, including Snowflake, BigQuery, Salesforce, HubSpot, Intercom, Segment, RudderStack, Shopify, and WalkMe. Client-side and server-side APIs support custom integrations and data enrichment.
Pros and Cons
Pros:
- Automatic capture of all user interactions
- AI-powered insight surfacing and chat assistant
- Retroactive event definition on historical data
Cons:
- No built-in A/B testing or surveys
- Session replay requires a paid add-on

My Evaluation Score
- Session Replay
- 5/5
- Event & Behavior Tracking
- 5/5
- Funnel & Journey Analysis
- 5/5
- Heatmaps & Click Tracking
- 5/5
- Frustration & Error Signals
- 5/5
- Segmentation & Cohort Analysis
- 5/5
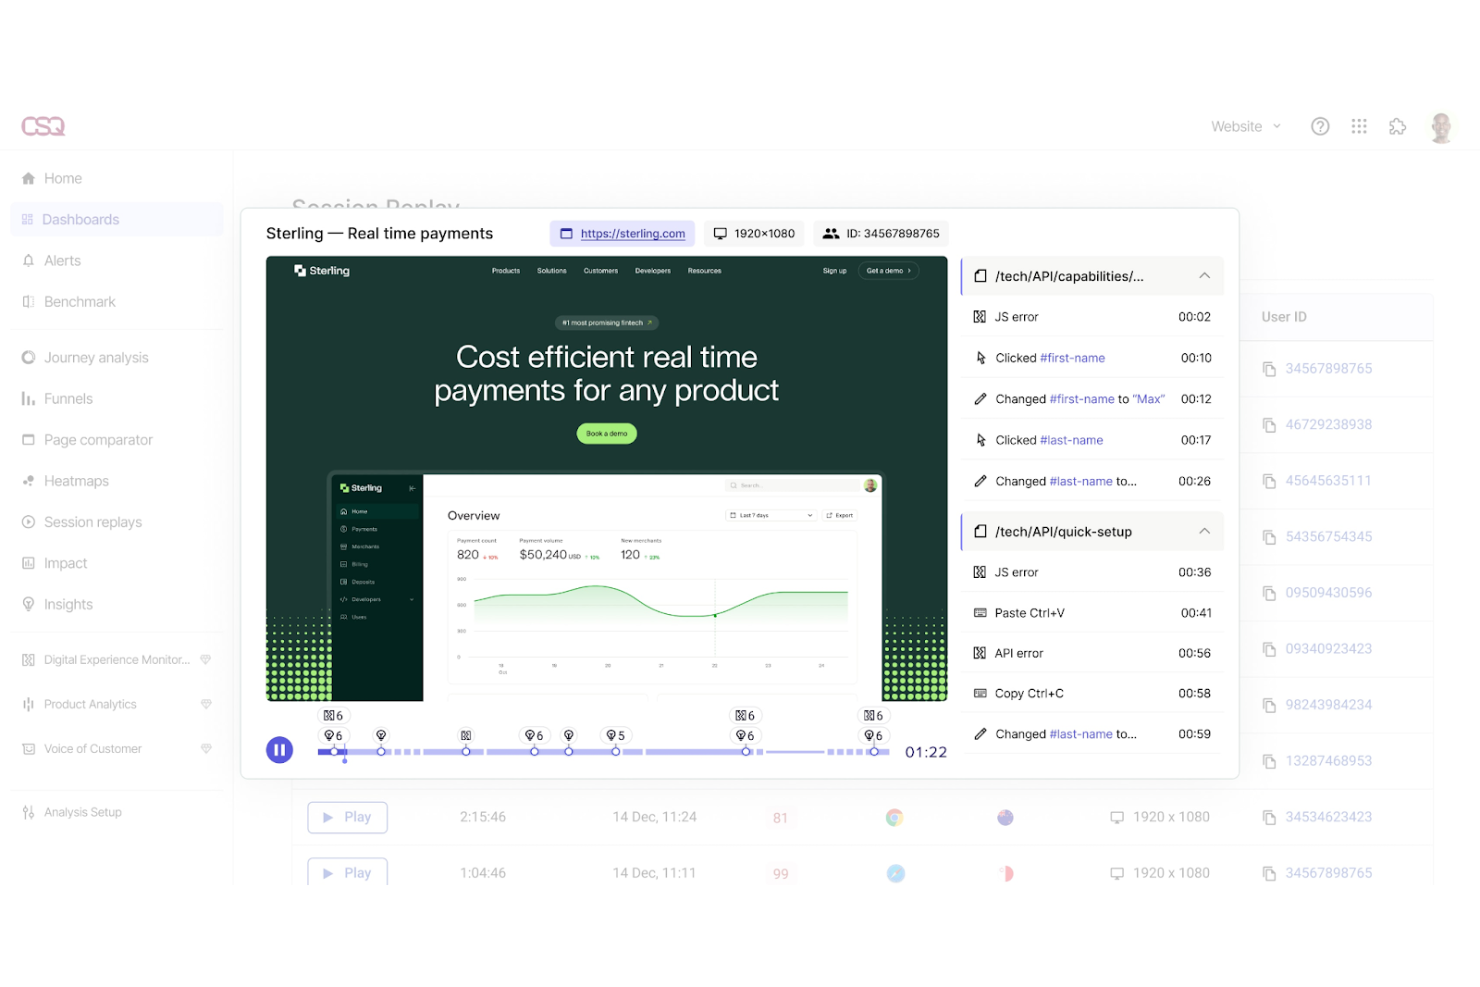
Contentsquare is a digital experience analytics platform designed to help businesses understand and improve user interactions on their websites and apps. Its primary users are digital marketers and UX designers who need insights into user behavior and engagement.
Why I picked Contentsquare: It specializes in digital experience analytics, offering features like zone-based heatmaps that provide detailed insights into user engagement on different page elements. You can use journey analysis to track user paths and identify drop-off points. Contentsquare also provides session replay, allowing you to visualize user interactions in real-time. These tools help you make data-driven improvements to your digital experiences.
Standout features & integrations:
Features include impact quantification that measures the effect of changes on user behavior, behavioral alerts that notify you of significant user activity changes, and AI-based insights that highlight key user trends. These features work together to enhance your understanding of user interactions.
Integrations include Google Analytics, Adobe Analytics, Salesforce, Tealium, Segment, Optimizely, HubSpot, Shopify, Adobe Commerce, and WordPress.
Pros and Cons
Pros:
- Real-time session replay
- Effective journey analysis
- Detailed zone-based heatmaps
Cons:
- Advanced features need training
- Slight learning curve

My Evaluation Score
- Session Replay
- 5/5
- Event & Behavior Tracking
- 5/5
- Funnel & Journey Analysis
- 5/5
- Heatmaps & Click Tracking
- 5/5
- Frustration & Error Signals
- 5/5
- Segmentation & Cohort Analysis
- 4/5
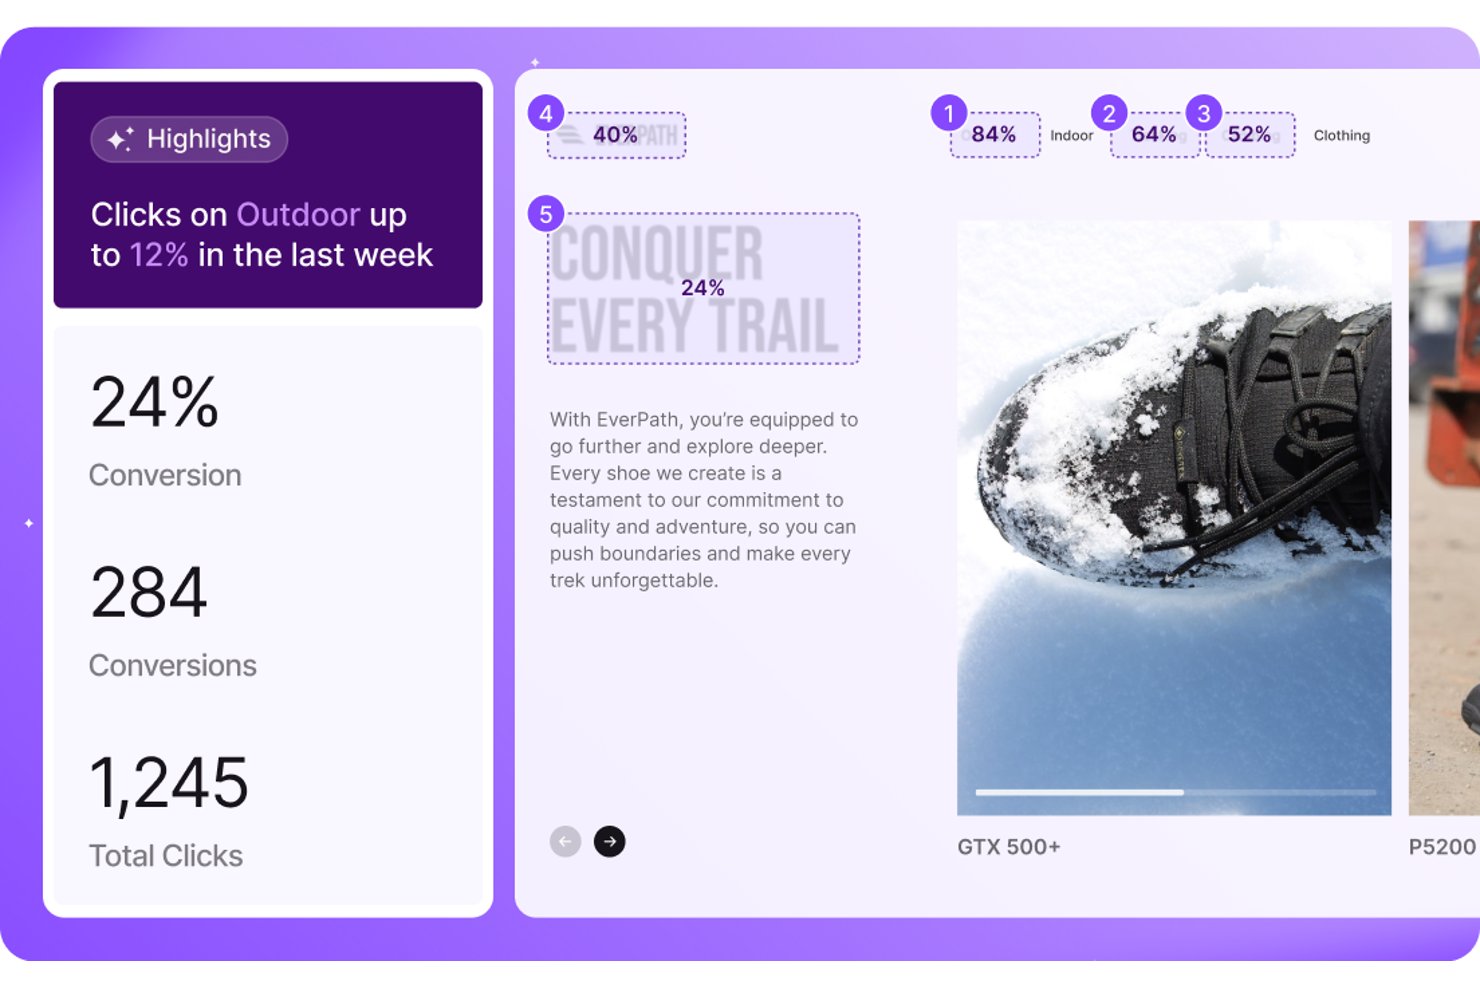
LogRocket is a UX analytics platform that combines session replay, heatmaps, conversion funnels, path analysis, and AI-powered issue detection across web and native mobile apps.
Who Is LogRocket Best For?
LogRocket is a strong fit for product and engineering teams that need a shared tool to diagnose UX problems and reproduce bugs without endless back-and-forth.
Why I Picked LogRocket
LogRocket earns its spot on my shortlist because it's the rare UX analytics tool that product and engineering teams actually share. What makes it click for cross-functional triage is Galileo AI, which auto-detects rage clicks, dead clicks, and error states, scores them by business impact, and pushes reproduction steps directly to Slack or your AI coding environment. Pair that with retroactive Definitions, where you label a UI element today and instantly query all historical sessions for it, and the back-and-forth between product and engineering shrinks fast.
LogRocket Key Features
- Autocapture with retroactive definitions: A single-line script captures every event automatically, and newly created event labels apply instantly to all historical session data.
- Native mobile SDKs: Dedicated SDKs for iOS, Android, React Native, Flutter, Ionic, and Expo deliver pixel-perfect session replay and full UX analytics on mobile.
- Conversion funnels with session drill-down: Multi-step funnel analysis lets you click directly into session replays from any drop-off point for full behavioral context.
- AI feedback analysis: Aggregates user feedback from tools like Zendesk, Qualtrics, and Gong, groups it into themes, and links each theme to correlated session replays.
LogRocket Integrations
LogRocket offers 75+ integrations, including Sentry, Zendesk, Qualtrics, Optimizely, LaunchDarkly, Jira, Snowflake, and BigQuery. It also supports Slack, Microsoft Teams, API access, and MCP connectivity for custom workflows.
Pros and Cons
Pros:
- Galileo AI automates UX issue detection
- Autocapture with retroactive event definitions
- Session replay fidelity is pixel-perfect
Cons:
- Several features unavailable on mobile apps
- Steep pricing for higher session volumes
Other UX Analytics Tools
Here are some additional UX analytics tools options that didn’t make it onto my shortlist, but are still worth checking out:
- Pendo
For closing the loop from data to in-app action
- PostHog
For open-source product analytics
- Crazy Egg
For A/B testing insights
- Inspectlet
For real-time user monitoring
- Smartlook
For funnel drop-off replay on web and mobile
- Lucky Orange
For e-commerce UX and frustration signals
- Mouseflow
For friction scoring across all sessions
- Microsoft Clarity
For free, no-cap behavioral analytics


How I Evaluate UX Analytics Tools
I evaluate UX analytics tools in two layers: the baseline capabilities—session replay, heatmaps, funnel analysis—a tool must have, and the differentiators that set the best apart.
Core Functionality (Table Stakes For This List)
When I'm selecting tools for my list, I rank each one on a scale from 0 (does not offer the functionality) to 5 (excels in this area) for each core functionality listed below. Then, I calculate the tool's total score into a percentage. Each tool needs to achieve a minimum total score of 65% to be considered for inclusion.
- Session Replay: I look for playback quality, filtering options, and privacy controls—like whether I can quickly find sessions where a user abandoned a checkout flow or hit a JS error.
- Heatmaps & Click Tracking: Good heatmaps should handle dynamic content and SPAs, not just static pages. I check whether tools support scroll, click, and move maps with segmentation.
- Funnel & Journey Analysis: I evaluate how flexible funnel building is—can I define custom multi-step funnels, see where users drop off, and compare conversion across segments?
- Event & Behavior Tracking: Whether a tool offers autocapture or requires manual instrumentation matters. I look at how easily teams can tag buttons, form fields, and in-app actions.
- Segmentation & Cohort Analysis: Filtering sessions or heatmaps by user attributes like plan type, device, or signup date is essential for understanding behavior across different user groups.
- Frustration & Error Signals: Tools that detect rage clicks, dead clicks, and u-turns help surface usability problems faster than combing through raw session recordings manually.
Once I have a list of tools that meet the criteria, I consider what sets each platform apart.
Differentiating Factors (What Sets Vendors Apart)
Here's how I compare and contrast different vendors:
Standout Features
AI-powered insights save hours of manual analysis by flagging behavioral anomalies automatically—like a sudden spike in rage clicks on a newly shipped feature. Retroactive analysis is another differentiator I value. Applying new event definitions to historical data means your team doesn't wait weeks after re-instrumenting to get results. For teams building mobile products, I also check whether a tool offers native SDKs with gesture tracking and app-specific heatmaps.
Beyond Features
Privacy and compliance matter when session recordings capture real user interactions. I check for PII masking, consent management, and certifications like SOC 2 or GDPR readiness—especially for teams handling sensitive user data. Tech stack fit is equally important. A UX analytics tool should connect to where your team already works, whether that's pushing insights into Jira tickets or piping event data through Segment. I also evaluate pricing transparency, since session-based or MTU-based models can balloon quickly as your product scales.
How to Choose UX Analytics Tools
It’s easy to get bogged down in long feature lists and complex pricing structures. To help you stay focused as you work through your unique software selection process, here’s a checklist of factors to keep in mind:
| Factor | What to Consider |
| Scalability | Ensure the tool can grow with your business. It should handle increasing data volumes as your user base expands, without sacrificing performance. |
| Integrations | Check for compatibility with existing software your team uses, like CRM systems or marketing platforms, to ensure seamless data flow across tools. |
| Customizability | Look for tools that allow you to tailor dashboards and reports to fit your team’s specific needs and workflows. |
| Ease of Use | The interface should be intuitive and require minimal training, allowing your team to quickly adopt and use the tool effectively. |
| Budget | Consider both upfront costs and long-term pricing plans. Ensure the tool fits your budget and offers good value for its features. |
| Security Safeguards | Evaluate data protection measures, such as encryption and access controls, to ensure your user data is secure and compliant with regulations. |
| Support | Reliable customer support is crucial. Look for 24/7 availability and multiple contact options to assist with any issues your team may encounter. |
| Analytics Depth | Assess the level of detail in analytics provided. The tool should offer deep insights into user behavior, helping you make informed decisions. |
Trends in UX Analytics Tools
In my research, I sourced countless product updates, press releases, and release logs from different UX analytics tools vendors. Here are some of the emerging trends I’m keeping an eye on:
- AI-Driven Insights: AI is increasingly being used to provide deeper insights into user behavior. Tools are leveraging machine learning to predict trends and automate data analysis, helping teams make faster decisions. Vendors like Contentsquare are incorporating AI to highlight user trends.
- Cross-Channel Analytics: Businesses want to track user behavior across multiple channels. Tools are evolving to provide a unified view of user interactions across websites, apps, and other digital touchpoints. This trend helps teams understand the full customer journey.
- Privacy-First Analytics: With growing concerns about data privacy, tools are focusing on providing analytics without compromising user privacy. Features like anonymized data collection are becoming more common, ensuring compliance with regulations like GDPR.
- Real-Time Collaboration: As remote work continues, the ability for teams to collaborate in real-time on analytics is gaining traction. Tools are integrating features that allow teams to share insights and work together on data analysis instantly.
- Emphasis on User Experience: Beyond just data, there's a shift toward enhancing the user experience within the analytics tools themselves. Vendors are prioritizing intuitive interfaces and user-friendly designs, making it easier for teams to engage with analytics data.
What Are UX Analytics Tools?
UX analytics tools are a type of web analytics tool designed to help teams understand how users interact with digital products. Commonly used by UX designers, product managers, and marketers, these tools combine behavior data and qualitative insights to improve customer experience.
Features like heatmaps, session replays, and conversion tracking allow teams to uncover usability issues, monitor individual user behavior, and refine digital experiences. By turning both quantitative and qualitative data into actionable insights, these tools support data-driven design decisions that improve overall user satisfaction.
Features of UX Analytics Tools
When selecting UX analytics tools, look for key features that support both quantitative tracking and qualitative user research:
- Heatmaps: Visualize click, scroll, and hover activity to identify user engagement hotspots and friction points.
- Session replays: Observe individual user sessions to pinpoint usability issues, rage clicks, and drop-offs.
- Conversion tracking: Analyze conversion funnels and find where users abandon their journey.
- Real-time analytics: Access live behavior data to react quickly to emerging patterns or problems.
- Customizable dashboards: Display metrics in a way that aligns with your team’s goals and workflows.
- Behavioral alerts: Get notified when unexpected patterns emerge such as spikes in exit rates or navigation loops.
- Cohort analysis: Segment users by behavior or attributes to understand trends across different audiences.
- Privacy-first data collection: Respect user privacy while still gathering meaningful insights.
- Cross-channel tracking: Monitor the full user journey across mobile apps, websites, and other digital touchpoints.
- User feedback integration: Combine direct input with behavior tracking to get a fuller picture of the user experience.
Benefits of UX Analytics Tools
Implementing UX analytics tools provides several benefits for your team and your business. Here are a few you can look forward to:
- Improved user experience: By analyzing heatmaps and session replays, you can identify and fix pain points, leading to smoother user interactions.
- Data-driven decisions: Real-time analytics and conversion tracking provide insights that help your team make informed choices.
- Increased conversion rates: Understanding drop-off points through conversion tracking enables you to optimize the user journey and boost conversions.
- Enhanced customer satisfaction: By integrating user feedback and cohort analysis, you can tailor experiences to meet user needs better.
- Timely issue resolution: Behavioral alerts ensure you quickly address any significant changes in user behavior, maintaining a positive experience.
- Holistic view of user journeys: Cross-channel tracking gives you a comprehensive picture of user interactions, helping you craft cohesive strategies.
- Regulatory compliance: Privacy-first data collection ensures that your data practices align with regulations, safeguarding user information.
Costs and Pricing of UX Analytics Tools
Selecting UX analytics tools requires an understanding of the various pricing models and plans available. Costs vary based on features, team size, add-ons, and more. The table below summarizes common plans, their average prices, and typical features included in UX analytics tools solutions:
Plan Comparison Table for UX Analytics Tools
| Plan Type | Average Price | Common Features |
| Free Plan | $0 | Basic heatmaps, limited session replays, and standard analytics. |
| Personal Plan | $5-$50/user/month | Heatmaps, session replays, basic conversion tracking, and limited custom reports. |
| Business Plan | $50-$150/ user/month | Advanced conversion tracking, real-time analytics, user feedback integration, and customizable dashboards. |
| Enterprise Plan | $150+/user/month | Cross-channel tracking, behavioral alerts, AI-driven insights, and dedicated support. |
UX Analytics Tools FAQs
Here are some answers to common questions about UX analytics tools:
Do UX designers need to know data analytics?
Yes, UX designers benefit from understanding data analytics as it informs design decisions. Knowing how to interpret data from user interactions helps you optimize designs and enhance user experiences. Data analytics supports key decisions in the design process by highlighting areas for improvement.
What are external analytics tools?
External analytics tools include popular platforms like Google Analytics, Hotjar, and Mixpanel. These tools provide valuable insights into user behavior, helping you understand how users interact with your digital products and identify areas for optimization.
How do UX analytics tools integrate with existing systems?
UX analytics tools often integrate with CRM systems, marketing platforms, and other business tools. These integrations enable seamless data flow, helping you consolidate information and gain a comprehensive view of user interactions across different channels.
Can UX analytics tools help with conversion rate optimization?
Yes, UX analytics tools play a key role in conversion rate optimization by tracking user journeys and identifying drop-off points. By analyzing this data, you can make informed changes to improve user flow and increase conversion rates on your digital platforms.
What's Next?
Don't forget to subscribe to our newsletter, plus the latest podcasts, interviews, and other insights from industry leaders and experts.