10 Key Product Analytics Software Features to Look for and Why

Data Insight: Product analytics tools can turn raw event data into actionable insights for smarter decisions.
Essential Features: Prioritize tools offering retention analysis, cohort breakdowns, and real-time reporting to enhance decision-making.
Visualization Advantage: Data visualization simplifies understanding complex datasets, highlighting patterns and aiding stakeholder communication.
Cohort Analysis: Group users by shared traits to understand behaviors over time and improve retention strategies.
Real-Time Data: Instant data access enables quick decision-making, vital for maintaining competitiveness in fast-paced markets.
Product analytics tools track how users interact with your product—what they click, where they drop off, and what keeps them coming back. Done right, they turn raw event data into insights you can actually act on. But the value isn’t in the data itself—it’s in how quickly your team can use it to make smarter product decisions.
That’s why knowing the must-have features matters. You don’t just want dashboards—you want tools that deliver retention analysis, cohort breakdowns, and real-time reporting without bloating your stack. This guide highlights the features that separate nice-to-have analytics from the ones that actually move the needle.
What Are Product Analytics Tools?
Product analytics tools let you track user actions, such as clicks and navigation paths, so you can see what's working and what isn't. They help you identify trends, spot bottlenecks, and understand what features are most popular. This way, you can focus your efforts on what matters most to your users.
These tools help you understand how users interact with your product by collecting and analyzing data. They're great for making decisions based on real user behavior, which can improve your product's design and functionality.
Overall, product analytics tools give your team the insights needed to make informed decisions, ultimately leading to a better product experience for your users.
Top Product Analytics Tools Features
Every product analytics tool promises insights, but the real differentiator is which features it gives you and how well they map to your team’s questions. If you don’t know what to look for, it’s easy to end up with impressive tools that don’t actually move decisions forward.
That’s why it helps to zero in on the core capabilities. Below, we break down the key features that product teams lean on most.
1. Data Visualization
Data visualization tools are all about turning complex datasets into visual formats like charts, graphs, and dashboards. Their main function is to help you and your team quickly grasp insights and trends without wading through raw data. By presenting data visually, these tools make it easier to identify patterns, correlations, and outliers that might not be obvious in spreadsheet form.
When using data visualization in product analytics, you're benefiting in several ways. For product marketers, it offers a clear view of user behavior, campaign effectiveness, and product performance, allowing you to make informed decisions. It's valuable because it simplifies data interpretation, saving you time and helping you communicate findings more effectively to stakeholders.
Look out for sub-features like customizable dashboards, interactive elements that let you drill down into specific data points, and the ability to integrate data from various sources. These features can enhance your team's ability to tailor visualizations to specific needs and make data-driven decisions more confidently. Having strong data visualization capabilities in your product analytics tools is like having a good map—it guides you through the terrain of your product's data landscape.
2. Cohort Analysis
Cohort analysis is the method that makes retention analysis more actionable. Instead of looking at all users in aggregate, it groups them into “cohorts” based on shared traits—like sign-up date, acquisition channel, or feature adoption. This lets you compare how different groups behave over time.
For example, Suren Karapetyan, Principal Product Manager, highlighted how Spotify could use cohorts of daily active users (DAU) streaming songs to evaluate a new “Shuffle” feature. In this example, they discovered usage dropped to just 0.5% of users, down from 1.3% the month before, and confidently decided to remove it to declutter the UI.
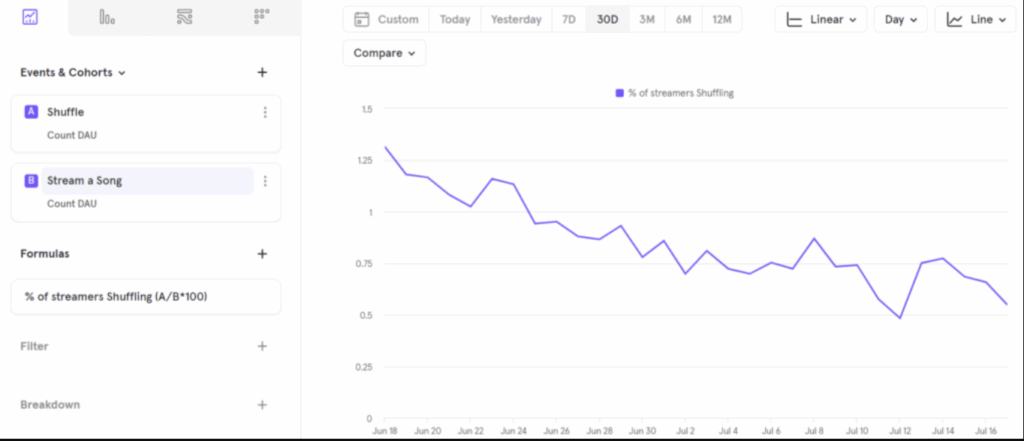
A cohort analysis shows how a prospective feature could lead to churn, and helping the team cull this feature before its release.
Its true that product teams often get sidetracked by shiny tools instead of focusing on the real problem, as Maryam Ashoori, VP of Product & Engineering at IBM Watsonx, noted on The Product Manager Podcast.
I’ve seen people chase solutions versus solve problems. A very good example is someone saying, ‘I want to bring in two AI agents by the end of the year.’ And my response is, to do what exactly? You need a really good understanding of the problem first—otherwise the technology is just a distraction.
That’s exactly why cohort analysis matters. It grounds you in concrete user behavior—retention and churn—so you can measure the real impact of your strategies rather than chasing features for their own sake.
When you're looking at product analytics features, keep an eye out for things like the ability to create custom cohorts, filter by different user actions, and access historical data. These sub-features enhance your ability to glean insights and make informed decisions. Having cohort analysis in your toolkit is invaluable for getting a clear picture of user behavior and making data-driven decisions that can improve your product's success.

3. Funnel Analysis
Funnel analysis builds on event tracking by arranging those raw actions into a sequence of steps that lead toward a conversion (e.g., sign-up → onboarding → purchase). Instead of just looking at isolated events, funnels show you where users drop off along a specific journey.
This structured view makes it easier to pinpoint friction points and optimize the user experience. For example, if many users sign up but abandon onboarding, you know exactly where to focus improvements. Funnel analysis essentially takes the “what happened” from event tracking and turns it into a story about where and why users succeed—or fail—at completing key flows.
Some advanced funnel tools even pair this with heatmaps or session replay, letting you see exactly what users were doing when they got stuck. That kind of context can make the difference between guessing at fixes and confidently prioritizing changes that will boost conversion.
4. User Segmentation
User segmentation is a key feature in product analytics tools that helps you better understand your audience by dividing users into distinct groups based on shared characteristics or behaviors. This function allows you to tailor your marketing strategies and product offerings to meet the specific needs of each segment.
By leveraging user segmentation, you can gain insights into how different user groups interact with your product, which can inform decisions on feature development, marketing campaigns, and customer support.
In product analytics tools, user segmentation works by analyzing user data to identify patterns and trends. You can segment users based on demographics, behavior, engagement, or any other relevant criteria. This segmentation helps you focus your efforts on the most valuable users and identify potential areas for growth.
The benefits for product marketers include a deeper understanding of user needs, improved targeting of marketing efforts, and the ability to personalize user experiences. It's valuable because it empowers you to make data-driven decisions and optimize your product's performance. Look for sub-features like real-time segmentation, predictive analytics, and customizable segmentation criteria to get the most out of your user segmentation efforts.
5. Real-Time Reporting
Real-time reporting in product analytics tools is a game-changer for you and your team. Its main function is to provide immediate insights into user behavior, product performance, and other critical metrics as they happen. This instant access to data allows you to make informed decisions without delay. In product analytics tools, real-time reporting works by continuously collecting data from various sources and updating dashboards or reports instantly.
This feature is beneficial for product marketers because it enables you to quickly identify trends, monitor the success of campaigns, and adjust strategies as needed. Real-time reporting is valuable because it ensures you’re always working with the most current data, which is crucial for staying competitive in fast-paced markets.
Useful Features to Look For in Real-Time Reporting
When evaluating real-time reporting capabilities, you might want to consider:
- Customizable Dashboards – so teams can prioritize the metrics most relevant to them.
- Automated Alerts & Notifications – flagging sudden changes (like a campaign underperforming or traffic spiking unexpectedly).
- Integration Capabilities – ensuring real-time insights can flow into tools your team already uses (CRM, marketing automation, project management).
- Granularity Controls – the ability to zoom in from high-level KPIs down to user-level activity without lag.
6. Retention Analysis
Retention analysis zooms out to answer the big-picture question: Are users sticking around? It measures how many people continue to engage with your product days, weeks, or months after their first interaction. Strong retention is usually the clearest sign of product-market fit, while weak retention signals churn risk.
For product marketers, retention analysis is critical because it reveals which features and campaigns actually drive long-term engagement—not just short-term spikes. It also helps you benchmark success, prioritize improvements, and ensure growth isn’t just about acquisition but about keeping the users you win.
As Matthew Wensing, Head of Product & Design at Customer.io, shared on The Product Manager Podcast:
What we like to do is put our opinions out there and test just to find validation. But real experiments should make you uncomfortable—because they might prove you wrong, and that’s better for the business.
Retention analysis is exactly that uncomfortable but valuable experiment. It doesn’t just show you where the growth curve looks pretty—it shows whether users truly find enduring value in your product.
7. Custom Dashboards
Custom dashboards in product analytics tools let you and your team tailor the display of data to fit your unique needs. Their main function is to provide a personalized view of the metrics and insights that matter most to your product's performance. By allowing you to choose specific data points and visualize them in a way that makes sense for your business, custom dashboards help streamline decision-making and enhance your understanding of user behavior.
With custom dashboards, you can easily track key performance indicators (KPIs) and compare trends over time without sifting through irrelevant data. This is particularly beneficial for product marketers who need quick access to actionable insights to drive marketing strategies and product improvements.
Having custom dashboards in your product analytics tools is valuable because it saves time and ensures that your team focuses on what's important. Look for sub-features like drag-and-drop interface, real-time data updates, and integration with other tools you use. These functionalities not only make the dashboards more user-friendly but also ensure that the information is always up-to-date and relevant to your goals.
8. Event Tracking
Event tracking is the foundation of product analytics. It captures the raw, granular actions users take in your product—such as clicks, form submissions, or navigation paths. These individual “events” let you see what features get used, where friction occurs, and how users interact with key elements.
The strength of event tracking lies in its flexibility. You can customize events to match your product’s unique flows and then analyze them in countless ways. For product teams, this provides the building blocks for deeper analysis—everything from engagement reports to user journey mapping.
Event tracking ensures you’re solving the real problem by grounding you in user behavior instead of assumptions. With it, you can validate what’s actually happening in your product before layering on more complex analysis.
9. A/B Testing Integration
A/B testing integration in product analytics tools is all about making informed decisions by comparing different versions of your product. This integration allows you and your team to efficiently track and analyze user behavior, leading to enhanced product features and improved user experiences. By testing variations, such as in-app messages or onboarding flows, you gather valuable insights into what resonates best with your users. This is particularly useful for optimizing user engagement and retention rates.
Having A/B testing as part of your product analytics toolkit means you can experiment with different approaches, like fake door tests or multivariate tests, to see what truly works. It's not just about running the tests but also about understanding the results to make data-driven decisions. Look for tools that offer user segmentation and qualitative insights, as these can provide deeper context to the quantitative data. Ultimately, integrating A/B testing into your analytics process empowers you to continuously refine your product, making sure it meets the needs of your users and aligns with your business goals.
10. Behavioral Analytics
Behavioral analytics is a crucial aspect of product analytics tools, designed to help you and your team understand how users interact with your products. By tracking and analyzing user behavior, these tools provide insights into customer journeys, enabling you to identify friction points and opportunities for improvement. This understanding is vital for enhancing user experiences and driving growth in your digital business.
Key functions of behavioral analytics include session replay, funnel analysis, and struggle/error analysis. These features allow for a deeper dive into user behavior, helping you make data-driven decisions about product performance. You can also utilize tools like A/B testing to compare different elements, or audience segmentation to tailor your marketing efforts based on user characteristics.
For product marketers, behavioral analytics offers the ability to enhance customer understanding, improve engagement, and optimize marketing strategies. The value of incorporating behavioral analytics into your product analytics lies in its ability to provide actionable insights that lead to better decision-making and improved user experiences.
When choosing a tool, consider features like user interaction analysis, journey mapping, and continuous measurement to ensure that your product optimizations are effective and align with your goals.
How to Choose a Product Analytics Tool
When you're shopping for a product analytics tool, it's easy to get swept up in analysis paralysis. Does it have the right features? The right integrations? Can you customize it? Is it user-friendly?
Understanding different types of product management software can help streamline your selection process.
Breathe. You've got this. Use this handy pre-purchase checklist for your evaluation and selection process to find the perfect product analytics tool for your needs.
Product Analytics Tools Buyer's Checklist
| Criteria | How to Evaluate |
| Scalability | Can the tool grow with your business needs? |
| Integrations | Does it integrate with your existing systems? |
| Value for Money | Are the features worth the cost? |
| Customizability | Can you tailor the tool to your specific needs? |
| Industry-Specific Features | Does it have features unique to your industry? |
| Ease of Use | Is the tool intuitive for your team to use? |
| Security Safeguards | Does it meet your security requirements? |
| Real-Time Reporting | Does it provide real-time insights? |
| Support and Training | Is there adequate customer support and training? |
| Data Visualization | Does it offer clear and insightful visualizations? |
Top 10 Product Analytics Tools
Here are our top picks of the best product analytics tools to help you in your search:


Choosing the Right Product Analytics Platform
When you're selecting a product analytics tool, it's all about finding the right fit for your needs without overcomplicating things. Here are some key considerations that can guide your decision.
- Ease of Implementation: You want a platform that’s easy to get up and running. Non-technical staff should be able to configure dashboards, run reports, and explore data without needing constant engineering support. Look for a straightforward setup process and intuitive interfaces.
- Integration Capabilities: Check whether the platform integrates well with your existing tools—CRM, data warehouses, customer success platforms, and marketing systems. The less time and technical overhead spent on integration, the faster you can unlock insights.
- Customization and Flexibility: Your analytics tool should let you segment users, define custom events, and tailor reporting to your unique product journey. Flexibility here ensures you can surface the insights that matter most to your business.
- Scalability: As your user base and data volume grow, your analytics platform should scale with you. Whether you’re a startup looking for a free product analytics tool or a large enterprise looking for something that scales as your organization grows, the system should handle features like increasing event tracking and reporting needs without slowing down.
- Analytics Depth: A strong product analytics tool should go beyond surface-level metrics. Look for features like funnel analysis, retention tracking, cohort analysis, A/B testing support, and predictive insights. These capabilities help you understand not just what users are doing, but why.
Customer Support Quality
Finally, consider the level of support the vendor provides. Responsive customer service and accessible resources (documentation, training, community forums) are crucial for ongoing success.
Remember, it's always a good idea to try out the software before you commit. Compare different tools to see which one offers the best value for your specific needs.
Want More Content About Product Analytics Platforms?
Don't forget to subscribe to our newsletter for more product management resources and guides, plus the latest podcasts, interviews, and other insights from industry leaders and experts.
