

Hiç site analizlerinize bakıp “Tamam, trafik artıyor—ama neden daha fazla kişi dönüşüm gerçekleştirmiyor?” diye düşündünüz mü? Isı haritaları tam da burada devreye girer. Pasif sayıları aktif içgörülere dönüştürerek kullanıcıların tam olarak nerelere tıkladığını, nerelere kaydırdığını ve nerelerde sayfadan ayrıldığını gösterir; böylece sorun yaratan noktaları hızla tespit edebilirsiniz.
Ancak her ısı haritası aracı herkes için uygun değildir. Bazıları sizi ham veriye boğar ama bunun ne anlama geldiğini anlamanızı bekler. Diğerleri kullanıcı tıklamalarını öne çıkarır ancak bağlamı gözden kaçırır; örneğin hangi içeriğin yok sayıldığı veya kullanıcıların nerelerde tereddüt ettiği gibi. Doğru aracı seçmek için görsellerden daha fazlasına ihtiyacınız vardır. Etkileşim ve dönüşüm hedefleriyle doğrudan bağlantılı netlik, odak ve uygulanabilir içgörülere ihtiyaç duyarsınız.
Günümüzde önde gelen ısı haritası platformlarını kullanılabilirlik, içgörü derinliği ve UX ekipleri ile pazarlamacılar açısından gerçek dünyadaki yatırım getirisi bakımından test edip karşılaştırdım. Bu rehberde en iyi seçenekleri, aralarındaki farkları ve yalnızca gözlemlemekle kalmayıp gerçekten optimizasyon yapmanıza yardımcı olanları açıklayacağım.
Why Trust Our Software Recommendations
6,700+
Reviews
20
Industry experts
16+
Evaluation factors
14
Years
Our team has been testing and reviewing software since 2012. As product managers ourselves, we know how difficult—and important—it is to choose the right software.
For this guide, we evaluated tools using hands-on testing and independent research, scoring tools using our selection criteria.
Our reviews reflect our human editorial judgment, not a sales pitch.
Expert reviewers:
- Andrew LumbySenior TPM
- Cristiano ValimSenior UI/UX Lead


Isı Haritası Yazılımları Karşılaştırma Tablosu
Bu karşılaştırma tablosu, en iyi ısı haritası yazılımı seçimlerim için fiyatlandırma ayrıntılarını özetlemektedir:
Score legend (out of 5)
- Excellent4.5–5
- Good4–4.4
- Average3–3.9
- Below average2–2.9
- Poor1–1.9
Sorted by: Default
| Tool | Starting Price | Website | |||||||
|---|---|---|---|---|---|---|---|---|---|
Best for revenue-impact scoring on interaction data | 4.3 out of 5 | 4 | 3 | 5 | 4 | 5 | 5 | Pricing upon request Free demo available | Website |
Best for linking click behavior to session replay | 3.8 out of 5 | 3 | 4 | 4 | 4 | 5 | 3 | Pricing upon request Free plan available | Website |
Best for heatmaps linked to session replay | 3.7 out of 5 | 3 | 3 | 4 | 3 | 5 | 4 | $65/month 14-day free trial available | Website |
Best for simple heatmaps and A/B tests | 4.2 out of 5 | 4 | 3 | 4 | 5 | 5 | 4 | $29/month 30-day free trial available | Website |
Best for heatmaps tied to built-in A/B test variants | 4.5 out of 5 | 3 | 4 | 5 | 5 | 5 | 5 | Pricing upon request 30-day free trial + free demo available | Website |
Best for seven auto-generated heatmap types | 4.3 out of 5 | 3 | 4 | 4 | 5 | 5 | 5 | $25/month Free plan available | Website |
Best for website analytics with real-time heatmaps | 3.8 out of 5 | 3 | 3 | 4 | 4 | 5 | 4 | $32/month 7-day free trial + free plan available | Website |
Best for heatmaps with rage click and form analytics | 4.0 out of 5 | 3 | 4 | 4 | 5 | 4 | 4 | $49/month Free plan + 15-day free trial + free demo available | Website |
Best for heatmaps tied to event segmentation | 3.7 out of 5 | 2 | 4 | 4 | 4 | 5 | 3 | Pricing upon request Free plan + free demo available | Website |
Best for free, no-cap behavioral analytics | 3.8 out of 5 | 4 | 4 | 4 | 4 | 4 | 3 | Pricing upon request Free plan available | Website |


En İyi Isı Haritası Yazılımı İncelemeleri
Her aracın diğer ısı haritası yazılımlarından nasıl ayrıldığını anlamak için aşağıdaki basit özetleri kullanabilirsiniz.
 Best for revenue-impact scoring on interaction data
- Free demo available
- Pricing upon request
Visit WebsiteCustomer Rating:4.7/5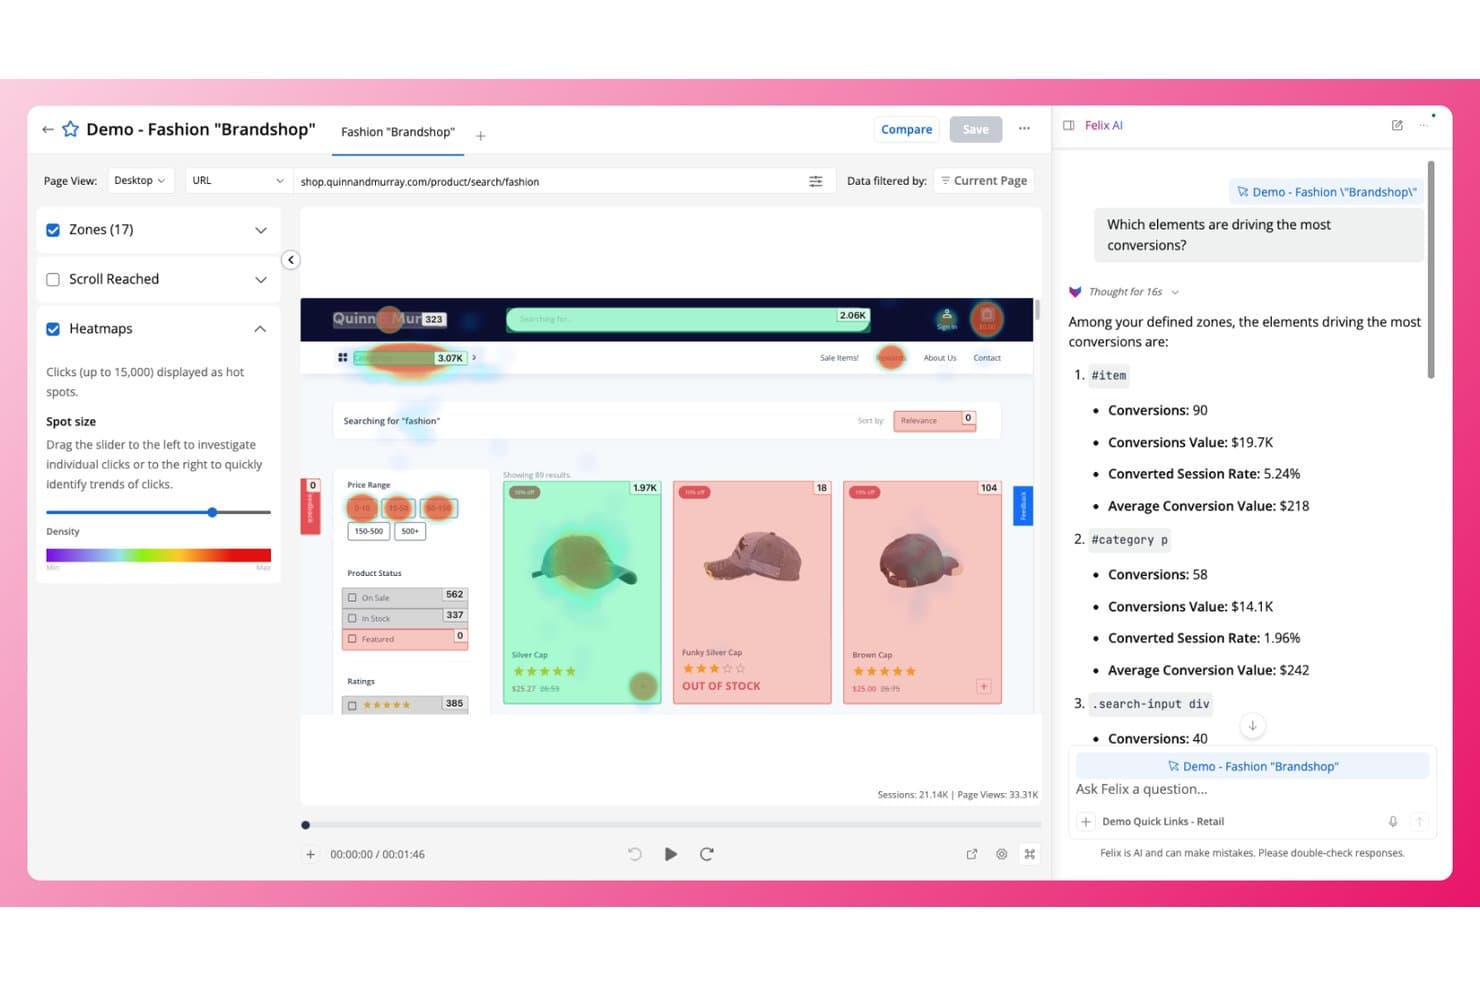
Quantum Metric overlays click heatmaps on pages to reveal top conversion drivers. Quantum Metric is a digital experience analytics platform that combines click, scroll, and attention heatmaps with session replay, AI-generated insight summaries, and revenue-impact scoring across web and native mobile.
Who Is Quantum Metric Best For?
Quantum Metric is a strong fit for enterprise product and digital experience teams that need to connect interaction data directly to revenue outcomes.
Why I Picked Quantum Metric
Quantum Metric earns its spot on my shortlist because it's the only heatmap platform I've seen that puts a dollar figure on interaction data through its Opportunity Analysis feature. I like that when I spot a rage-click cluster in a heatmap, I can calculate the revenue impact of that friction in one click, which makes prioritization straightforward. Copilot for Interactions then reads the zone metrics directly in the heatmap view and tells me which elements to fix, promote, or test.
Quantum Metric Key Features
- Felix AI summarization: Summarizes individual sessions or cross-device user journeys in plain language using Google Gemini Pro, with follow-up questioning built in.
- Segment Builder: Lets you filter heatmap data using nested and sequential logic across 300+ captured metrics, device types, and user attributes.
- Native mobile heatmaps: Captures tap maps, interaction maps, and scroll data from native iOS and Android apps with near web-feature parity.
- Visible browser extension: Overlays click, scroll, attention, and element-level conversion data directly on your live site in Chrome or Firefox.
Quantum Metric Integrations
Quantum Metric documents integrations with Optimizely, AB Tasty, Qualtrics, Google BigQuery, Adobe Analytics, Slack, ServiceNow, Salesforce Service Cloud, Looker, and Tealium. Its Felix Summarization REST API and Data Streaming add-on support custom data workflows.
Pros and Cons
Pros:
- Native mobile heatmaps approach web parity
- Heatmaps connect directly to session replays
- Revenue impact quantifies friction for prioritization
Cons:
- Mobile tracking can reduce frame rates
- Segment builder navigation frustrates some reviewers
Learn more about Quantum Metric: Best for linking click behavior to session replay
- Free plan available
- Pricing upon request
Visit WebsiteCustomer Rating:4.5/5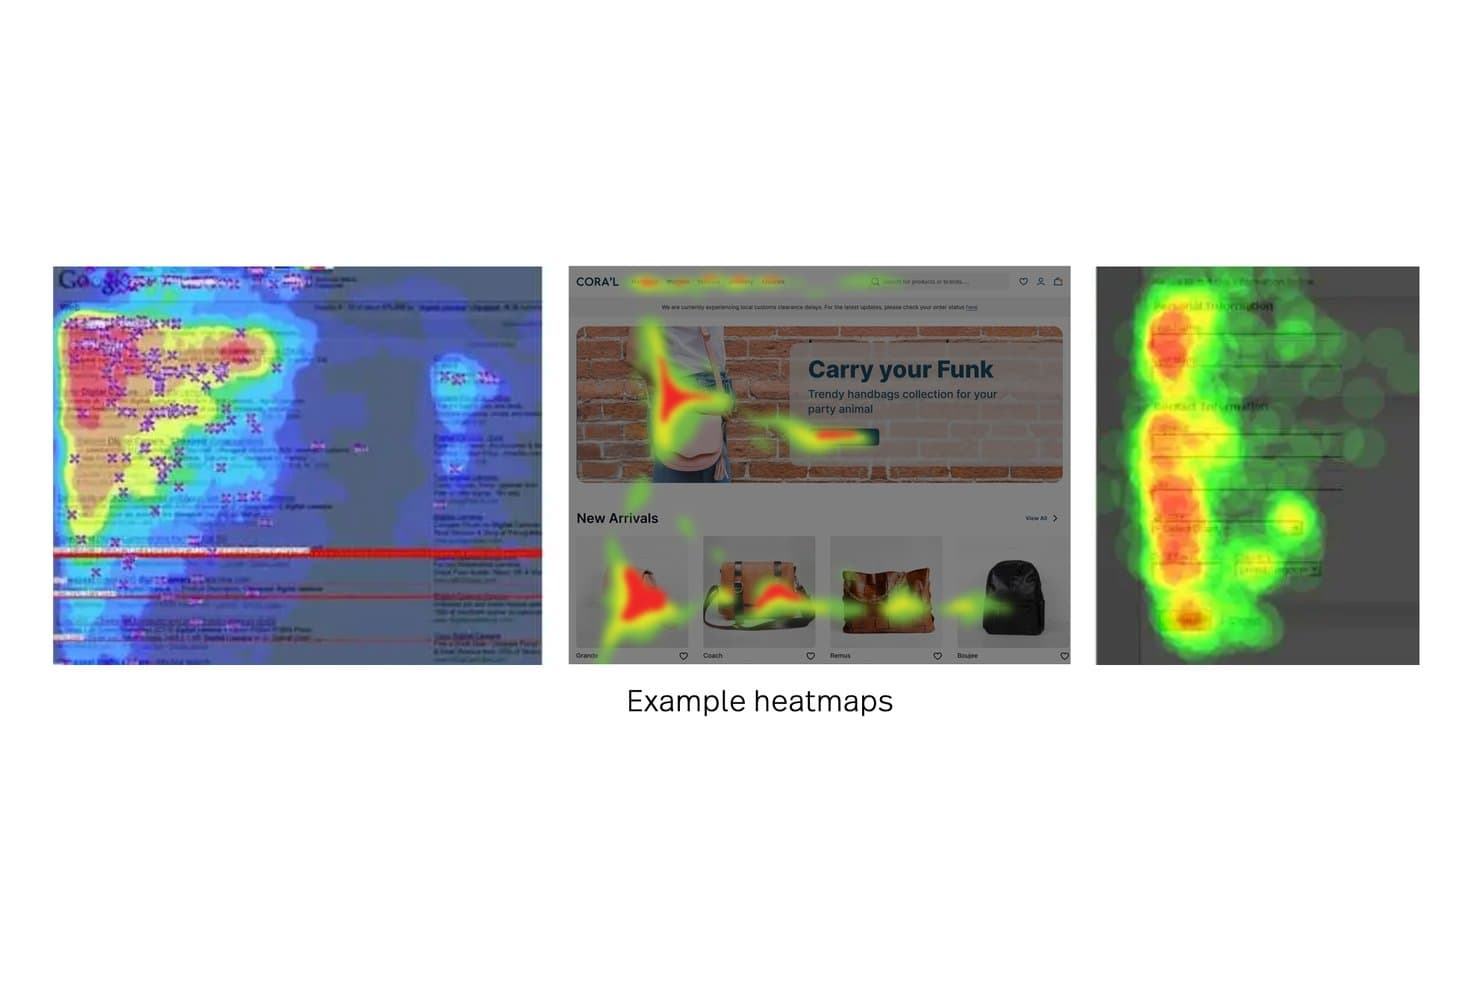
Fullstory displays heatmaps showing user attention across web pages. Fullstory is a behavioral analytics and session replay platform that captures click maps, scroll maps, and conversion maps alongside automatic frustration signal detection like rage clicks, dead clicks, and error clicks.
Who Is Fullstory Best For?
Fullstory is a strong fit for product and UX teams that need to connect click behavior directly to session replay to understand the "why" behind user friction.
Why I Picked Fullstory
Fullstory earns its spot on my shortlist because it closes the gap between seeing where users click and understanding why they clicked there. I love that you can jump directly from any heatmap element to the exact sessions behind it, so a spike in rage clicks on a checkout button isn't just a data point—it's a queue of real recordings to watch. Page Insights takes this further by overlaying click and scroll maps inside session replay, so context is never lost.
Fullstory Key Features
- Frustration signal detection: Fullstory automatically flags rage clicks, dead clicks, error clicks, and thrashed cursor behavior across your sessions.
- Conversion Maps: This map type calculates the conversion rate from named page elements to a defined goal, like a checkout-success URL or revenue event.
- StoryAI session summaries: An AI layer that generates plain-language summaries of individual sessions, so you can understand what happened without watching every replay.
- Tagless autocapture: Fullstory's Fullcapture™ system records clicks and interactions automatically, with no manual event tagging required.
Fullstory Integrations
Fullstory offers native integrations with Google Analytics, Google Tag Manager, BigQuery, Segment, Optimizely, VWO, Slack, Jira, and Shopify. It also supports Zapier, webhooks, and APIs for custom integrations.
Pros and Cons
Pros:
- Connects conversion maps to revenue outcomes
- Detects rage, dead, and error clicks
- Links heatmap elements to session replays
Cons:
- Mobile app heatmaps omit scroll maps
- No dedicated hover movement heatmap
Learn more about Fullstory: Best for heatmaps linked to session replay
- 14-day free trial available
- Plans start at $65/month
Visit WebsiteCustomer Rating:4.6/5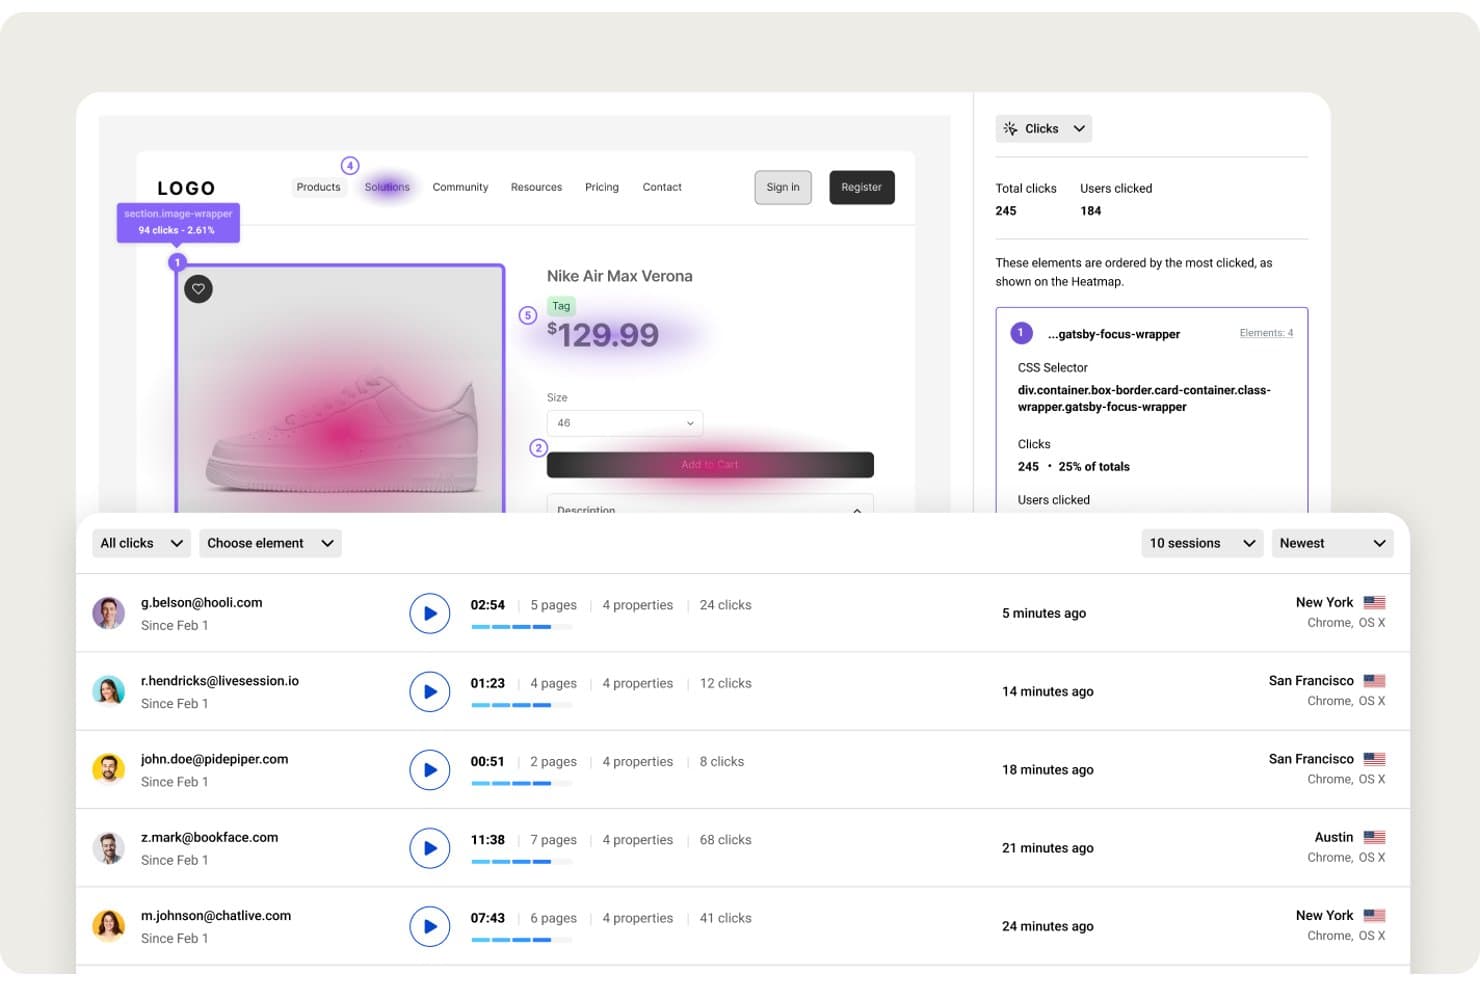
LiveSession visualizes click heatmaps with session data side by side. LiveSession is a behavioral analytics platform that combines heatmaps, session replay, funnels, and custom metrics in a single interface.
Who Is LiveSession Best For?
LiveSession suits product teams and UX designers who want to move directly from a heatmap to the session replay behind it, without switching tools.
Why I Picked LiveSession
LiveSession earns its spot on my shortlist because the link between its heatmaps and session replay is genuinely tight in a way most tools don't match. From a clickmap, I can pull up every session where a user clicked that element and turn them into a segment instantly. I also get rage click and error click detection baked into the same view, so I'm not just seeing where users click but also where they're getting stuck.
LiveSession Key Features
- Scroll map analysis: Visualize the exact depth users reach on any page, with separate views for desktop and mobile, plus "effective fold" markers to see how much content gets seen.
- Saved segments: Build reusable filter groups based on behavior, device, geography, or custom properties, then apply those segments across heatmaps, funnels, and metrics in one click.
- Custom events tracking: Use
ls.track()to log specific user actions beyond automatic captures, then filter sessions and heatmaps by those events to analyze targeted interactions. - Inspect Mode: Select any CSS element on your site without writing code to instantly surface all sessions where users interacted with that specific element.
LiveSession Integrations
LiveSession offers native integrations with Google Analytics, Segment, Mixpanel, Heap, Shopify, Google Tag Manager, and Survicate. It also supports Slack, webhooks, Zapier, and a REST API on Pro and above for custom integrations.
Pros and Cons
Pros:
- Saved segments work across behavioral views
- Rage and error clicks reveal friction
- Heatmap clicks open matching session replays
Cons:
- No side-by-side heatmap comparisons available
- Heatmap rendering can miss page elements
Learn more about LiveSession: Best for simple heatmaps and A/B tests
- 30-day free trial available
- From $29/month
Visit WebsiteCustomer Rating:4.3/5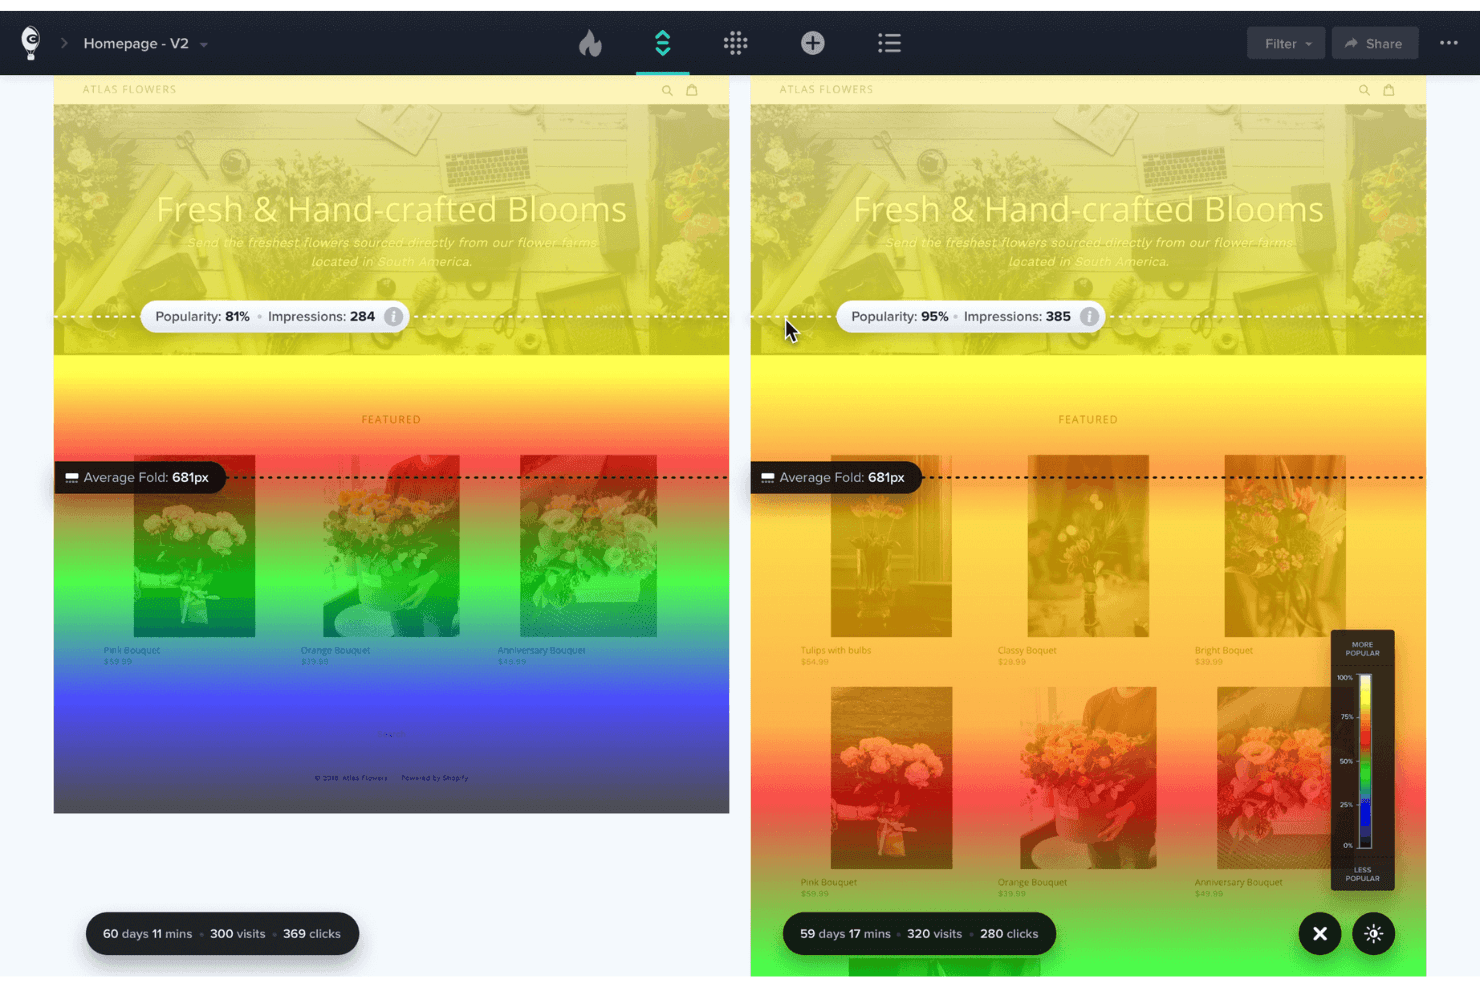
Crazy Egg shows where visitors click and scroll on your site. Crazy Egg is a heatmap and website optimization platform that combines click maps, scroll maps, confetti maps, session recordings, A/B testing, surveys, and funnels in a single tool.
Who Is Crazy Egg Best For?
Crazy Egg is a great fit for product managers and marketers at small to mid-sized teams who want heatmaps, A/B testing, and session recordings without juggling multiple tools.
Why I Picked Crazy Egg
Crazy Egg earns its spot on my shortlist because it keeps heatmaps genuinely simple without stripping out the tools you actually need to act on what you find. I like how its five map types, including the Confetti Map that breaks clicks down by traffic source, UTM, or device, let me pinpoint exactly which audience segment is struggling with a layout. What ties it together is the native A/B testing: I can spot a dead-click problem in the Page Performance report and launch a variant to fix it without switching tools.
Crazy Egg Key Features
- Confetti Map: Breaks down individual clicks by traffic source, UTM, device, OS, and 17 other attributes in a single view.
- Session recording auto-tags: Automatically flags recordings with rage clicks, dead clicks, JavaScript errors, abandoned forms, and slow load times.
- AI-powered Tasks report: A chat-driven tool that builds prioritized PDF reports and drafts A/B test variants based on your heatmap and recording data.
- Funnel tracking: Retroactive, cross-session funnels that show where visitors drop off, filterable by conversion goal.
Crazy Egg Integrations
Crazy Egg supports integrations with Google Analytics 4, Google Tag Manager, Shopify, WordPress, Wix, Squarespace, Drupal, Joomla, Magento, and Segment. It also offers a heatmap automation API and Zapier connectivity.
Pros and Cons
Pros:
- Users praise quick setup and support
- Rage-click detection surfaces frustrated sessions
- Native A/B tests validate heatmap findings
Cons:
- Form insights stop at submissions
- No dedicated hover heatmap
Learn more about Crazy Egg: 5Best for heatmaps tied to built-in A/B test variants
VWO
- 30-day free trial + free demo available
- Pricing upon request
Visit WebsiteCustomer Rating:4.3/5
VWO lets users generate heatmaps from click data across multiple pages. VWO is a behavior analytics platform that combines heatmaps, session recordings, form analytics, and A/B testing in one toolset, with eight visualization types including clickmaps, scrollmaps, hovermaps, and a Frictionmap for rage and dead click detection.
Who Is VWO Best For?
VWO is a strong fit for conversion rate optimization teams that run A/B tests and want heatmap data tied directly to each test variation.
Why I Picked VWO
I picked VWO as one of the best because it's the only tool on my list that ties heatmaps directly to A/B test variations, so you can see exactly how visitors interact with each version of a page. The per-variation heatmap filter lets you compare click and scroll behavior across up to three campaigns at once. I also like that selecting a friction or click cluster pulls up matching session recordings instantly, with Wingz AI summarizing what those visitors experienced.
VWO Key Features
- Frictionmap: Detects rage clicks, dead clicks, and error clicks on any page, then surfaces matching session recordings directly from the map.
- Element list: Shows click counts and percentages for every page element, including hidden ones like dropdown contents.
- Form analytics: Tracks field-level behavior, including which fields take longest to complete, get refilled, or cause visitors to abandon the form.
- Wingz AI hypotheses: Converts heatmap insights into ranked, actionable test hypotheses you can push directly into VWO's experimentation workflow.
VWO Integrations
VWO offers native integrations with GA4, Adobe Analytics, Amplitude, Mixpanel, FullStory, Microsoft Clarity, HubSpot, Salesforce, Shopify, BigQuery, Snowflake, and Jira. Enterprise plans include a REST API for custom integrations.
Pros and Cons
Pros:
- Offers eight visualization types and segmentation
- Links friction clusters to session recordings
- Ties heatmaps directly to A/B variations
Cons:
- Hovermaps work only on desktop устройств
- Sampling limits can hide lower-volume behavior
Learn more about VWO: Best for seven auto-generated heatmap types
- Free plan available
- From $25/month
Visit WebsiteCustomer Rating:4.7/5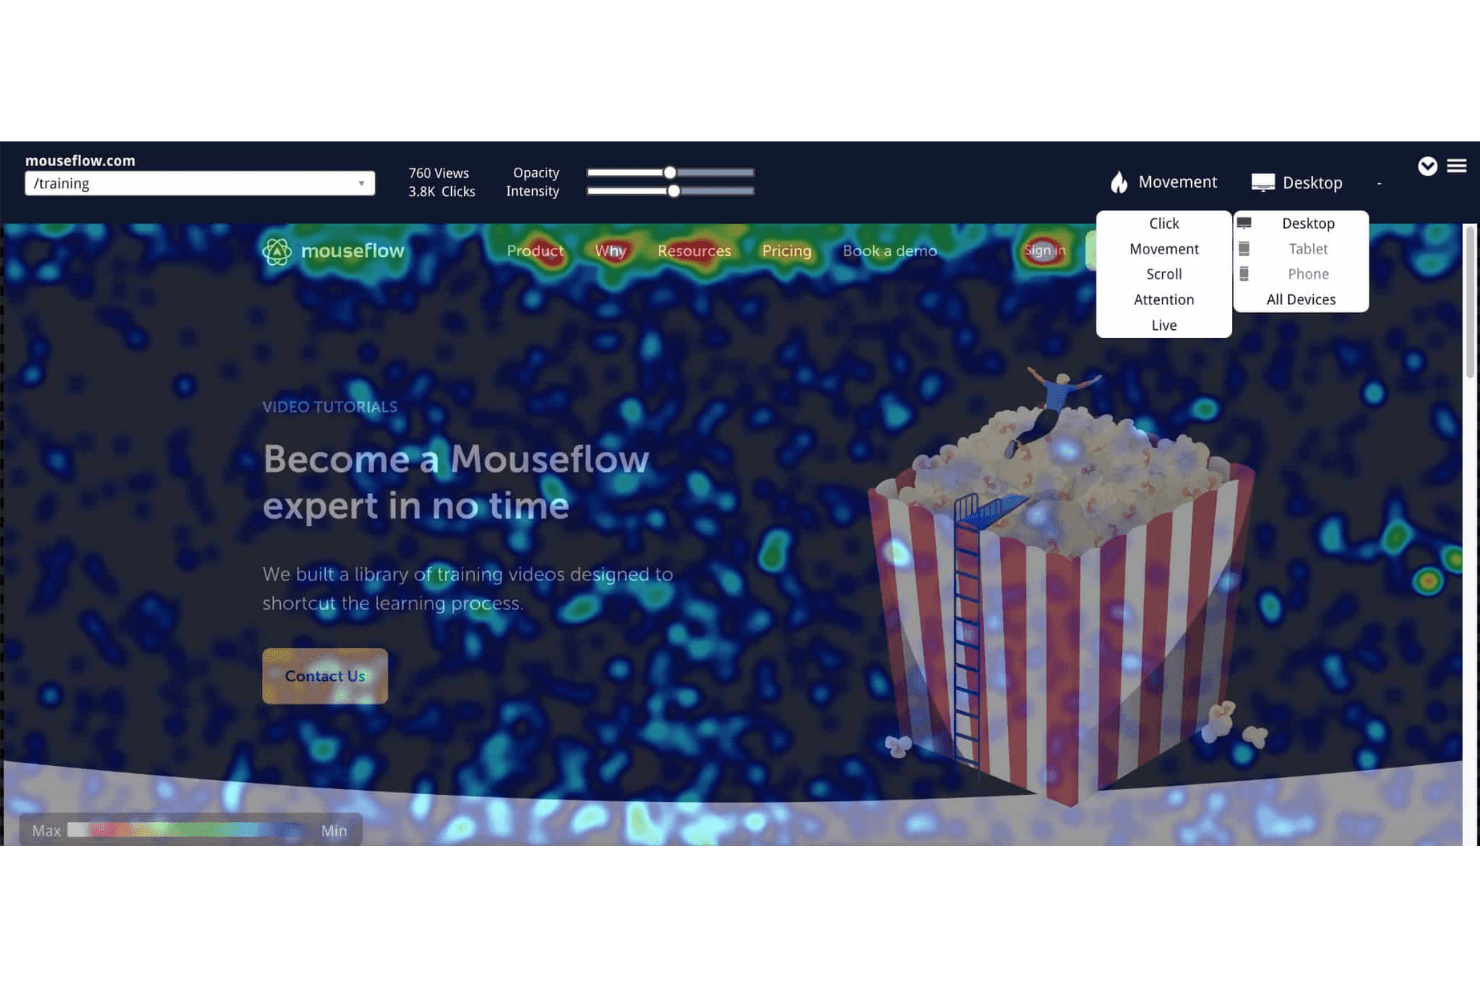
Mouseflow's heatmaps include options for analyzing click, movement, scroll, attention, and live user data. Mouseflow is a session analytics and heatmap platform that automatically generates seven types of heatmaps—including click, scroll, movement, attention, geo, friction, and interactive—alongside session replay, form analytics, funnel tracking, and feedback surveys.
Who Is Mouseflow Best For?
Mouseflow is a strong fit for product managers and CRO teams who need visual behavior data across the full user journey, not just isolated page snapshots.
Why I Picked Mouseflow
I picked Mouseflow as one of the best because no other tool automatically generates seven heatmap types the moment you install it. Click, scroll, movement, attention, geo, friction, and interactive heatmaps all appear without any per-page configuration. I especially like the Friction Map, which surfaces rage clicks, dead clicks, and JavaScript errors as a dedicated overlay, so I can spot exactly which elements are frustrating users rather than guessing from click data alone.
Mouseflow Key Features
- Friction Score: Mouseflow assigns each session a numeric Friction Score based on detected rage clicks, dead clicks, JavaScript errors, 404s, and bounces, so you can prioritize which sessions to review first.
- Form analytics: Field-level data shows where users hesitate, which fields they skip, and where they abandon forms—without any additional coding required.
- Side-by-side heatmap comparison: A built-in comparison view lets you place two heatmaps side by side with independent filters for date range, device, segment, and heatmap type.
- Mina AI: An AI assistant included on all paid plans that answers plain-language questions about your session, heatmap, funnel, and friction data.
Mouseflow Integrations
Mouseflow lists 42 integrations, including GA4, Adobe Analytics, Google Ads, Google Tag Manager, Shopify, WordPress, HubSpot, Twilio Segment, Slack, and Microsoft Teams. Its open REST API supports custom integrations.
Pros and Cons
Pros:
- Replay links explain each hotspot
- Friction maps expose rage and dead clicks
- Seven heatmaps generate automatically
Cons:
- Web-only capture misses native app behavior
- Tracking stops after monthly session caps
Learn more about Mouseflow: Best for website analytics with real-time heatmaps
- 7-day free trial + free plan available
- From $32/month (billed annually)
Visit WebsiteCustomer Rating:4.7/5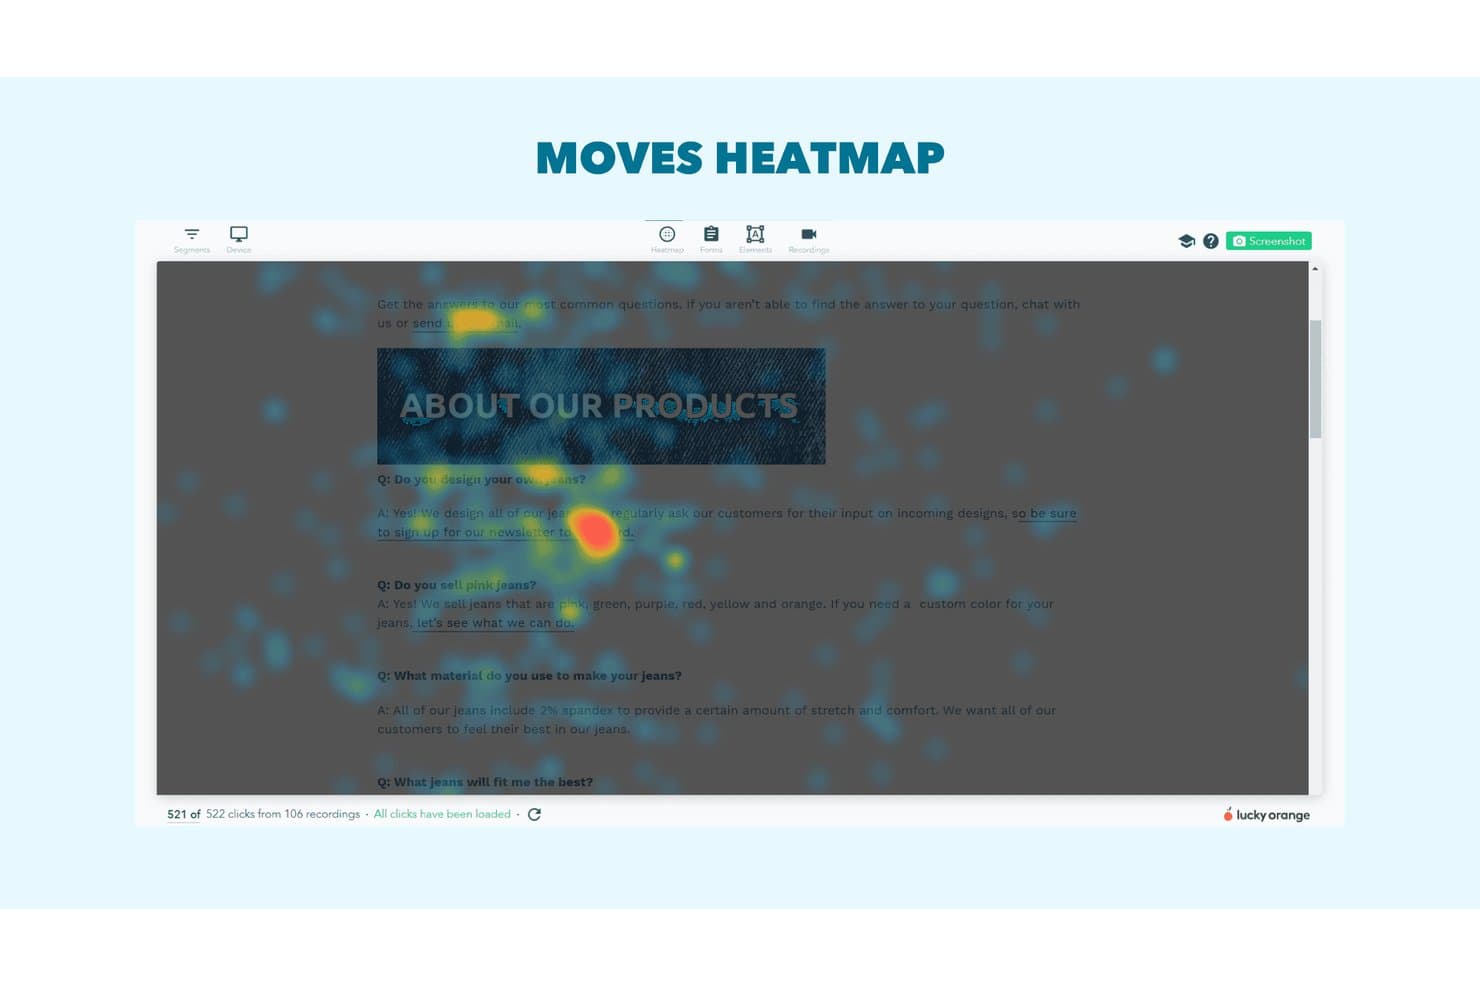
Lucky Orange's moves heatmap shows where users hover on FAQ pages. Lucky Orange is a website analytics and heatmap tool that combines dynamic click, scroll, and move heatmaps with session recordings, form analytics, conversion funnels, and an AI assistant built on live visitor data.
Who Is Lucky Orange Best For?
Lucky Orange is a strong fit for product managers, UX designers, and conversion rate optimizers who want heatmaps, session recordings, and form analytics in one place without juggling multiple tools.
Why I Picked Lucky Orange
Lucky Orange earns its spot on my shortlist because real-time heatmaps are genuinely central to how it works, not an afterthought. I love that Dynamic Heatmaps capture clicks inside pop-ups, modals, and carousels as they happen, so you're seeing actual interaction data rather than a static snapshot of the page underneath. The U-Turn event detection (which flags visitors who leave and return within 10 seconds) and tightened rage-click tracking give me frustration signals I can act on immediately, linked directly to session recordings.
Lucky Orange Key Features
- Form analytics: Tracks drop-off rates, time spent, and device breakdown for each individual form field, with direct links to session recordings of visitors who abandoned the form.
- Discovery AI: A conversational AI assistant connected to live visitor data that runs audits, answers behavioral questions, and links responses back to supporting heatmaps, funnels, or recordings.
- Conversion funnels: Maps visitor drop-off across multi-step flows so you can pinpoint exactly where users exit before completing a goal.
- On-site surveys: Deploys unlimited behavior-triggered and exit-intent surveys to collect direct visitor feedback, with responses linked to individual session recordings.
Lucky Orange Integrations
Lucky Orange has documented integrations with Shopify, BigCommerce, Magento, HubSpot, Google Analytics 4, ClickFunnels, Unbounce, Webflow, Google Tag Manager, and Optimizely. It also supports Zapier and offers an API for custom integrations.
Pros and Cons
Pros:
- Frustration signals reveal UX problems
- Recordings connect directly with heatmaps
- Dynamic heatmaps capture pop-up interactions
Cons:
- Recordings sometimes lag or fail to load
- Session quotas limit high-traffic analysis
Learn more about Lucky Orange: Best for heatmaps with rage click and form analytics
- Free plan + 15-day free trial + free demo available
- From $49/month
Visit WebsiteCustomer Rating:4.5/5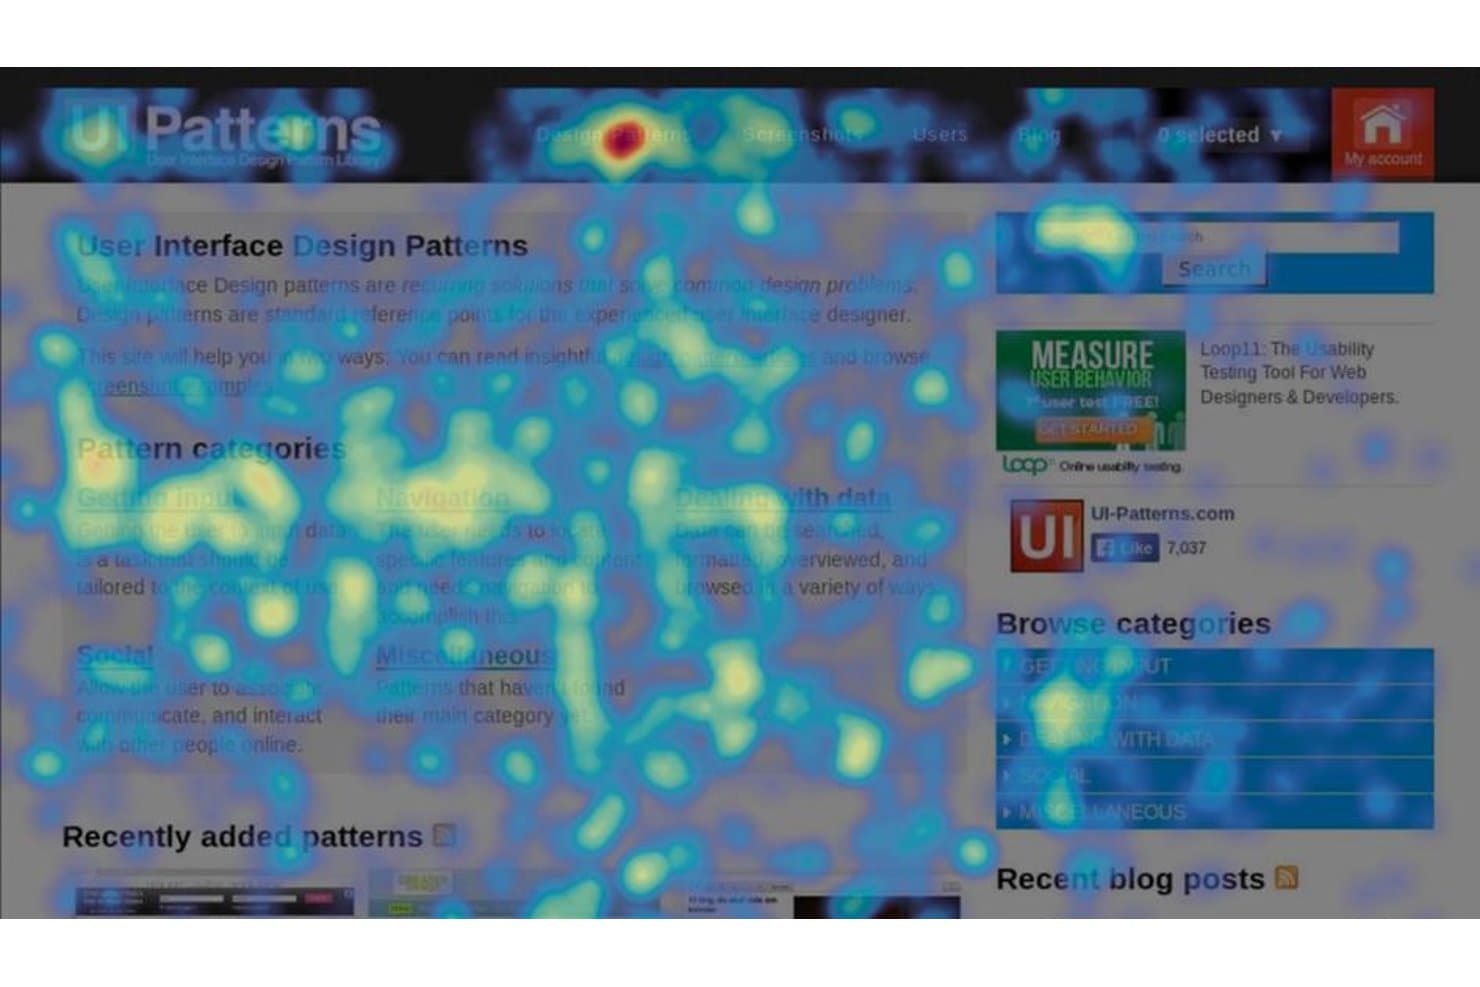
Hotjar (by Contentsquare) visualizes user clicks and attention via heatmaps. Hotjar (by Contentsquare) is a heatmap and behavior analytics platform that combines click, scroll, move, rage click, and engagement zone maps with session replay, form analytics, and feedback surveys.
Who Is Hotjar (by Contentsquare) Best For?
Hotjar is a strong fit for product managers and UX designers who need to diagnose friction at the element level—especially through rage click detection and form field drop-off analysis.
Why I Picked Hotjar (by Contentsquare)
Hotjar earns its spot on my shortlist because rage click detection and form analytics are baked directly into its heatmap workflow, not siloed into separate reports. I particularly like how rage click maps surface elements users are furiously clicking on, while Form Analysis breaks down drop, blank, and refill rates field by field. That combination tells you exactly where a form is bleeding conversions without needing to dig through session replays one by one.
Hotjar (by Contentsquare) Key Features
- Engagement zone maps: A combined heatmap that layers click, move, and scroll data into a single view for each page element.
- Session replay with one-click access: Jump directly from a heatmap to matching session replays without leaving your current workflow.
- Funnel analysis: Track visitor drop-off across up to 10 steps to pinpoint where users exit before converting.
- Feedback surveys and NPS widgets: Deploy on-page surveys and Net Promoter Score prompts that tie responses directly to session replays.
Hotjar (by Contentsquare) Integrations
Hotjar (by Contentsquare) offers 115+ integrations, including Google Analytics, Adobe Analytics, Jira, Slack, HubSpot, Optimizely, Segment, and Mixpanel. Paid Voice of Customer plans include an API and exports, plus Zapier.
Pros and Cons
Pros:
- Heatmaps link directly to session replays
- Form analytics pinpoint field-level conversion leaks
- Rage click maps expose frustrated interactions
Cons:
- Lower tiers sample session replays extensively
- Move maps work only on desktop
Learn more about Hotjar (by Contentsquare): Best for heatmaps tied to event segmentation
- Free plan + free demo available
- Pricing upon request
Visit WebsiteCustomer Rating:4.5/5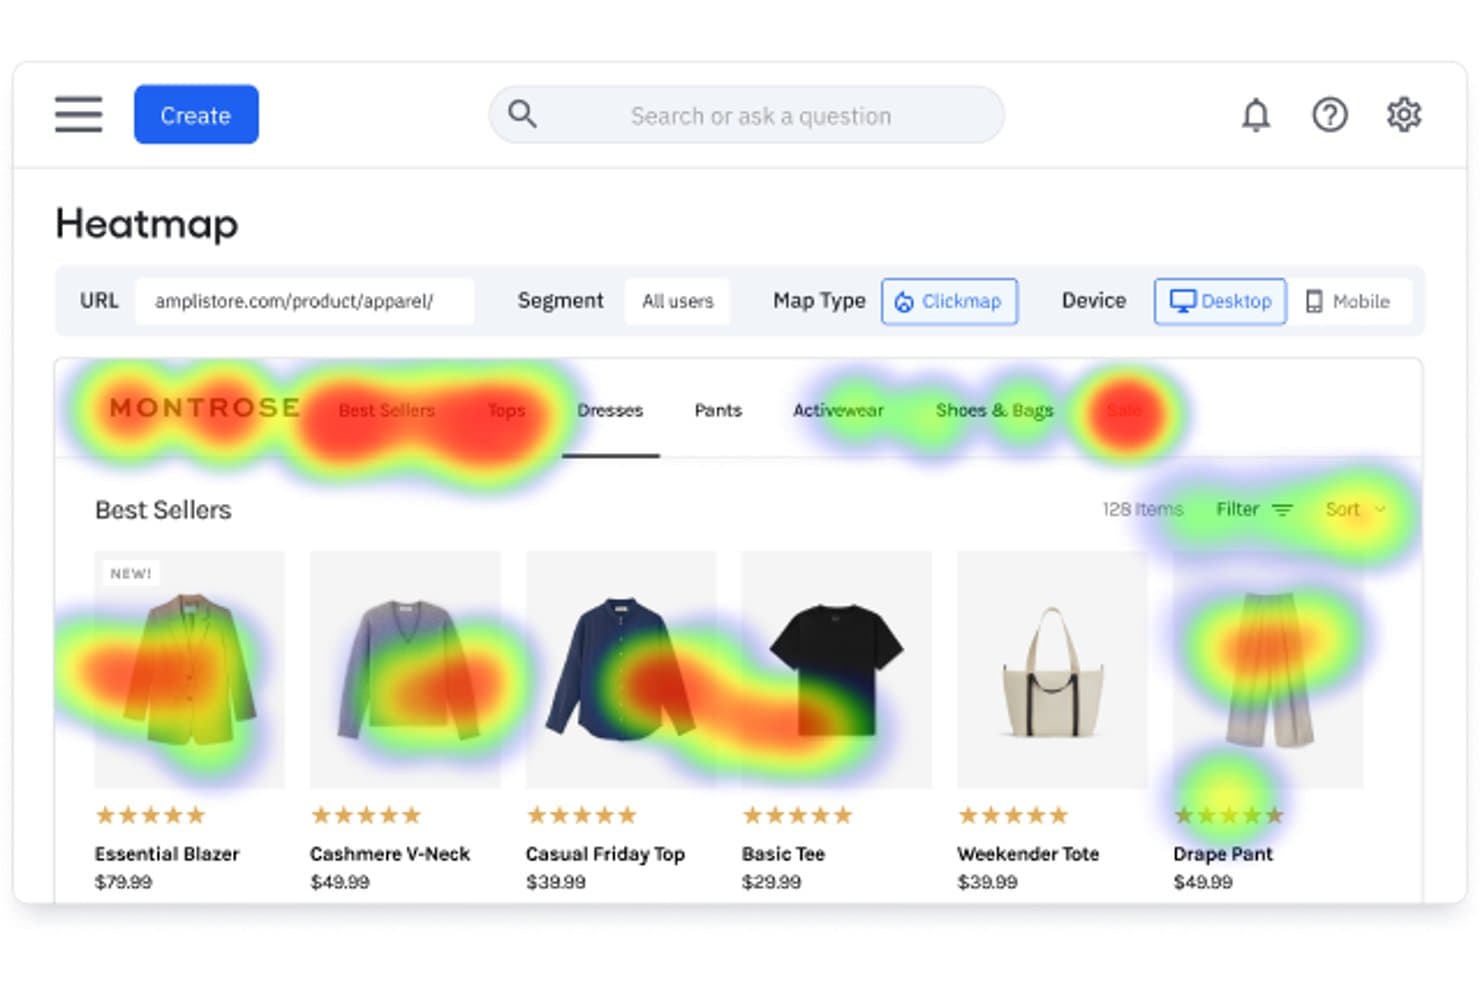
Amplitude's heatmap reveals where users click on a product page. Amplitude is a product analytics platform that includes click maps, selector maps, and scroll maps built directly on top of its Session Replay infrastructure, alongside event segmentation, cohort building, and behavioral analysis tools.
Who Is Amplitude Best For?
Amplitude is a strong fit for product and web analysts who already live in an event-based analytics workflow and want heatmaps wired directly into their segmentation, cohorts, and session replays.
Why I Picked Amplitude
I've included Amplitude in my top picks because its heatmaps are wired directly into its event segmentation engine, which means I can filter a click map by a behavioral cohort, a campaign source, or an experiment variant without leaving the same view. I especially like Microscope, which lets me highlight any zone on a click or selector map and instantly pull the replays, events, or a new cohort from that exact interaction. That loop, from visual heatmap data into quantified segments and back into experiments, is something I haven't seen replicated in a dedicated heatmap tool.
Amplitude Key Features
- Session Replay Agent: An AI tool that samples replays within a chosen funnel or event, detects rage clicks, dead clicks, and form abandonment, then delivers written findings and highlight reels.
- Scroll maps: Visual overlays showing what percentage of sessions reached each point on a page, with an adjustable depth slider and an average fold marker.
- Zoning Insights: Draw custom zones on any page to get per-zone click-through rate, exposure rate, and revenue-per-click data alongside AI opportunity scores.
- Guides and Surveys: Targeted NPS surveys, microsurveys, and visitor feedback widgets that trigger based on behavioral cohorts and link directly to Session Replay data.
Amplitude Integrations
Amplitude offers native integrations with Google Tag Manager, Segment, RudderStack, Braze, HubSpot, Salesforce, BigQuery, Optimizely, LaunchDarkly, and Meta Pixel. It also connects with data warehouses through customer data platform integrations.
Pros and Cons
Pros:
- Zoning Insights quantifies revenue per zone
- Microscope links zones to behavioral cohorts
- Cohort-filtered heatmaps connect to replays
Cons:
- Native mobile app heatmaps remain unavailable
- No hover or mouse-movement maps
Learn more about Amplitude: Best for free, no-cap behavioral analytics
- Free plan available
- Pricing upon request
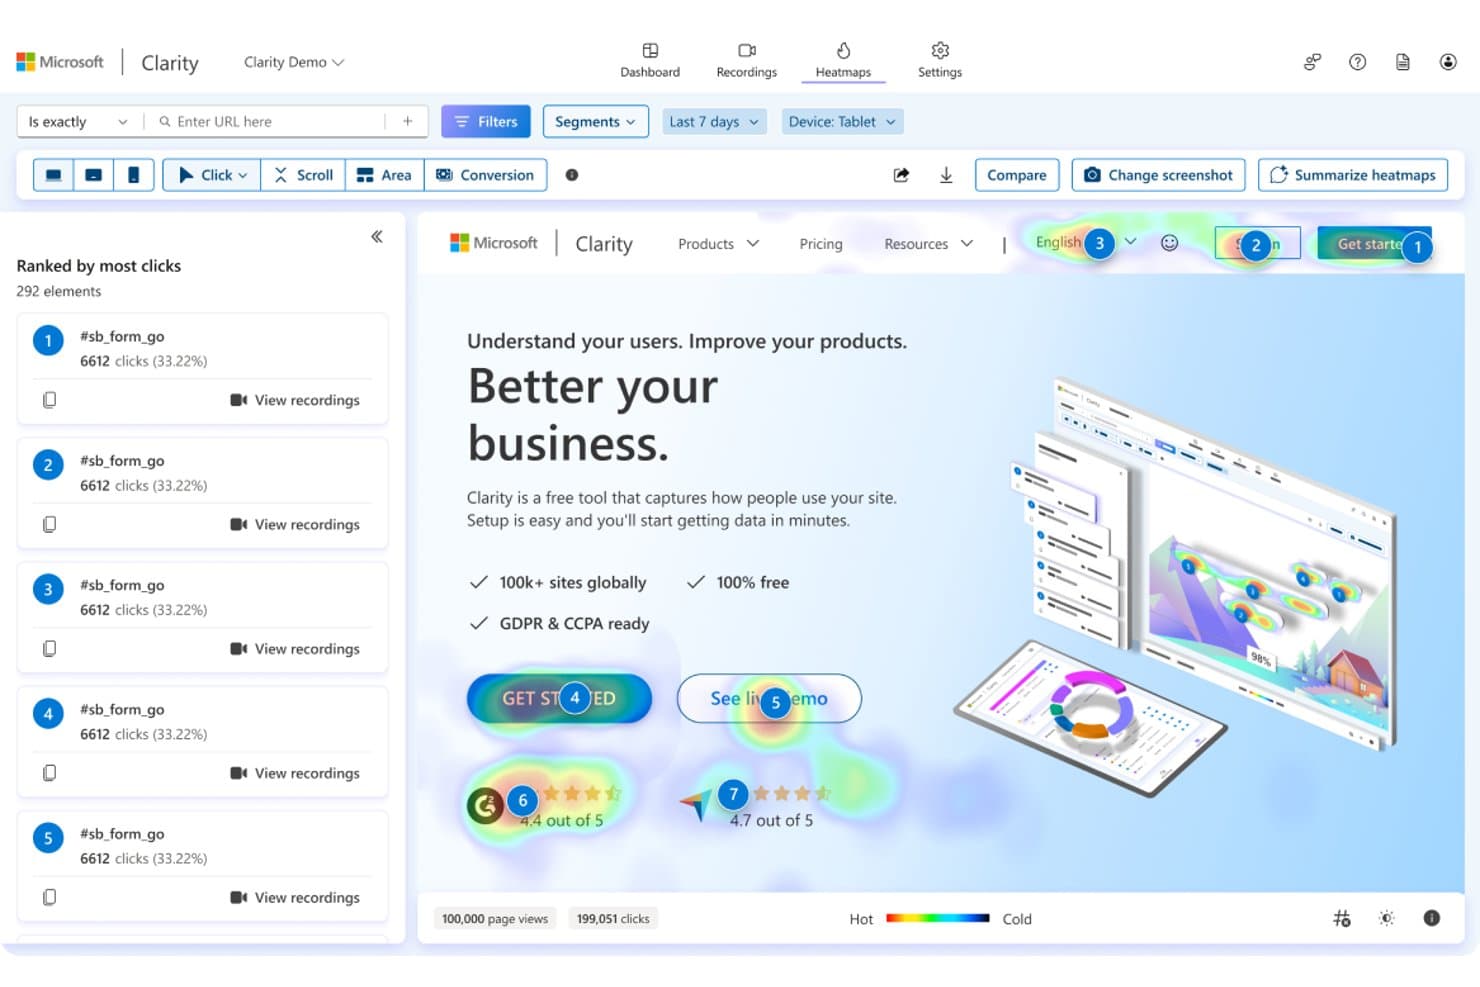
Microsoft Clarity shows click heatmaps ranked by most-clicked elements. Microsoft Clarity is a behavioral analytics platform that combines click maps, scroll maps, attention maps, session recordings, and AI-powered summaries to show you how users interact with your site or mobile app.
Who Is Microsoft Clarity Best For?
Microsoft Clarity is a strong fit for product teams and solo builders who want rich behavioral data without a budget attached.
Why I Picked Microsoft Clarity
Microsoft Clarity earns its spot on my shortlist because it's the only heatmap tool I've found that gives you five heatmap types, six click map variants (including rage, dead, and error clicks), session recordings, and AI Copilot summaries without a pricing tier in sight. I particularly like how clicking any ranked element in a click map instantly filters linked recordings to sessions where that exact element was clicked. That heatmap-to-recording linkage is what makes Clarity genuinely useful for diagnosing friction, not just spotting it.
Microsoft Clarity Key Features
- AI Copilot summaries: A built-in GPT-4o-powered assistant that generates plain-language summaries of heatmaps and session groups, plus a chat interface for direct questions.
- Funnels with step-level heatmap links: No-code funnels built from smart events and page visits that connect each step directly to filtered heatmaps and recordings.
- Mobile app SDK: Native support for Android, iOS, Flutter, React Native, Cordova, and Ionic that captures screen recordings, heatmaps, and crash data in one view.
- 30+ filters with savable segments: Filter heatmap data by device, UTM parameters, Core Web Vitals, ecommerce attributes, and more, then save and share any combination as a reusable segment.
Microsoft Clarity Integrations
Microsoft Clarity offers native integrations with Google Analytics 4, Google Tag Manager, Shopify, WordPress, WooCommerce, Wix, Squarespace, Firebase Crashlytics, and UserFeedback. It also provides Data Export and client APIs for custom integrations.
Pros and Cons
Pros:
- Heatmaps link directly to recordings
- Rage and dead clicks expose friction
- Five heatmap types support varied analysis
Cons:
- Short retention limits longitudinal comparisons
- No dedicated hover behavior heatmap
Learn more about Microsoft Clarity:
Diğer Isı Haritası Yazılımları
İşte en iyi seçenekler arasına giremeyen ancak araç aramanızı genişletiyorsanız değerlendirmeye değer birkaç web sitesi ısı haritası aracı ve diğer seçenek.
- 11LogRocketBest for linking heatmaps to AI session insights
- 12FullSessionBest for AI-ranked friction signals and click maps
- 13InspectletBest for heatmaps with built-in AI session analysis
- 14GlassboxBest for regulated-industry interaction analytics
- 15UXCamBest for mobile and web click behavior analysis
- 16PlerdyBest for all-in-one heatmaps with built-in surveys
- 17Zoho PagesenseBest for scroll depth and average fold insights
- 18BrowseeBest for heatmap-to-replay workflow navigation
İlgili Ürün Yönetimi İncelemeleri
Aradığınızı hâlâ bulamadıysanız, test edip değerlendirdiğimiz ve ısı haritası yazılımlarıyla yakından ilişkili şu araçlara göz atın:
- En İyi Ürün Yönetimi Araçları
- En İyi Ürün Planlama Yazılımları
- En İyi UX Tasarım Araçları
- En İyi Ürün Geliştirme Yazılımları
- En İyi Ürün Analitiği Araçları
- En İyi Fikir Yönetimi Yazılımları
- En İyi Kullanıcı Araştırması Araçları
How I Evaluate Heatmap Software
I split my evaluation into three parts, with core functionality carrying the most weight: a tool must visually map where users click and how far they scroll. From there, I look for standout features like rage click detection, then consider implementation speed and privacy compliance.
Core Functionality (Table Stakes for This List)
When I'm selecting tools for my list, I score each one on a scale from 0 (does not offer the functionality) to 5 (excels in this area) for each core functionality listed below. I then convert the total into a percentage to help assess each tool's overall fit, with extra weight on any functionalities I've deemed essential.
- Click, Scroll & Move Tracking (Essential): I check whether a tool captures all three interaction types and how well it handles dynamic elements like menus, modals, and carousels.
- Visual Heatmap Rendering: Overlays need to align accurately with the actual page layout, and I look for support across click, scroll, and movement map types in one view.
- Page & Segment Filtering: I evaluate whether you can slice heatmap data by traffic source, device, or custom attributes to compare behavior across meaningful user groups.
- Session Recording Integration: The link between heatmap zones and individual session replays matters most here. Clicking a hot spot should surface relevant recordings directly.
- Scroll Depth Analysis: I look for visual drop-off indicators with percentage markers, especially the ability to compare scroll depth across segments or device types.
- Cross-Device Capture: Mobile and desktop heatmaps should render in a unified interface without requiring separate setup or losing accuracy on responsive layouts.
Once I have a list of tools that meet the criteria, I consider what sets each platform apart.
Differentiating Factors (What Sets Vendors Apart)
Here's how I compare and contrast different vendors:
Standout Features
Rage and dead click detection is the first thing I check beyond core heatmaps. Tools like Hotjar and FullStory flag repeated frantic clicks on unresponsive elements, which helps you catch broken buttons or misleading UI before support tickets pile up. I also evaluate form analytics closely, since field-level drop-off data pinpoints exactly where users abandon a signup or checkout flow. Dynamic content and SPA support matters just as much—if your product uses client-side routing, heatmaps break without it.
Beyond Features
I check how each vendor's tracking script affects page performance, since a heavy SDK can skew the very behavior you're trying to measure. Privacy compliance is the other non-negotiable—I evaluate whether tools offer PII masking, consent management, and data residency options that match your team's obligations under GDPR or CCPA. I also look at how easily PMs can share annotated heatmap snapshots with designers and stakeholders without requiring everyone to log in.
Isı Haritası Yazılımı Nasıl Seçilir?
Bu kadar çok farklı ısı haritası yazılımı çözümü mevcut olduğundan, ihtiyaçlarınıza en uygun ısı haritası yazılımının hangisi olduğuna karar vermek zor olabilir.
Isı haritası yazılımlarını kısa listeye alırken, denerken ve seçerken aşağıdakileri göz önünde bulundurun:
- Çözmeye çalıştığınız sorun nedir - Isı haritası yazılımının sağlaması gereken özellikleri ve işlevleri netleştirmek için öncelikle gidermeye çalıştığınız ısı haritası özelliği eksikliğini belirleyin.
- Kimlerin kullanması gerekecek - Maliyeti ve gereksinimleri değerlendirmek için yazılımı kimlerin kullanacağını ve kaç lisansa ihtiyaç duyacağınızı göz önünde bulundurun. Erişimin yalnızca ürün yönetimi profesyonelleri için mi gerekli olacağını, yoksa tüm kuruluşun mu erişime ihtiyaç duyacağını değerlendirmeniz gerekir. Bu netleştiğinde, herkes için kullanım kolaylığını mı yoksa ısı haritası yazılımının uzman kullanıcıları için hızı mı önceliklendirdiğinizi düşünmeye değer.
- Hangi diğer araçlarla birlikte çalışması gerekiyor - Hangi araçların yerine geçeceğinizi, hangi araçların kullanılmaya devam edeceğini ve muhasebe, CRM veya İK yazılımı gibi hangi araçlarla entegre olmanız gerektiğini netleştirin. Araçların birbiriyle entegre olması gerekip gerekmediğine veya alternatif olarak birden fazla aracı tek bir birleştirilmiş ısı haritası aracıyla değiştirip değiştiremeyeceğinize karar vermeniz gerekir.
- Hangi sonuçlar önemli - Yazılımın başarılı sayılabilmesi için sağlaması gereken sonucu göz önünde bulundurun. Hangi yeteneği kazanmak veya neyi geliştirmek istediğinizi ve başarıyı nasıl ölçeceğinizi düşünün. Örneğin sonuç, performans hakkında daha fazla görünürlük elde etme becerisi olabilir. Isı haritası yazılımı özelliklerini, gözünüz mosmor olana kadar karşılaştırabilirsiniz; ancak elde etmek istediğiniz sonuçları düşünmüyorsanız, çok değerli zamanınızı boşa harcıyor olabilirsiniz.
- Kuruluşunuz içinde nasıl çalışacağı - Yazılım seçimini iş akışlarınız ve teslimat metodolojinizle birlikte değerlendirin. Nelerin iyi çalıştığını ve ele alınması gereken sorunlara yol açan alanları değerlendirin. Her işletmenin farklı olduğunu unutmayın — bir aracın popüler olması, kuruluşunuzda işe yarayacağı anlamına gelmez.
2025'te Isı Haritası Yazılımındaki Trendler
Teknoloji geliştikçe ve ürün yönetimi gereksinimleri değiştikçe, ısı haritası yazılımı da gelişmeye ve giderek daha gelişmiş araçlar sunmaya devam ediyor. Bu ürün trendleri yalnızca kullanıcı deneyimi tasarımındaki değişen yapıyı yansıtmakla kalmıyor, aynı zamanda önem kazanan, hızla gelişen veya daha az talep gören özellikleri ve işlevleri de öne çıkarıyor.
Gelişen Özellikler
- Gelişmiş Kullanıcı Segmentasyonu: Son güncellemeler, daha ayrıntılı kullanıcı segmentasyonu özelliklerine yönelik güçlü bir eğilim olduğunu gösteriyor. Bu özellik, işletmelerin belirli kullanıcı davranışlarına, demografik özelliklere veya trafik kaynaklarına dayalı olarak son derece özelleştirilmiş ısı haritaları oluşturmasına olanak tanır ve farklı kitle segmentleri hakkında daha derin içgörüler sağlar.
- Yapay Zekâ Destekli İçgörüler: Isı haritası yazılımında hızla gelişen bir özellik, kullanıcı davranışı kalıplarını analiz etmek için yapay zekânın kullanılmasıdır. Yapay zekâ algoritmaları kullanıcı eylemlerini tahmin edebilir, anormallikleri belirleyebilir ve optimizasyonlar önerebilir; böylece veri analizini hem daha verimli hem de daha anlamlı hâle getirir.
En Önemli ve Talep Gören Özellikler
- Oturum Tekrarı ve Gerçek Zamanlı Analiz: Sürekli olarak yüksek talep gören oturum tekrarı ve gerçek zamanlı analiz, kullanıcı davranışlarının ardındaki “neden”i anlamak için kritik önemini koruyor. Bu özellikler, işletmelerin kullanıcı oturumlarını gerçekleştiği anda izlemesine ve kullanıcı deneyimini iyileştirmek için anında düzenlemeler yapmasına olanak tanır.
- Entegrasyon Özellikleri: Isı haritası yazılımını diğer araçlarla (analiz, CRM ve pazarlama otomasyonu platformları gibi) entegre etmenin önemi her zamankinden daha belirgin. Bu durum, farklı temas noktalarında müşteri yolculuğuna ilişkin bütünsel bir görünüm elde etme ihtiyacının arttığını yansıtıyor.
Önemi Azalanlar
- Sabit Isı Haritaları: Teknoloji geliştikçe, geleneksel sabit ısı haritaları daha az önem kazanıyor. Kullanıcılar artık yalnızca temel tıklama ve kaydırma verileri sunan değil, daha fazlasını sağlayan dinamik ve etkileşimli ısı haritaları bekliyor; bu da daha uygulanabilir ve derinlemesine analizlere doğru bir geçişi yansıtıyor.
Genel olarak, ısı haritası yazılımındaki devam eden gelişmeler, sektörün daha öngörücü, kişiselleştirilmiş ve uygulanabilir içgörülere doğru geçişini vurguluyor.
Bu trendler yalnızca ürün yönetimi profesyonellerinin acil ihtiyaçlarını karşılamakla kalmıyor, aynı zamanda daha sezgisel, verimli ve etkili kullanıcı deneyimi optimizasyonu stratejilerinin önünü açıyor.
Isı Haritası Yazılımı Nedir?
Isı haritası yazılımı, renk geçişlerini kullanarak etkileşim verilerini web siteniz veya uygulamanız üzerinde haritalandırıp kullanıcı davranışlarını görselleştiren bir araçtır.
Ürün yöneticilerinin ve UX ekiplerinin kullanıcıların nerelere tıkladığını, nereleri kaydırdığını ve nerelerde beklediğini hızlıca görmesine yardımcı olur; böylece hangi öğelerin dikkat çektiğini, hangilerinin ise göz ardı edildiğini ortaya çıkarır. Isı haritaları, sürtüşme noktalarını ve etkileşim kalıplarını açığa çıkararak kullanılabilirliği, içerik yerleşimini ve genel ürün deneyimini iyileştiren daha bilinçli tasarım kararlarını destekler.
Isı Haritası Yazılımının Özellikleri
Isı haritası yazılımı, ekibinize kullanıcı etkinliğini görselleştirmek ve web sitenizi veya uygulamanızı gerçek kullanıcı etkileşimlerine göre optimize etmek için gerekli araçları sağlar. Isı haritası yazılımı seçerken göz önünde bulundurulması gereken en önemli özellikler şunlardır:
- Gerçek Zamanlı Veri Takibi: Bu özellik, kullanıcı davranışlarını gerçekleştiği anda gözlemlemenizi sağlar. Anlık içgörüler, stratejileri hızla ayarlamak ve kullanıcı deneyimini iyileştirmek için kritik öneme sahiptir.
- Kullanıcı Segmentasyonu: Isı haritalarını kullanıcı demografik özelliklerine veya davranış kalıplarına göre segmentlere ayırabilme özelliği, analizlerinizi özelleştirmenize ve belirli grupları daha derinlemesine anlamanıza olanak tanır.
- Tıklama Takibi: Bu özellik, kullanıcıların bir sayfada en sık nerelere tıkladığını kaydeder. Kullanıcıların en fazla etkileşimde bulunduğu yerleri anlamak, içerik ve tasarım öğelerine öncelik vermenize yardımcı olur.
- Kaydırma Derinliği Analizi: Kullanıcıların ne kadar aşağı kaydırdığını takip etmek, içeriğinizin ne kadarının gerçekten tüketildiğini ortaya çıkarabilir ve önemli bilgilerin yerleşimini optimize etmenize yardımcı olur.
- Isı Haritası Oynatma: Oynatma özellikleri, kullanıcı etkileşimlerinin gerçekleştiği oturumları yeniden oynatır. Kullanıcıların gerçek zamanlı olarak nasıl gezindiğini görmek, yalnızca statik verilerden fark edilemeyebilecek kullanılabilirlik sorunlarını ortaya çıkarabilir.
- Entegrasyon Yetenekleri: Diğer analiz araçları ve platformlarıyla sorunsuz entegrasyon, ısı haritası verilerinin faydasını genişletir ve onu bütünsel bir analiz ekosisteminin parçası hâline getirir.
- Duyarlı Isı Haritaları: Isı haritalarının tüm cihazlar ve ekran boyutlarıyla uyumlu olmasını sağlamak, platformlar arasındaki kullanıcı etkileşimi verilerinin doğruluğunu etkilediği için çok önemlidir.
- Üzerine Gelme ve Etkileşim Takibi: Tıklamaların ötesinde, fare hareketlerini ve imlecin üzerine gelme durumlarını takip etmek, tıklamayla sonuçlanmayabilecek kullanıcı niyeti ve ilgi alanları hakkında içgörüler sağlar.
- Detaylı Raporlama ve Dışa Aktarma: Ayrıntılı raporlar oluşturma ve daha ileri analizler için verileri dışa aktarma olanağı, daha kapsamlı incelemelere ve içgörülerin ekip üyeleriyle paylaşılmasına imkân tanır.
- Gizlilik Uyumluluğu: Yazılımın küresel gizlilik yasalarına uygun olmasını sağlamak, kullanıcı verilerini korur ve şirketinizi hukuki sorunlardan uzak tutar.
Bu temel özelliklere odaklanarak ısı haritası aracınızın yalnızca gerekli verileri toplamasını değil, aynı zamanda stratejik analiz ve karar alma süreçlerinizle uyumlu olmasını da sağlayabilirsiniz.
Isı Haritası Yazılımının Faydaları
Kullanıcıların çeşitli öğelerle nasıl etkileşim kurduğunu görsel olarak temsil eden ısı haritası yazılımı, karar alma süreçlerini yönlendirebilecek ve kullanıcı deneyimlerini iyileştirebilecek açık ve uygulanabilir veriler sağlar.
Bu teknolojiye yatırım yapmayı düşünen işletmeler için ısı haritası yazılımının beş temel faydası şunlardır:
- Geliştirilmiş Kullanıcı Deneyimi (UX) Tasarımı: Isı haritası yazılımı, kullanıcıların en fazla etkileşim gösterdiği bir web sitesindeki popüler alanları ve öğeleri belirlemenizi sağlar. Bu veriler, işletmelerin web sitelerinin düzenini optimize etmesine yardımcı olur ve önemli içeriğin kullanıcıların onu fark edip etkileşimde bulunma olasılığının en yüksek olduğu yerlere yerleştirilmesini sağlayarak genel kullanıcı deneyimini iyileştirir.
- Artan Dönüşüm Oranları: Isı haritası yazılımı, bir sitede daha az ilgi gören veya kullanıcılar için sorun oluşturan alanları öne çıkararak işletmelerin bilinçli düzenlemeler yapmasına olanak tanır. Bu, kullanıcı akışının ve gezinmenin iyileşmesini sağlayabilir; satın alma veya bültene kaydolma gibi istenen işlemleri kullanıcıların tamamlamasını engelleyebilecek sürtüşme noktalarını azaltır.
- Veriye Dayalı Karar Alma: Isı haritası yazılımı, geleneksel analizlerden daha sezgisel ve anlaşılması daha kolay olabilen görsel veriler sunar. Bu sayede ekipler tasarım ve içerik stratejileri hakkında daha hızlı ve bilinçli kararlar alabilir; daha etkili ve kullanıcı odaklı web sitesi güncellemeleri gerçekleştirebilir.
- Geliştirilmiş İçerik Etkileşimi: Kullanıcıların içerikle nasıl etkileşim kurduğunu, neleri tıkladığını ve ne kadar aşağı kaydırdığını anlamak, içerik yerleşiminin ve biçiminin optimize edilmesini sağlar. Bu, yüksek değerli içeriğin daha sık görülmesini ve içerikle daha fazla etkileşim kurulmasını sağlayarak pazarlama çalışmalarının etkinliğini artırır.
- Kullanılabilirlik Sorunlarının Verimli Biçimde Belirlenmesi: Isı haritaları, tıklanamayan öğeler veya kafa karıştırıcı gezinme gibi kullanıcıların zorluk yaşadığı alanları hızlı bir şekilde ortaya çıkarabilir. Bu sorunların hızla belirlenip çözülmesi, daha akıcı ve keyifli bir kullanıcı deneyimi sağlar; hemen çıkma oranlarını azaltır ve sitede daha uzun süre kalmayı teşvik eder.
Kullanıcı davranışını daha iyi anlamak ve dijital platformlarını optimize etmek isteyen kuruluşlar için ısı haritası yazılımı; daha yüksek kullanıcı memnuniyeti, daha yüksek dönüşüm oranları ve daha stratejik karar alma süreçleri sağlayabilecek bir dizi avantaj sunar.
Isı Haritası Yazılımı Maliyetleri ve Fiyatlandırması
Isı haritası yazılımı seçeneklerini incelerken sağlayıcıların fiyatları ve planları önemli ölçüde farklılık gösterebilir. Seçenekler genellikle temel özelliklere sahip ücretsiz ısı haritası yazılımı planlarından daha kapsamlı analizler ve daha fazla özelleştirme sunan gelişmiş, premium planlara kadar uzanır.
Bilinçli bir karar vermenize yardımcı olmak için yaygın plan seçenekleri ve fiyatlandırmalarının dökümü aşağıda yer almaktadır:
Isı Haritası Yazılımı İçin Plan Karşılaştırma Tablosu
| Plan Türü | Ortalama Fiyat | Dahil Edilen Yaygın Özellikler |
|---|---|---|
| Plan TürüTemel | Ortalama Fiyat$10 - $50/ay | Dahil Edilen Yaygın ÖzelliklerTemel ısı haritası işlevselliği, sınırlı sayfa görüntüleme, temel raporlama ve sınırlı oturum kayıtları. |
| Plan TürüStandart | Ortalama Fiyat$50 - $100/ay | Dahil Edilen Yaygın ÖzelliklerGelişmiş ısı haritası işlevselliği, artırılmış sayfa görüntüleme, gelişmiş raporlama, daha fazla oturum kaydı ve segmentasyon özellikleri. |
| Plan TürüPremium | Ortalama Fiyat$100 - $200/ay | Dahil Edilen Yaygın ÖzelliklerTüm standart özelliklere ek olarak gelişmiş entegrasyonlar, tam özelleştirme, sınırsız sayfa görüntüleme ve özel destek. |
| Plan TürüKurumsal | Ortalama FiyatÖzel Fiyatlandırma | Dahil Edilen Yaygın ÖzelliklerTüm premium özelliklere ek olarak API erişimi, özel veri saklama, kurumsal düzeyde güvenlik ve kişisel hesap yönetimi. |
| Plan TürüÜcretsiz Seçenek | Ortalama Fiyat$0 | Dahil Edilen Yaygın ÖzelliklerSınırlı ısı haritası işlevselliği, çok sınırlı sayfa görüntüleme ve temel raporlama. |
Bir plan seçerken hem mevcut ihtiyaçlarınızı hem de gelecekteki olası gereksinimlerinizi göz önünde bulundurmanız önemlidir. Ücretsiz bir seçenek veya temel planla başlamak, ihtiyaçlarınız arttıkça daha gelişmiş özelliklere geçmeden önce ısı haritası yazılımının işlevlerine aşina olmanın iyi bir yolu olabilir.