

Hotjar Review: Pros, Cons, Features, and Pricing Explained
Hotjar stands out for its user-friendly heatmaps and session recordings, making it ideal for teams seeking actionable insights, though advanced users may find its analytics less robust than some competitors.

We review tools independently, and commissions help fund our testing. See our transparency policy, our methodology, or suggest a tool.
Hotjar is a heatmap software that combines click maps, scroll maps, and session recordings with on-site surveys and feedback widgets. It's a natural fit for product teams who want to understand how users behave on their product or website without stitching together multiple tools. I'd consider it over FullStory if your team doesn't need enterprise-grade data governance or deep technical integrations—Hotjar gives you the same core behavior analytics in a setup that's faster to get running and easier for non-technical teammates to use day-to-day.
Hotjar (by Contentsquare) Evaluation Summary
4.5/5
- From $39/month (billed annually)
- Free plan available
Why Trust Our Software Recommendations
6,700+
Reviews
20
Industry experts
16+
Evaluation factors
14
Years
Our team has been testing and reviewing software since 2012. As product managers ourselves, we know how difficult—and important—it is to choose the right software.
For this guide, we evaluated tools using hands-on testing and independent research, scoring tools using our selection criteria.
Our reviews reflect our human editorial judgment, not a sales pitch.
Expert reviewers:
- Andrew LumbySenior TPM
- Cristiano ValimSenior UI/UX Lead


Hotjar (by Contentsquare) Overview
Hotjar is a top pick if you're judging heatmap software on ease of use, onboarding, and visual clarity. Its user interface is intuitive, and setup takes minutes, making it accessible for beginners and teams new to user analytics. Hotjar’s pricing is transparent and competitive, especially for small to mid-sized businesses. While its analytics depth and integrations are more limited than some alternatives, Hotjar excels at quick insights and clear visualizations. If you're selecting an all-in-one tool for rapid feedback, UX testing, or prioritizing website changes, Hotjar is a strong contender—especially for product, marketing, or UX teams that value speed and simplicity over advanced features.
Pros
- Visual hotjar heatmaps show click, scroll, and mouse movements data clearly.
- Session recordings help pinpoint user friction and drop off points.
- Survey and feedback tools are built into the same platform.
Cons
- No advanced segmentation for heatmap data filtering.
- Data retention is limited on lower pricing tiers.
- Lacks support for tracking dynamic or single-page applications fully.
Is Hotjar (by Contentsquare) Right For Your Needs?
Who Would be a Good Fit for Hotjar (by Contentsquare)?
Hotjar is a strong choice for teams that need quick, visual insights into user behavior without complex setup or deep technical resources. It's especially useful for digital-first businesses, product teams, and marketers who want to validate design changes, optimize conversion rates, or gather user feedback directly on their site.
Hotjar's built-in surveys and session recordings make it easy to connect qualitative and quantitative data, which is valuable for teams focused on continuous improvement and rapid iteration. As an all-in-one behavior analytics tool, it covers a lot of ground without requiring multiple analytics tools.
- SaaS StartupsHotjar's fast setup and clear heatmaps help startups test and refine landing pages.
- Marketing TeamsBuilt-in feedback polls and surveys support campaign optimization and A/B testing.
- Ecommerce StoresSession recordings reveal checkout issues and product page drop offs.
- UX DesignersVisual heatmaps and recordings help validate design changes and user flows.
- Small AgenciesAffordable pricing and easy onboarding suit agencies managing multiple sites.
- Content TeamsScroll maps show how far users engage with long-form content.
Who Would be a Bad Fit for Hotjar (by Contentsquare)?
Hotjar may not be the best option for organizations that need advanced features, deep integrations, or support for complex web architectures. Enterprises with strict data retention needs, highly dynamic sites, or requirements for granular segmentation may find Hotjar's feature set limiting. Teams that rely on detailed attribution, custom event tracking, or integration with enterprise analytics tools may need a more specialized solution.
- Large EnterprisesLimited data retention and segmentation may not meet enterprise analytics needs.
- Financial ServicesStrict compliance and data privacy requirements may exceed Hotjar's capabilities.
- Single-Page AppsHotjar struggles to track dynamic content changes in SPAs.
- Data AnalystsLacks advanced filtering, custom event tracking, and export options.
- Healthcare ProvidersDoes not offer HIPAA compliance or advanced security certifications.
- Mobile-First ProductsMobile app tracking is not supported, only web-based analytics.
How We Test & Score Tools
We’ve spent years building, refining, and improving our software testing and scoring system. The rubric is designed to capture the nuances of software selection and what makes a tool effective, focusing on critical aspects of the decision-making process.
Below, you can see exactly how our testing and scoring works across seven criteria. It allows us to provide an unbiased evaluation of the software based on core functionality, standout features, ease of use, onboarding, customer support, integrations, customer reviews, and value for money.
Core Functionality (25% of final scoring)
The starting point of our evaluation is always the core functionality of the tool. Does it have the basic features and functions that a user would expect to see? Are any of those core features locked to higher-tiered pricing plans? At its core, we expect a tool to stand up against the baseline capabilities of its competitors.
Standout Features (25% of final scoring)
Next, we evaluate uncommon standout features that go above and beyond the core functionality typically found in tools of its kind. A high score reflects specialized or unique features that make the product faster, more efficient, or offer additional value to the user.
We also evaluate how easy it is to integrate with other tools typically found in the tech stack to expand the functionality and utility of the software. Tools offering plentiful native integrations, 3rd party connections, and API access to build custom integrations score best.
Ease of Use (10% of final scoring)
We consider how quick and easy it is to execute the tasks defined in the core functionality using the tool. High scoring software is well designed, intuitive to use, offers mobile apps, provides templates, and makes relatively complex tasks seem simple.
Onboarding (10% of final scoring)
We know how important rapid team adoption is for a new platform, so we evaluate how easy it is to learn and use a tool with minimal training. We evaluate how quickly a team member can get set up and start using the tool with no experience. High scoring solutions indicate little or no support is required.
Customer Support (10% of final scoring)
We review how quick and easy it is to get unstuck and find help by phone, live chat, or knowledge base. Tools and companies that provide real-time support score best, while chatbots score worst.
Customer Reviews (10% of final scoring)
Beyond our own testing and evaluation, we consider the net promoter score from current and past customers. We review their likelihood, given the option, to choose the tool again for the core functionality. A high scoring software reflects a high net promoter score from current or past customers.
Value for Money (10% of final scoring)
Lastly, in consideration of all the other criteria, we review the average price of entry level plans against the core features and consider the value of the other evaluation criteria. Software that delivers more, for less, will score higher.
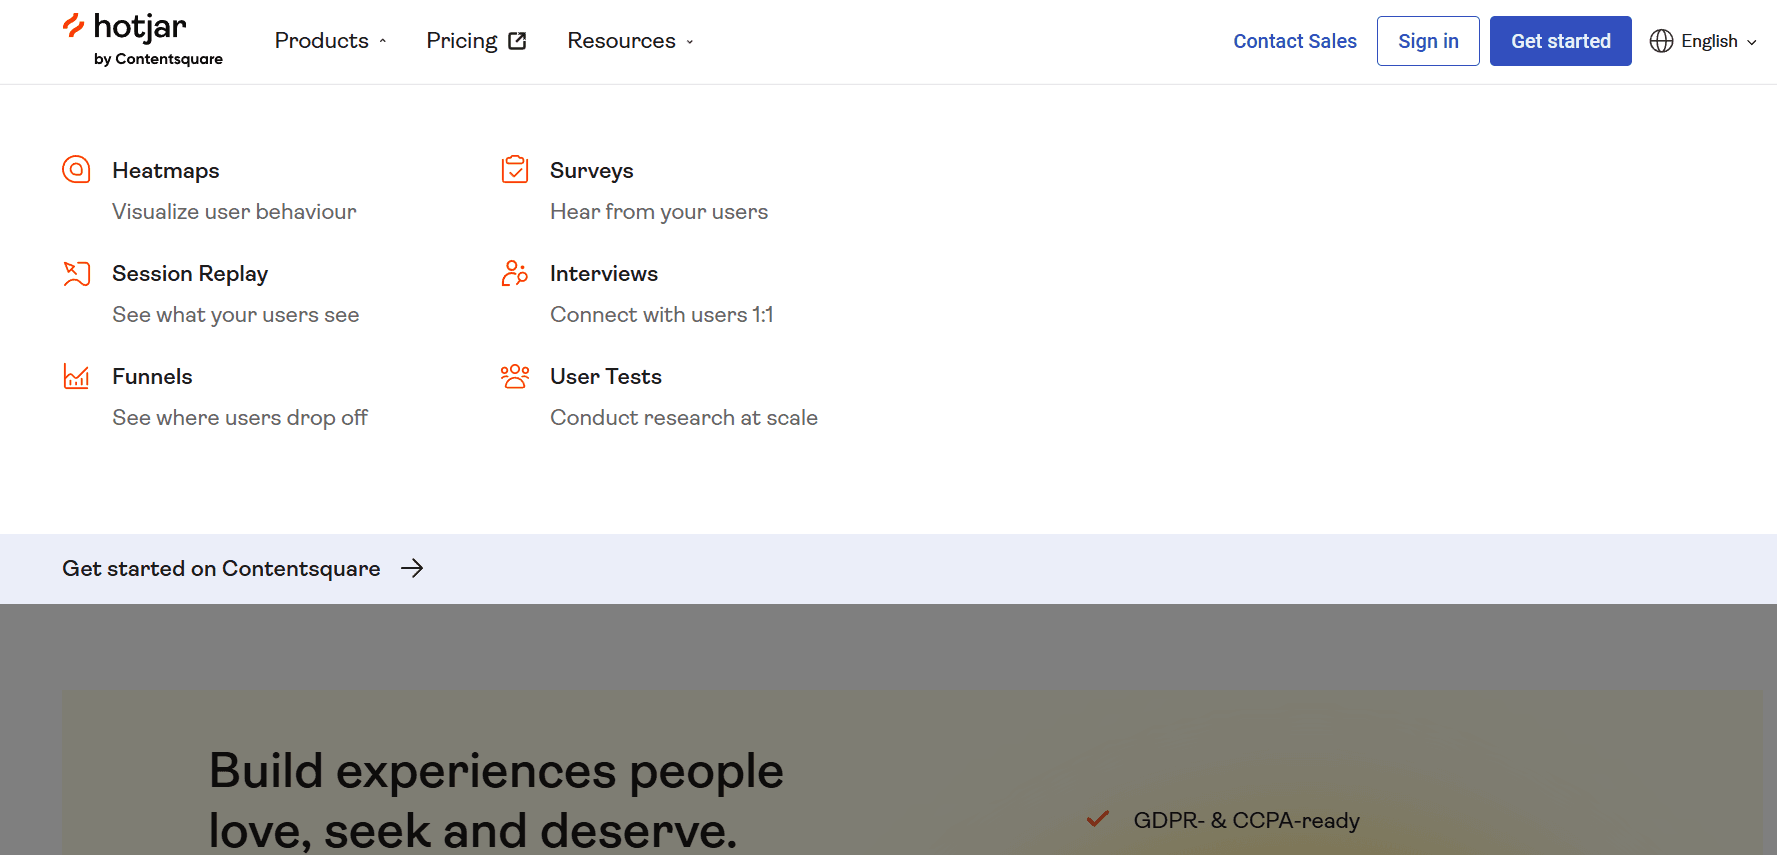
Core Features
Heatmaps
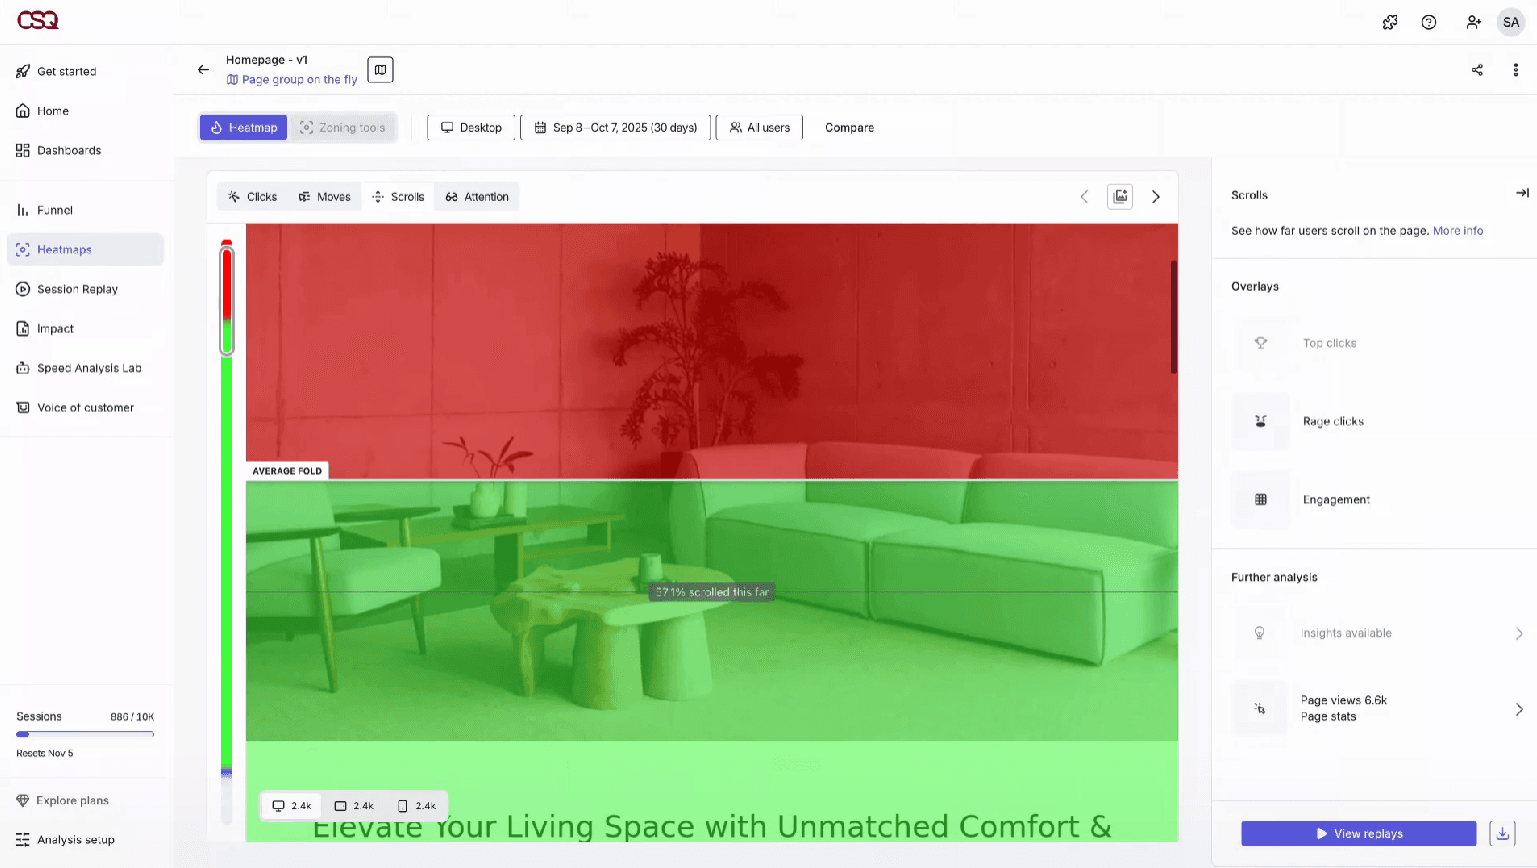
Visualize where users click, move, and scroll on your site. See which page elements attract attention and which get ignored.
Session Recordings
Watch real user sessions to identify friction points and drop offs. Playback tools let you filter by device, page, or user actions.
Surveys
Create on-site surveys to collect user feedback in context. Target questions to specific pages or user behaviors.
Incoming Feedback
Add feedback widgets for users to rate their experience or leave comments. Responses are tied to specific pages for actionable insights.
Funnels
Track user journeys through multi-step processes like signups or checkouts. Identify where users abandon the flow and optimize those steps.
User Interviews
Recruit users for live interviews directly from your website. Schedule and manage calls to gather deeper qualitative insights.
Ease of Use
Hotjar is widely recognized for its intuitive user interface and quick setup, making it accessible even for beginners and non-technical users. Most teams can launch hotjar heatmaps or session replays within minutes, and the dashboard organizes insights in a clear, actionable way. Users often mention that onboarding is straightforward, with helpful guides and tooltips throughout the platform. This usability makes Hotjar a practical choice for teams that want immediate, visual feedback without a steep learning curve.
Integrations
Hotjar integrates with Google Analytics, Slack, HubSpot, Segment, Optimizely, Microsoft Teams, and Trello, among others.
Hotjar also offers an API and connects with third-party integration tools like Zapier for expanded functionality.

Hotjar (by Contentsquare) Specs
- A/B Testing: Yes
- AI Integration: Yes
- Analytics: Yes
- API: Yes
- Big Data: Yes
- Campaign Management: Yes
- Conversion Tracking: Yes
- Custom Reports: Yes
- Dashboard: Yes
- Data Export: Yes
- Data Import: Yes
- Data Visualization: Yes
- External Integrations: Yes
- Feedback Management: Yes
- Keyword Tracking: Yes
- Landing Pages: Yes
- Link Tracking: Yes
- Multi-User: Yes
- Notifications: Yes
- Process Reporting: Yes
- Referral Tracking: Yes
- Sentiment Analysis: Yes
- SEO: Yes
- Workflow Management: Yes


