

Enquanto gestor de produto, conhece a pressão de proporcionar experiências de utilizador excecionais. A sua equipa depende de si para identificar e resolver rapidamente problemas de usabilidade. É aqui que entram as ferramentas de auditoria UX. Estas ajudam-no a detetar problemas, compreender o comportamento dos utilizadores e tomar decisões informadas para melhorar o seu produto.
Com base na minha experiência, ter as ferramentas certas pode fazer uma diferença significativa. Testei e analisei de forma independente as melhores ferramentas de auditoria UX disponíveis no mercado. O meu objetivo é apresentar-lhe uma análise imparcial e bem fundamentada das principais opções.
Neste artigo, encontrará informações sobre as funcionalidades e vantagens de cada ferramenta. Ficará preparado para escolher a melhor solução para as necessidades da sua equipa.
Why Trust Our Software Recommendations
6,700+
Reviews
20
Industry experts
16+
Evaluation factors
14
Years
Our team has been testing and reviewing software since 2012. As product managers ourselves, we know how difficult—and important—it is to choose the right software.
For this guide, we evaluated tools using hands-on testing and independent research, scoring tools using our selection criteria.
Our reviews reflect our human editorial judgment, not a sales pitch.
Expert reviewers:
- Andrew LumbySenior TPM
- Cristiano ValimSenior UI/UX Lead


Tabela comparativa de ferramentas de auditoria UX
Esta tabela comparativa resume os detalhes de preços das minhas principais escolhas de ferramentas de auditoria UX.
| Tool | Best For | Trial Info | Price | ||
|---|---|---|---|---|---|
| 1 | Best for mixed-method UX research in one place | Free plan available | From $80/month (billed annually) | Website | |
| 2 | Best for revenue-impact scoring on UX friction | Free demo available | Pricing upon request | Website | |
| 3 | Best for multi-device UX testing across global panels | Free demo available | From $699/month (billed annually) | Website | |
| 4 | Best for friction detection tied to funnel drop-offs | 30-day free trial + free demo available | Pricing upon request | Website | |
| 5 | Best for AI-grouped replay insights from surveys | 14-day free trial + free plan available | From $175/month (billed annually) | Website | |
| 6 | Best for QXscore benchmarking across releases | Free demo available | Pricing upon request | Website | |
| 7 | Best for behavior capture with AI-driven summaries | Free plan + 15-day free trial + free demo available | From $49/month | Website | |
| 8 | Best for AI-ranked friction signals by revenue impact | Free plan available | Pricing upon request | Website | |
| 9 | Best for heatmaps with built-in A/B testing | 30-day free trial available | From $29/month | Website | |
| 10 | Best for prototype-to-live-site usability testing | Free plan + free demo available | Pricing upon request | Website |


Análises das melhores ferramentas de auditoria UX
Apresentamos abaixo os meus resumos detalhados das melhores ferramentas de auditoria UX que entraram na minha lista restrita. As minhas análises apresentam uma visão detalhada das principais funcionalidades, vantagens e desvantagens, integrações e casos de utilização ideais de cada ferramenta, para o ajudar a encontrar a melhor opção para si.
 Best for mixed-method UX research in one place
- Free plan available
- From $80/month (billed annually)
Visit WebsiteCustomer Rating:4.8/5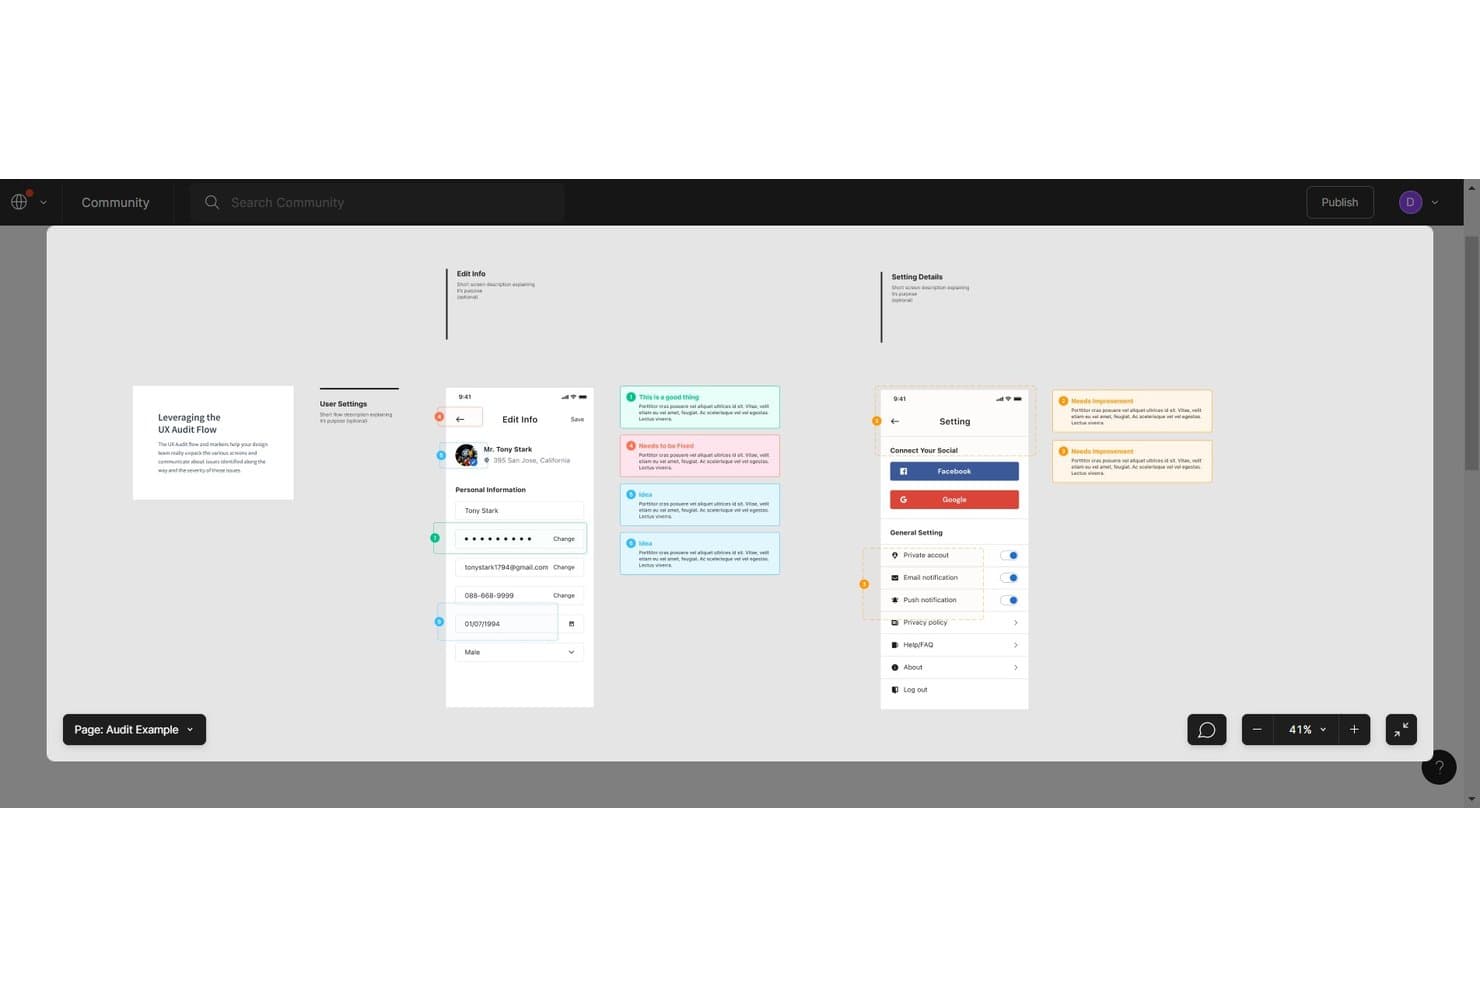
UXtweak's Figma audit flow annotates screens with color-coded issue markers. UXtweak is a UX research platform that brings together session recording, heatmaps, tree testing, card sorting, prototype and mobile app testing, moderated interviews, and participant recruitment under one roof.
Who Is UXtweak Best For?
UXtweak is a strong fit for UX researchers and CRO consultants who need to run multiple research methods—from tree testing to moderated interviews—without juggling separate tools.
Why I Picked UXtweak
UXtweak earns its spot on my shortlist because it genuinely consolidates every research method you'd need for a UX audit into one place. I'm particularly drawn to how its Design Score surfaces prototype friction automatically, flagging dead clicks and wrong paths before a single stakeholder asks a question. Pair that with built-in tree testing and card sorting alongside session recording, and you can move from architecture validation to live-site behavior analysis without switching tools.
UXtweak Key Features
- Session recording with smart search: Filter recorded sessions using 40+ criteria—including clicked elements, visited URLs, and typed input—to isolate exactly the interactions you need to review.
- Mobile app testing without an SDK: Test iOS and Android apps, including TestFlight builds and APKs, using a companion app rather than code instrumentation.
- Built-in participant recruitment panel: Access a panel across 130+ countries with 2,000+ targeting attributes, quality checks, and free participant replacements.
- Collaborative insights editor: Build shareable reports with embedded video clips and study artifacts that team members can contribute to together.
UXtweak Integrations
UXtweak documents eight integrations, including Figma, Google Drive, Microsoft OneDrive, Condens, Dovetail, Marvin, Notion, and Google Tag Manager. It also supports Marvel and Axure prototypes through public URLs.
Pros and Cons
Pros:
- Produces shareable reports with replay evidence
- Surfaces dead clicks, lostness, and drop-offs
- Combines behavioral and participant research methods
Cons:
- Session recording lacks automatic issue flagging
- No dedicated heuristic evaluation checklist
Learn more about UXtweak: Best for revenue-impact scoring on UX friction
- Free demo available
- Pricing upon request
Visit WebsiteCustomer Rating:4.7/5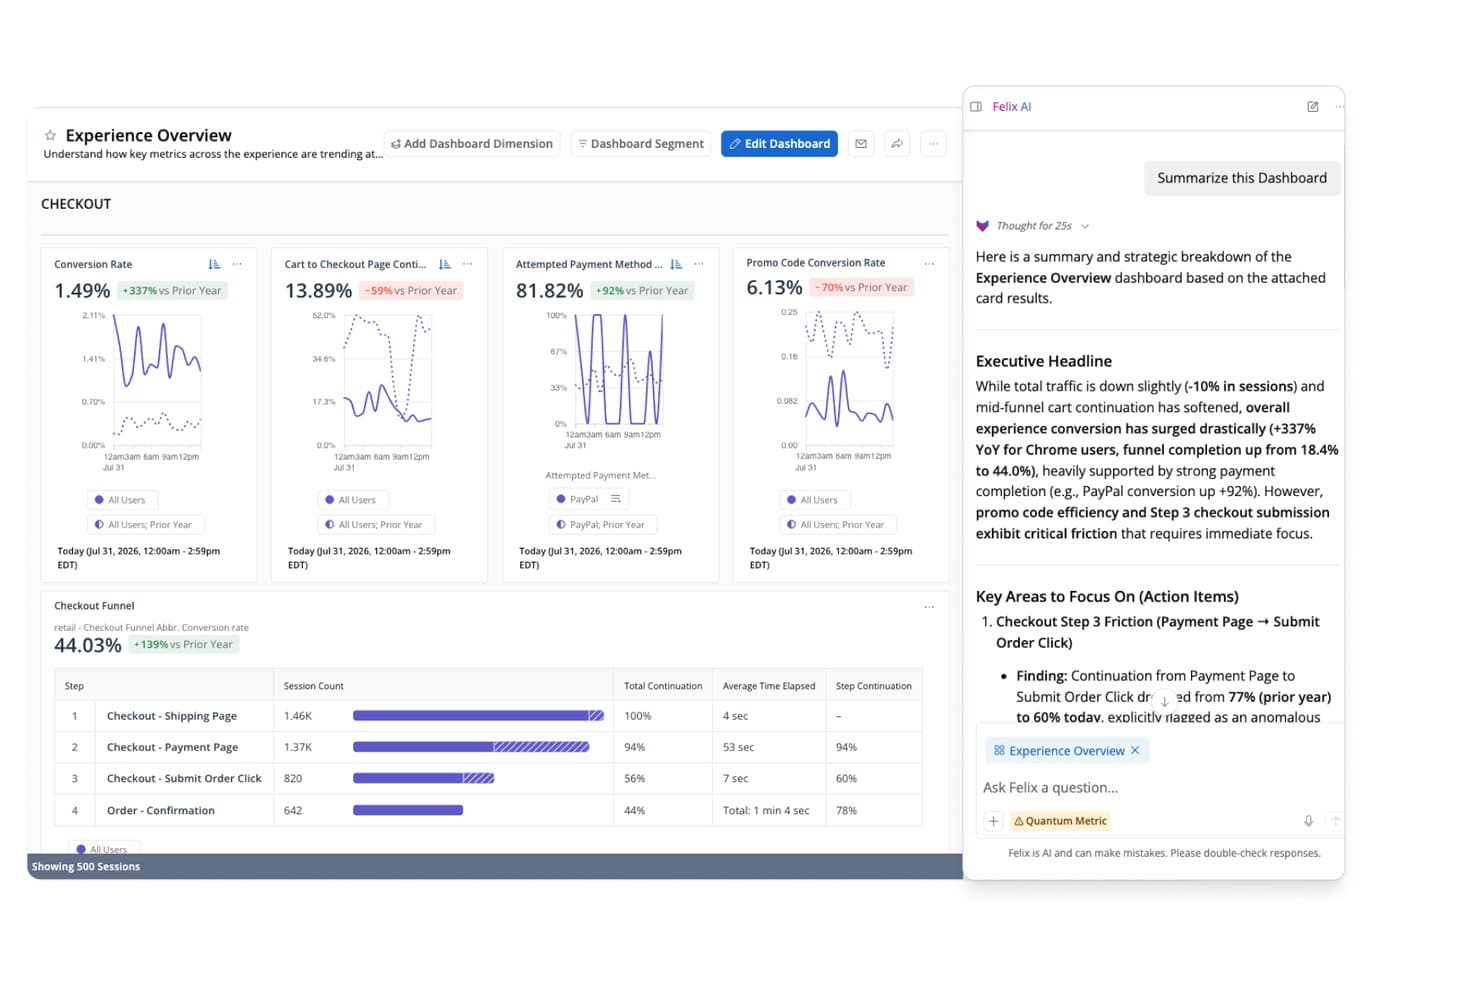
Quantum Metric's AI summarizes checkout funnel friction points instantly. Quantum Metric is a digital experience analytics platform that captures unsampled session replay, interaction heatmaps, user journey mapping, and AI-powered friction detection across web, mobile, and kiosk touchpoints.
Who Is Quantum Metric Best For?
Quantum Metric is built for product managers and digital teams at mid-to-large enterprises who need to tie UX friction directly to revenue impact.
Why I Picked Quantum Metric
Quantum Metric earns its spot on my shortlist because its Opportunity Analysis does something I haven't seen matched elsewhere: it automatically ranks UX friction by revenue impact, so you walk into any stakeholder meeting already knowing which checkout drop-off or error loop is costing the most. I also like that every friction signal, whether a rage click, dead click, or abandonment, links directly to an unsampled session replay, giving you the evidence to back the fix. Felix AI agents run in the background monitoring funnel KPIs continuously, surfacing root-cause explanations without waiting for someone to go looking.
Quantum Metric Key Features
- Unsampled session replay: Captures 100% of user sessions across web, mobile, and kiosk, with every replay linked directly to heatmap and journey data.
- Journey path analysis: Automatically maps user paths in real time, showing friction points, errors, and top interactions at each step across platforms.
- Behavior-triggered VoC surveys: Launches surveys based on specific user actions, such as abandonment or hesitation, and ties every response back to its session replay.
- Scheduled dashboard reports: Sends customizable dashboard snapshots by email on a daily, weekly, or monthly cadence to any recipient, no login required.
Quantum Metric Integrations
Quantum Metric integrates with Adobe Experience Platform, Optimizely, Slack, Jira, ServiceNow, Salesforce, and Google BigQuery. It also offers data streaming, a REST API, and connections across Microsoft Teams, PagerDuty, and other documented platforms.
Pros and Cons
Pros:
- Captures journeys across web, mobile, kiosks
- Links friction signals to unsampled replays
- Ranks UX friction by revenue impact
Cons:
- Enterprise setup exceeds one-off audit needs
- Lacks heuristic checklists and usability testing
Learn more about Quantum Metric: Best for multi-device UX testing across global panels
- Free demo available
- From $699/month (billed annually)
Visit WebsiteCustomer Rating:4.5/5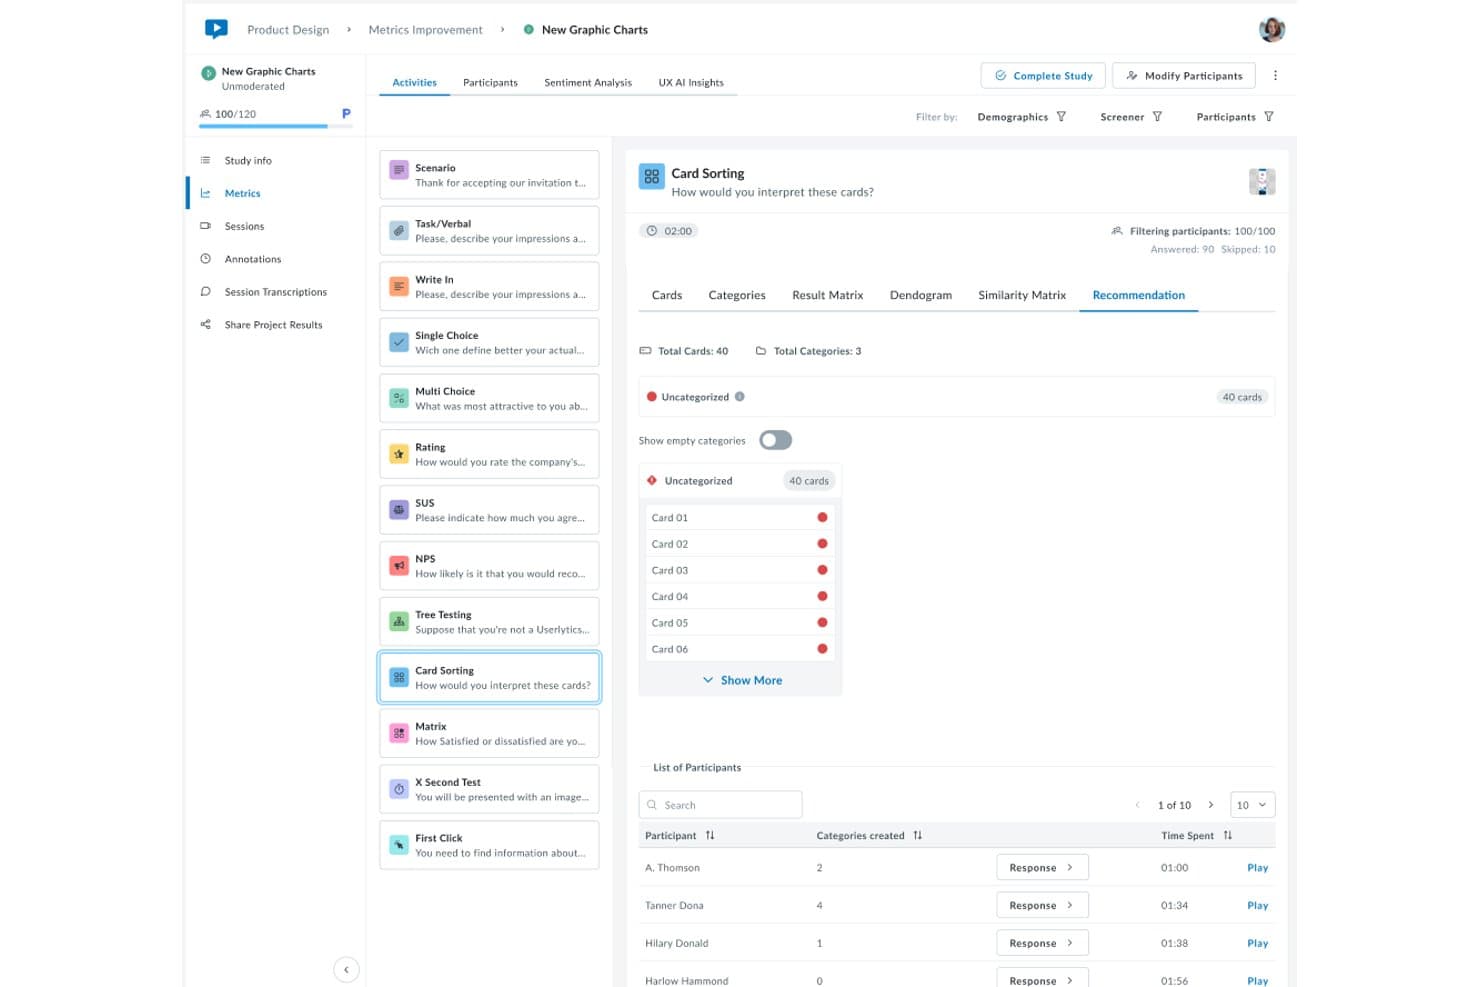
Userlytics surfaces card sorting recommendations to guide UX improvements. Userlytics is a remote user testing platform that supports moderated and unmoderated studies, session recording, heatmaps, card sorting, tree testing, and AI-driven analysis across web, mobile, and prototype environments.
Who Is Userlytics Best For?
Userlytics is a strong fit for UX researchers and product teams running structured, panel-based usability studies across web, mobile, and prototype environments worldwide.
Why I Picked Userlytics
I picked Userlytics as one of the best because its 2M+ participant panel spanning 150+ countries makes it genuinely hard to match when you need structured usability studies across device types and global markets. I love that session recordings capture screen, webcam, and audio on web, mobile apps, and prototypes simultaneously. The ULX Benchmarking Score also lets me track design quality across 18 attributes before and after launch, which grounds audit findings in consistent, comparable data.
Userlytics Key Features
- AI Annotations: Automatically identifies key moments across test sessions and compiles them into timestamped, sentiment-tagged video compilations linked to raw recordings.
- Card sorting and tree testing: Structured information architecture methods, including a dendrogram tool, that reveal how users categorize and navigate content.
- Moderated live conversation sessions: A researcher guides participants through tasks in real time over a live video call, with sessions recorded up to 60 minutes.
- Advanced screener questions: Demographic filters and custom screener logic let you target precise participant profiles before a study launches.
Userlytics Integrations
Userlytics has a native Figma integration and supports integrations with Adobe XD, Axure, Framer, InVision, and Sketch.
Pros and Cons
Pros:
- AI insights link findings to sessions
- Structured methods benchmark usability decisions
- Global panel supports multi-device research
Cons:
- Participant quality can occasionally slip
- No live-traffic behavior analytics
Learn more about Userlytics: 4Best for friction detection tied to funnel drop-offs
VWO
- 30-day free trial + free demo available
- Pricing upon request
Visit WebsiteCustomer Rating:4.3/5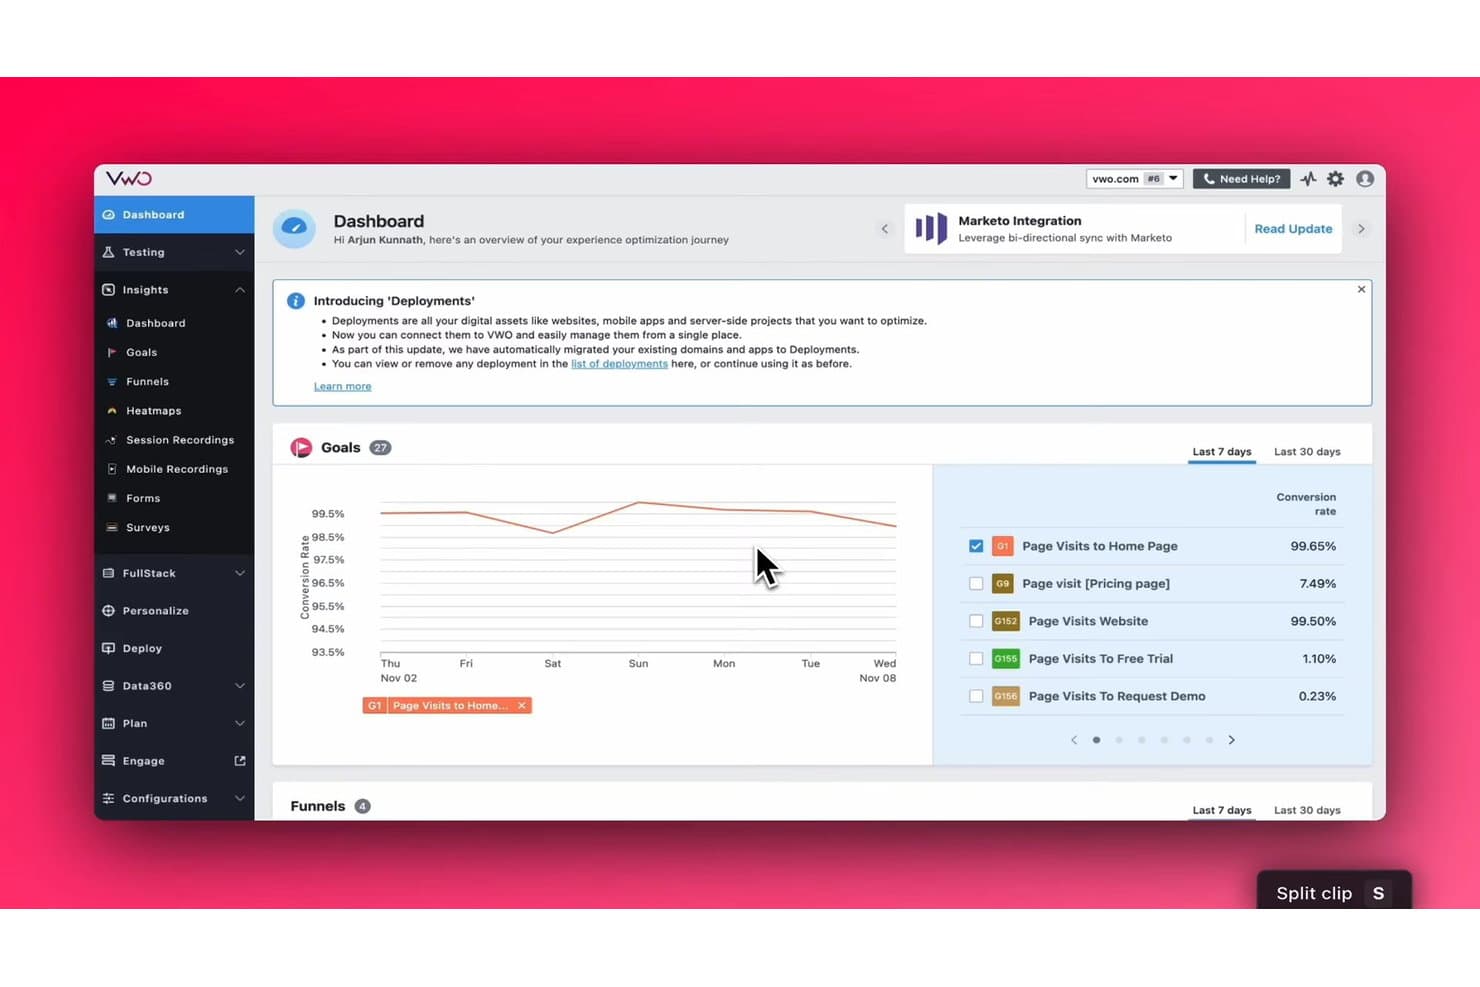
VWO tracks goal conversion rates across your site in one dashboard. VWO (now Wingify) is a behavior analytics and experimentation platform that combines session recordings, heatmaps, frictionmaps, funnel analytics, form analytics, and on-page surveys to help you identify usability issues and drop-off points across web and mobile experiences.
Who Is VWO Best For?
VWO (now Wingify) is a strong fit for CRO teams and digital product managers who need to connect behavioral data directly to funnel performance.
Why I Picked VWO
I picked VWO (now Wingify) as one of the best because its frictionmap ties rage clicks, dead clicks, and error clicks directly to funnel drop-off data, so you're not guessing where users struggle. I love that you can drill into any funnel step and instantly pull up session recordings or heatmaps filtered to visitors who dropped off at that exact point. The AI-powered recording summaries then surface usability patterns and next steps without requiring hours of manual review.
VWO Key Features
- AI recording summaries: Wingify's AI generates mini and full summaries of individual sessions, covering pages visited, likely intent, usability patterns, and recommended next steps.
- Form analytics: Per-field data shows interaction time, hesitation time, refill rate, ignored rate, and drop-off rate to pinpoint exactly where users abandon forms.
- Jira backlog sync: Observations and hypotheses logged inside any analytics tool can be pushed directly to Jira as tickets, including linked session recordings.
- Cross-platform behavior capture: A lightweight mobile SDK for iOS, Android, Flutter, and React Native lets you capture and review web and app behavior in one shared dashboard.
VWO Integrations
VWO (now Wingify) offers documented integrations with Jira, Google Analytics 4, Adobe Analytics, Mixpanel, Amplitude, Microsoft Clarity, FullStory, and Segment. An Enterprise REST API supports custom integrations.
Pros and Cons
Pros:
- Combines recordings, heatmaps, forms, and surveys
- AI summaries reduce manual recording review
- Frictionmaps connect errors to funnel drop-offs
Cons:
- Lacks moderated and unmoderated usability testing
- No native heuristic checklist or scorecard
Learn more about VWO: Best for AI-grouped replay insights from surveys
- 14-day free trial + free plan available
- From $175/month (billed annually)
Visit WebsiteCustomer Rating:4.5/5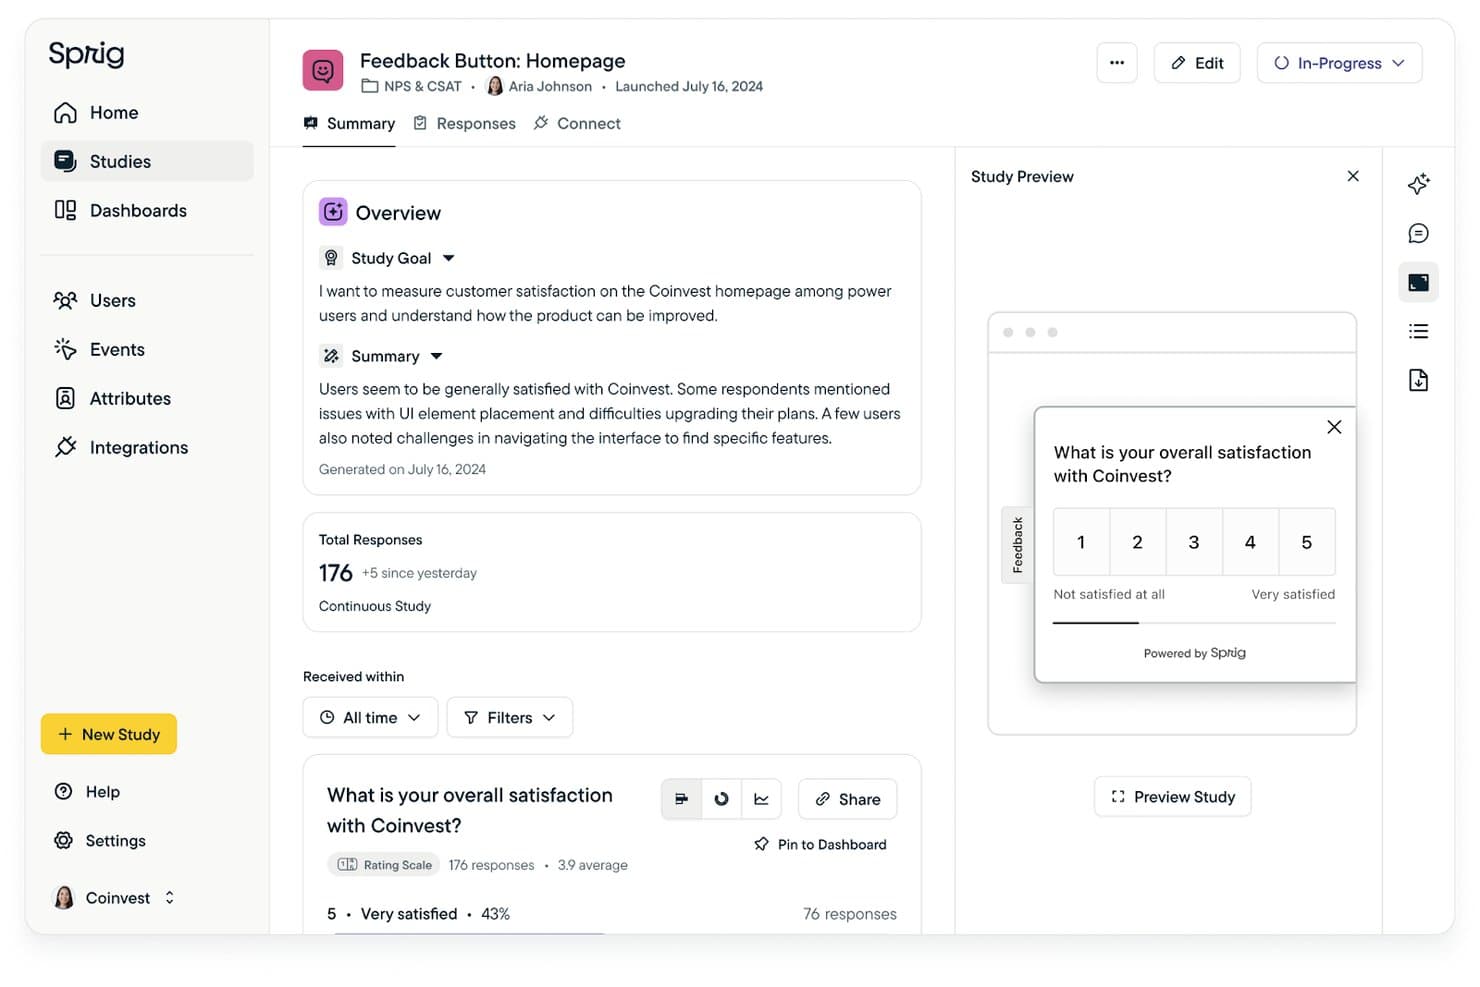
Sprig surfaces AI-generated summaries from user feedback surveys. Sprig is an enterprise survey and research platform that combines in-product surveys, session replays, heatmaps, and AI-assisted analysis to capture both behavioral and attitudinal user data.
Who Is Sprig Best For?
Sprig is a strong fit for enterprise product teams that run ongoing in-product research and want behavioral context—replays, heatmaps, and frustration signals—tied directly to survey and feedback data.
Why I Picked Sprig
I picked Sprig as one of the best because its AI Replay Analysis automatically groups session clips into behavior themes, like "Navigational Confusion" or "Pricing Page Dropoff," so I'm not manually scrubbing through recordings to find patterns. What makes this especially useful for UX audits is that those replay clusters attach directly to survey responses, giving me behavioral context around the exact moment a user answered. The Synthesize Agent then turns those linked insights into editable, stakeholder-ready reports with themes, response counts, and recommendations.
Sprig Key Features
- Behavior-triggered surveys: Surveys fire automatically at specific in-product moments, like flow completion or abandonment, to capture feedback exactly when friction occurs.
- Built-in research panel: Access B2B and B2C participants across dozens of countries using 300+ targeting attributes, screening questions, and automatic incentive handling.
- Design Agent: Builds survey studies from a plain-language brief, checks logic for broken branches, and flags leading or unclear questions before you launch.
- Prototype task testing: Participants complete tasks inside embedded interactive prototypes while Sprig captures screen activity, navigation patterns, and drop-off moments.
Sprig Integrations
Sprig offers documented integrations with Figma, Miro, Dovetail, Notion, Mixpanel, Amplitude, Segment, Optimizely, LaunchDarkly, and User Interviews. It also supports a public API, Data Export API, webhooks, and Zapier.
Pros and Cons
Pros:
- Captures feedback across web and mobile
- AI groups replay clips into behavior themes
- Links replay evidence to survey responses
Cons:
- Friction signals remain web-only beta features
- Offers no heuristic audit checklists
 Best for QXscore benchmarking across releases
- Free demo available
- Pricing upon request
Visit WebsiteCustomer Rating:4.5/5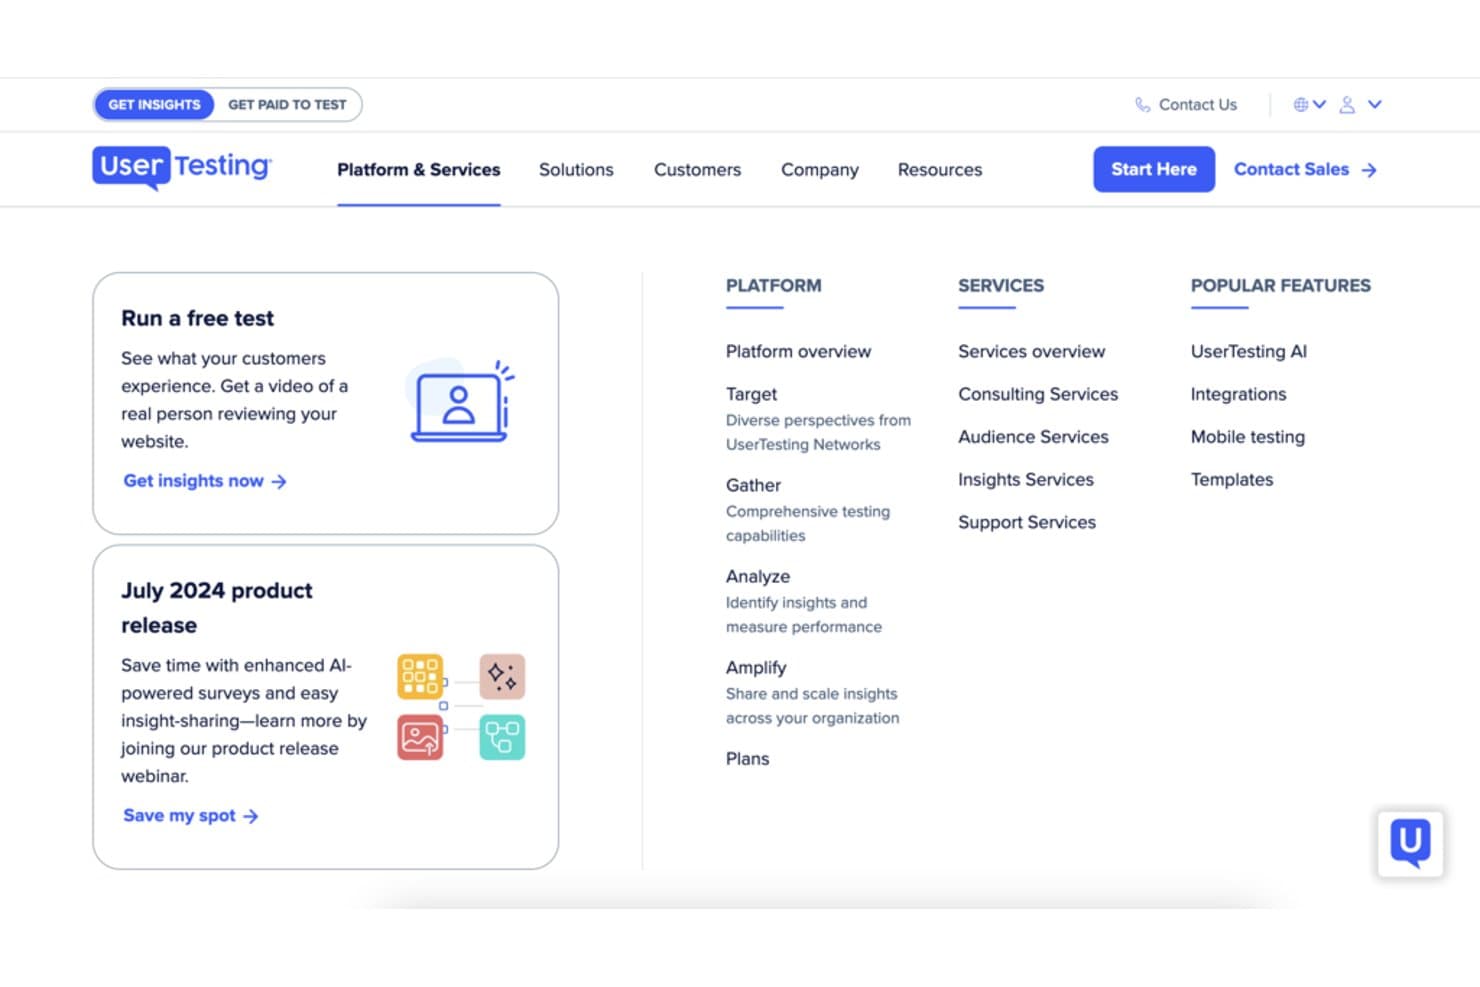
UserTesting offers platform tools to gather and analyze user insights. UserTesting is a user research and experience testing platform that combines unmoderated think-out-loud tests, moderated live interviews, QXscore benchmarking, card sorting, tree testing, and AI-powered insight analysis.
Who Is UserTesting Best For?
UserTesting is a strong fit for UX researchers and CRO consultants who need to benchmark experience quality across product releases and deliver structured, evidence-backed findings to stakeholders.
Why I Picked UserTesting
UserTesting earns its spot on my shortlist because QXscore gives UX teams a standardized 0–100 benchmark they can track across every release cycle. I love how it combines behavioral signals (task success rates) with attitudinal measures like trust and NPS into a single score, so you're not choosing between what users do and what they say. Banco Sabadell, for example, gates releases on hitting a QXscore of at least 85—that's exactly the kind of structured, repeatable audit process I think most teams should be running.
UserTesting Key Features
- Interactive Path Flows: Visualizes the paths users take through your site or prototype, layered with sentiment and intent data to show where and why users struggle.
- Live Conversations: Moderated video interviews with your own customers or the UserTesting panel, with automatic scheduling, hidden observers, and clip annotation built in.
- Insights Hub: A collaborative workspace for building shareable Insights Reports with simultaneous editing, comments, and AI-powered theme discovery across studies.
- Card sorting and tree testing: Structured information architecture methods for evaluating navigation and content hierarchy, available on Ultimate edition and above.
UserTesting Integrations
UserTesting integrates with Figma, Jira, Jira Product Discovery, Trello, Slack, Microsoft Teams, Contentsquare, FullStory, Quantum Metric, and Qualtrics. An open API supports custom integrations.
Pros and Cons
Pros:
- Produces shareable clips and collaborative reports
- Combines observed behavior and stated sentiment
- QXscore benchmarks releases with one metric
Cons:
- Native mobile gestures escape path analysis
- Tests miss continuous production-traffic behavior
Learn more about UserTesting: Best for behavior capture with AI-driven summaries
- Free plan + 15-day free trial + free demo available
- From $49/month
Visit WebsiteCustomer Rating:4.5/5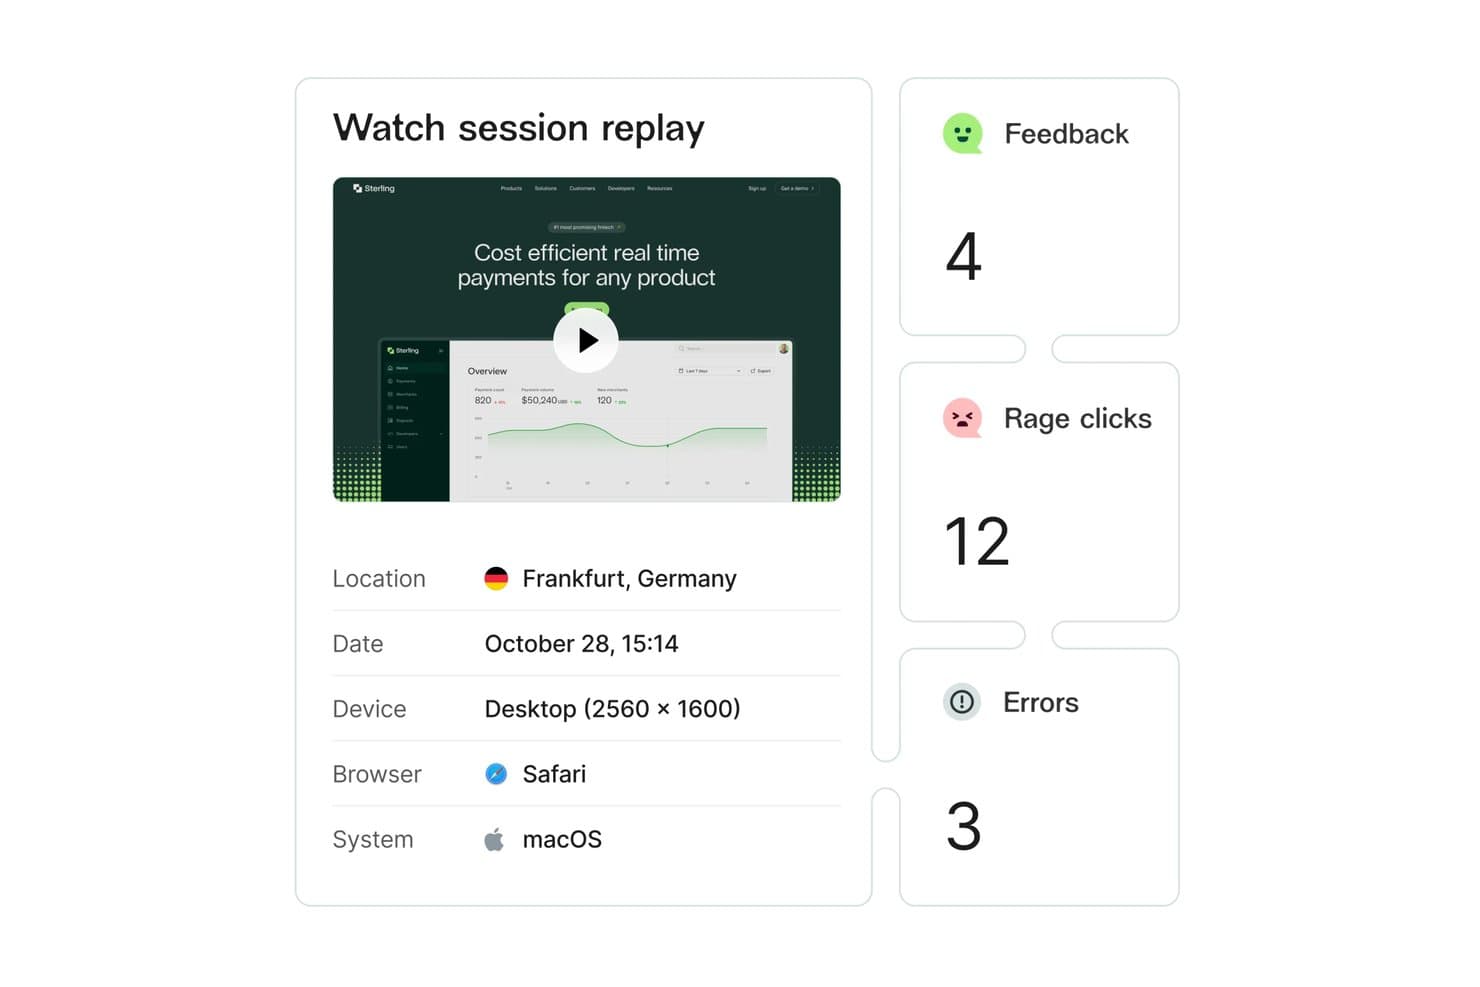
Hotjar lets users replay sessions with rage clicks and error data. Hotjar (by Contentsquare) is a behavior analytics platform that combines heatmaps, session replay, funnel analysis, journey mapping, and voice-of-customer surveys with AI-powered insight summaries.
Who Is Hotjar (by Contentsquare) Best For?
Hotjar is a strong fit for UX researchers and digital marketers who need to connect behavioral data—heatmaps, session replay, and funnel drop-offs—with direct user feedback in one place.
Why I Picked Hotjar (by Contentsquare)
I picked Hotjar as one of the best because its AI-powered Sense feature does something I genuinely find useful: it summarizes heatmaps and session recordings automatically, so you're not manually scrubbing through hours of footage to find friction. Frustration Score goes further by ranking rage clicks and repeated field attempts by their actual impact on conversion, which means I can prioritize what to fix first without guessing.
Hotjar (by Contentsquare) Key Features
- Voice of customer surveys: Deploy NPS, exit-intent, and concept-testing surveys with AI-generated summaries and sentiment analysis linked directly to user sessions.
- Funnel analysis: Map multi-step conversion funnels to pinpoint exactly where users drop off before completing a goal.
- Highlights and Collections: Clip moments from session recordings and group them into shareable collections for team review and stakeholder presentations.
- Backlog integrations: Create issues in Jira, Linear, Asana, or Trello directly from recordings, survey responses, or highlights without leaving the platform.
Hotjar (by Contentsquare) Integrations
Hotjar (by Contentsquare) offers 100–120+ documented integrations, including Google Analytics, Adobe Analytics, Optimizely, Segment, Mixpanel, Slack, Jira, Linear, Asana, and Trello. It also supports API access and Zapier for custom connectivity.
Pros and Cons
Pros:
- Links survey feedback to user sessions
- Frustration scores prioritize conversion-impacting issues
- AI summarizes recordings and heatmaps
Cons:
- Reviewing large recording volumes takes time
- Lacks built-in heuristic audit scorecards
Learn more about Hotjar (by Contentsquare): Best for AI-ranked friction signals by revenue impact
- Free plan available
- Pricing upon request
Visit WebsiteCustomer Rating:4.5/5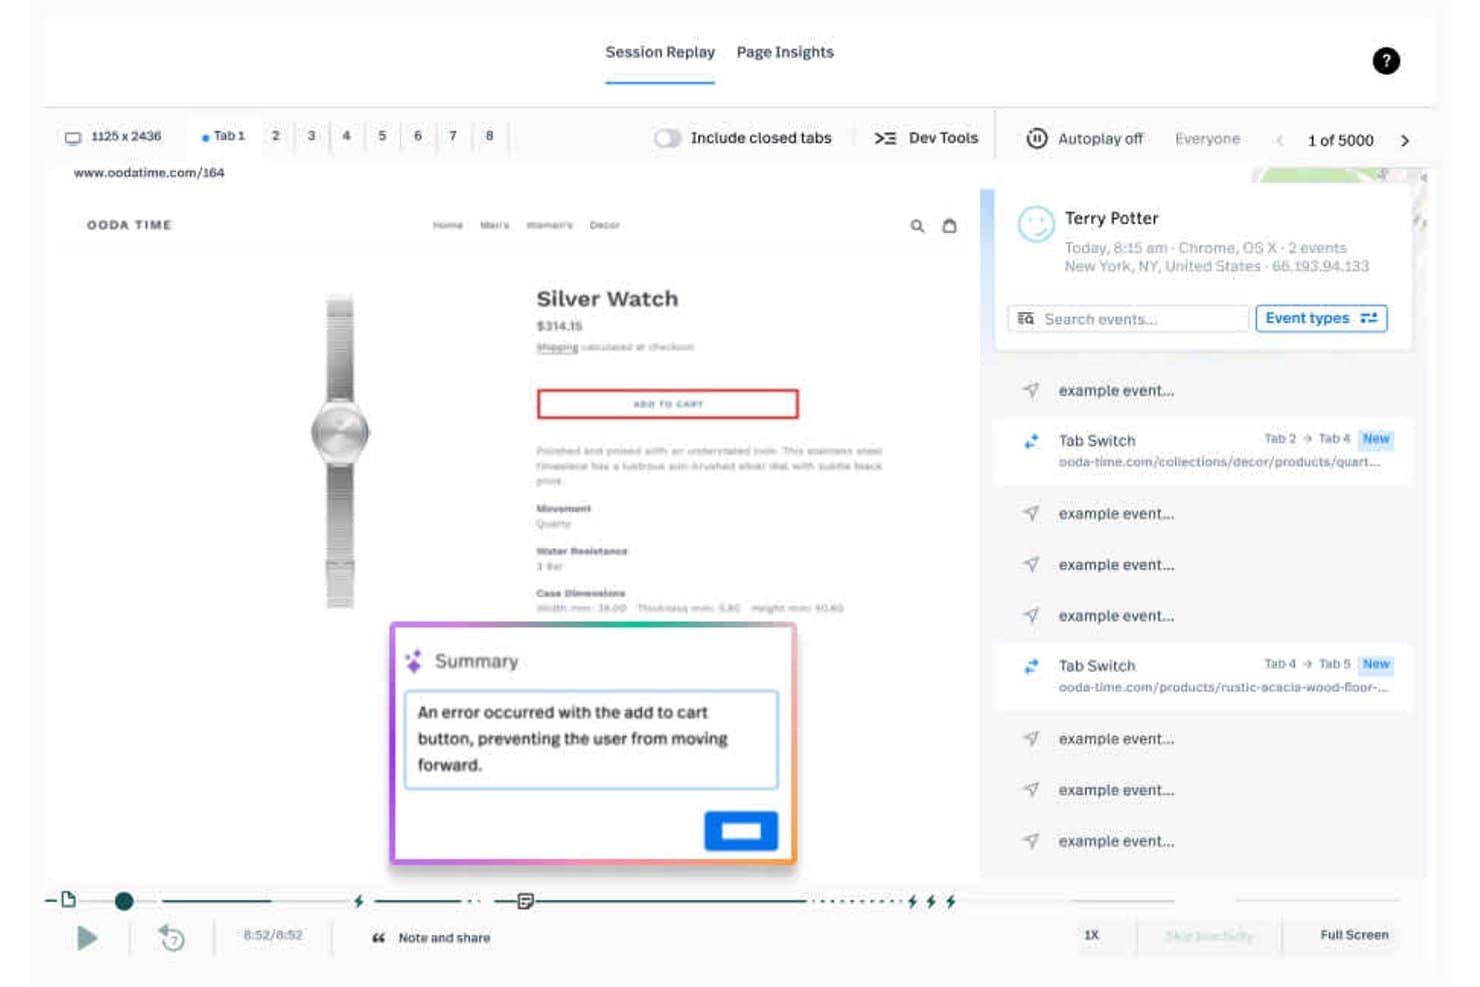
Fullstory surfaces session replay errors to pinpoint UX issues instantly. Fullstory is a digital experience analytics platform that captures user behavior through session replay, heatmaps, funnels, journey maps, and AI-powered frustration signal detection across web and mobile.
Who Is Fullstory Best For?
Fullstory is a strong fit for UX researchers and digital marketers on mid-size to enterprise teams who need to pinpoint and prioritize friction by its revenue cost.
Why I Picked Fullstory
I picked Fullstory as one of the best because its StoryAI Opportunities feature does something I haven't seen elsewhere: it ranks friction points by estimated revenue impact, so you're not guessing which usability issue to fix first. Rage clicks, dead clicks, and abandoned form signals are automatically surfaced and tied to conversion loss. I also like that heatmaps can overlay revenue and AOV data directly onto page elements, turning visual behavior data into a business case.
Fullstory Key Features
- Session replay with AI summaries: Fullstory records real user sessions and generates one-click AI summaries that explain exactly what each user did during their visit.
- Journey maps: Machine learning identifies the most common paths users take through your product, surfacing unexpected routes and drop-off patterns across web and mobile.
- Guides & Surveys: A paid add-on that lets you deploy in-app NPS surveys and multi-page surveys tied directly to session replays, so you can see what users said alongside what they did.
- Privacy-by-default masking: Sensitive data is masked on the user's device before it ever leaves the browser or app, with masked elements replaying as wireframes during session playback.
Fullstory Integrations
Fullstory integrates with Jira Cloud, Slack, Microsoft Teams, Trello, Mixpanel, Google Analytics, Segment, Tealium, Adobe Analytics, and Google Tag Manager. Its webhooks, open API, and warehouse exports support custom integrations and UX audit reporting.
Pros and Cons
Pros:
- Time-stamped notes support audit collaboration
- Cross-platform session replay captures behavior deeply
- AI ranks friction by revenue impact
Cons:
- No moderated task-based usability testing
- No heuristic checklist or audit scorecard
Learn more about Fullstory: Best for heatmaps with built-in A/B testing
- 30-day free trial available
- From $29/month
Visit WebsiteCustomer Rating:4.3/5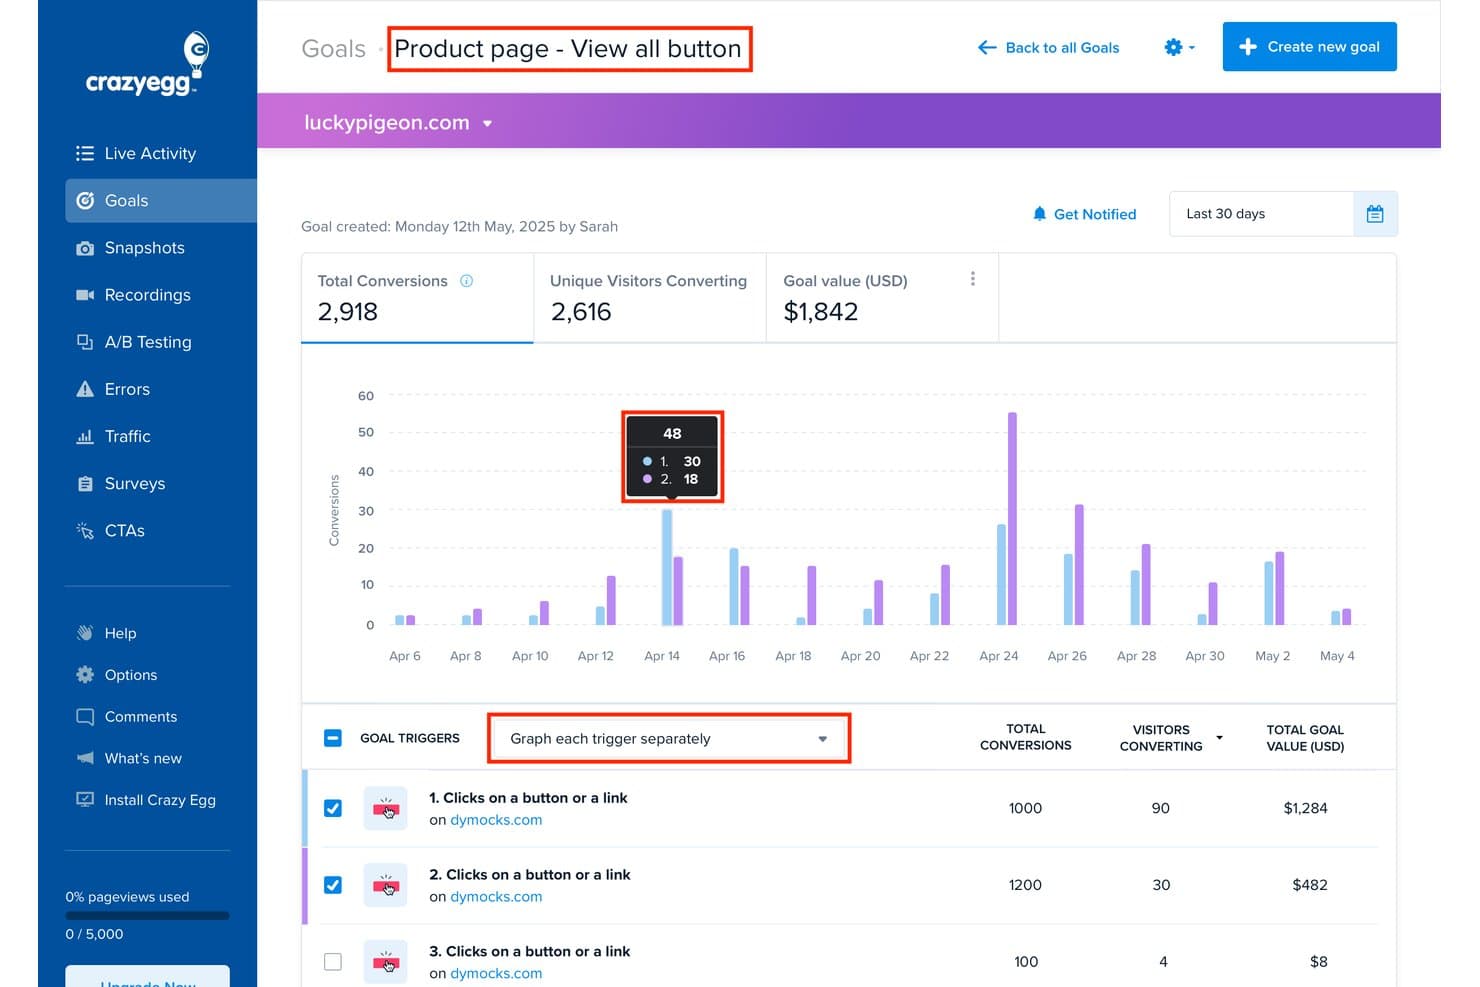
Crazy Egg tracks goal conversions and trigger performance by date. Crazy Egg is a behavioral analytics and UX audit tool that combines five heatmap types, session recordings, funnel analysis, surveys, A/B testing, and AI-driven insights in one platform.
Who Is Crazy Egg Best For?
Crazy Egg is a strong fit for CRO consultants, digital marketers, and UX researchers who need behavioral data—heatmaps, recordings, and A/B testing—across multiple client sites without paying per seat.
Why I Picked Crazy Egg
Crazy Egg earns its spot on my shortlist because its heatmap suite goes deeper than most tools I've tested, giving you five distinct report types including Confetti, which color-codes every click by traffic source, UTM, device, or 20+ other audience attributes. What really sets it apart is that A/B testing is built directly into the same platform, so when a heatmap reveals a dead-click zone or an ignored CTA, I can build and run a variant without switching tools. The AI Tasks feature then closes the loop by reading across your heatmaps, recordings, and funnels to generate a prioritized PDF report and queue up tests for your approval.
Crazy Egg Key Features
- Session recording tags: Automatically flags sessions with rage clicks, dead clicks, JavaScript errors, slow loading, form abandons, and more for quick friction identification.
- Funnel reports: Drag-and-drop conversion funnels track drop-off at each step and let you filter linked recordings to sessions where visitors did or didn't convert.
- Popup surveys: Fully customizable surveys with 50+ templates, branching logic, and multiple trigger options including exit intent, scroll depth, and time on page.
- Error tracking: Captures JavaScript errors with full stack traces, linked session recordings, and device and browser context, available on Plus plans and above.
Crazy Egg Integrations
Crazy Egg has documented integrations with Google Analytics 4, Google Tag Manager, Shopify, WordPress, Segment, Google, Meta, and TikTok. It also offers an API for custom integrations and supports Zapier.
Pros and Cons
Pros:
- Surveys connect feedback to recordings
- Rage-click tags expose friction quickly
- Five heatmap views reveal interaction patterns
Cons:
- Recording caps can pause data collection
- No heuristic checklist supports formal audits
Learn more about Crazy Egg: 10Best for prototype-to-live-site usability testing
Maze
- Free plan + free demo available
- Pricing upon request
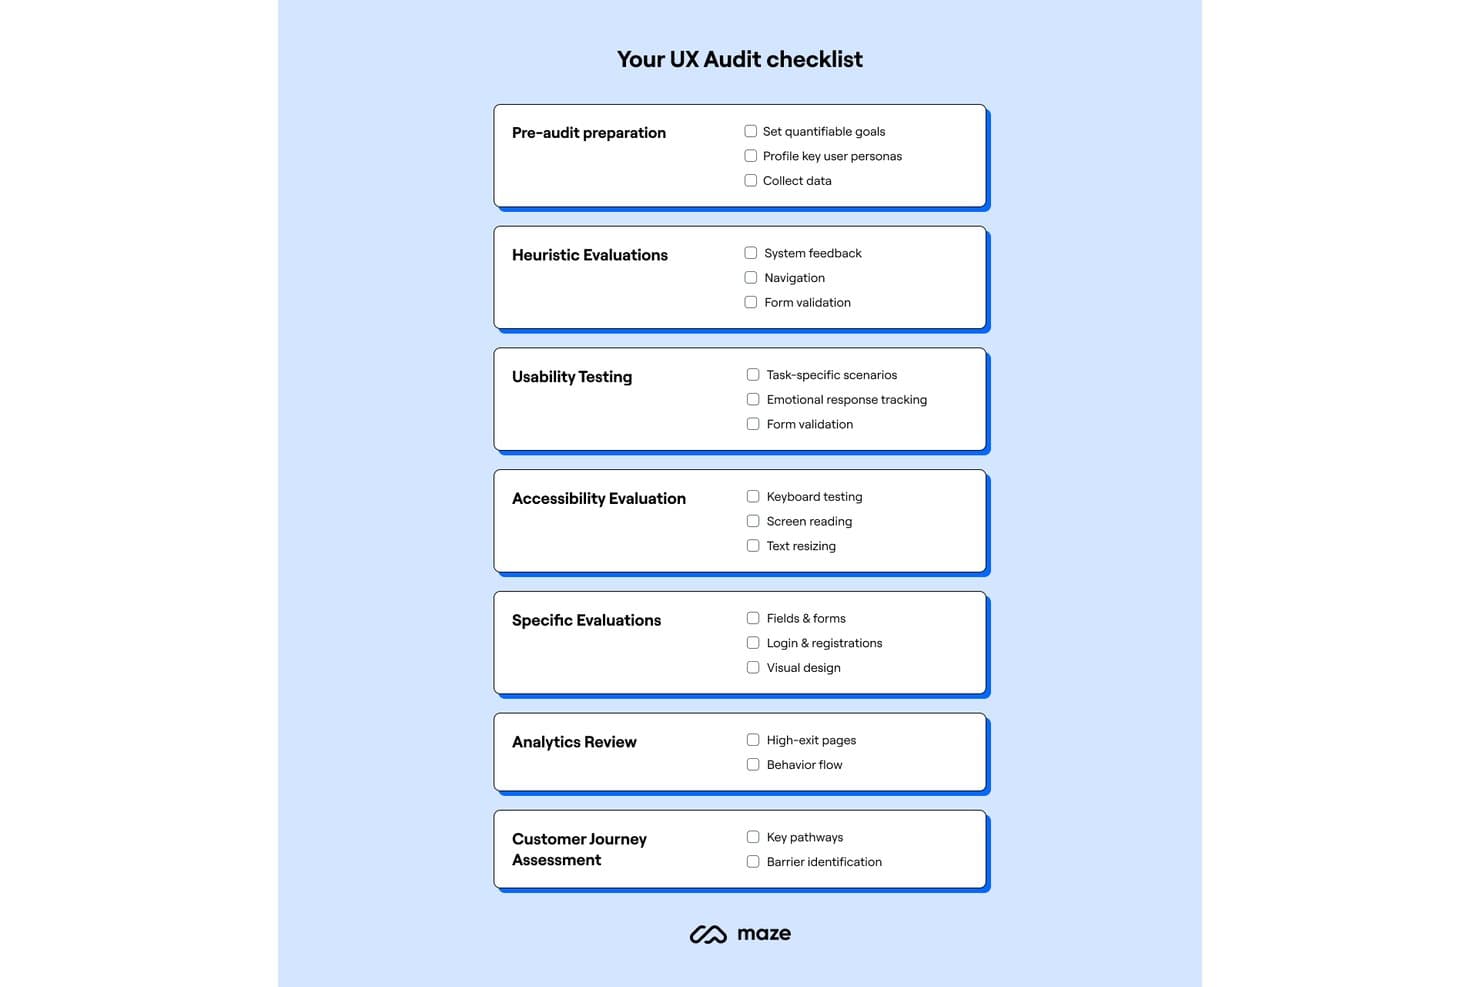
Maze provides a structured UX audit checklist across seven key areas. Maze is a user research platform that combines task-based usability testing, prototype testing, heatmaps, path analysis, session recordings, and AI-synthesized findings across prototypes, live websites, and mobile apps.
Who Is Maze Best For?
Maze is a strong fit for UX researchers and CRO consultants who need to test designs from early prototype all the way through to a live site without switching tools.
Why I Picked Maze
Maze earns its spot on my shortlist because it's the only research platform I've found that measures usability on live websites the same way it does on prototypes. I love that you can define a "successful path" through a real sign-up flow, then see exactly where participants deviate, with heatmaps and mission path analysis surfacing the friction. Prototype-to-live-site continuity means you're running the same task-based methodology from early Figma screens through to your shipped product, without rebuilding your research setup.
Maze Key Features
- AI-moderated interviews: Maze's AI moderator runs live interviews autonomously, checks 25 quality metrics per conversation, supports multiple languages, and accepts up to 5 images as stimuli.
- In-product prompts: Deploy NPS, CSAT, and product-market-fit surveys as targeted pop-ups on your live site, triggered by URL rules or Amplitude cohorts.
- Card sorting and tree testing: Run open and closed card sorts alongside tree tests to evaluate your information architecture directly within the platform.
- Built-in research panel: Access a panel of 6M+ participants across 150+ countries with 400+ demographic filters, with panel incentives included in credit pricing.
Maze Integrations
Maze offers native integrations with Figma, Axure, Miro, FigJam, Jira, Confluence, Notion, Slack, and Amplitude. It also supports prototype workflows with Figma Make.
Pros and Cons
Pros:
- Built-in panel accelerates participant recruitment
- Heatmaps pair with mission-path analysis
- Prototype-to-live-site testing in one workflow
Cons:
- Reports offer limited slide customization
- No built-in heuristic scoring framework
Learn more about Maze:
Outras ferramentas de auditoria UX
Eis algumas opções adicionais de ferramentas de auditoria UX que não entraram na minha lista restrita, mas que ainda vale a pena consultar:
- 11QualtricsBest for linking survey feedback to session data
- 12UserZoomBest for enterprise UX benchmarking over time
- 13MixpanelBest for funnel drop-off to replay in one click
- 14InspectletBest for five-mode heatmaps with AI triage
- 15PendoBest for PM-led behavior audits with in-app feedback
- 16MouseflowBest for seven-heatmap behavior audits
- 17Optimal WorkshopBest for IA research with automated visual analysis
- 18ContentsquareBest for AI-driven behavior analytics at scale
- 19Loop11Best for no-code competitor usability audits
How I Evaluate UX Audit Tools
I split my evaluation into three parts, giving the most weight to core functionality: capture real interactions, pinpoint friction or drop-offs, and collect user feedback. Next, I look for standout features such as journey maps. Finally, I weigh onboarding, support, and pricing value beyond the feature set.
Core Functionality (Table Stakes For This List)
When I'm selecting tools for my list, I score each one on a scale from 0 (does not offer the functionality) to 5 (excels in this area) for each core functionality listed below. I then convert the total into a percentage to help assess each tool's overall fit, with extra weight on any functionalities I’ve deemed essential.
- Behavior Capture (Essential): I look for recordings, heatmaps, or journey data that reveal how users interact with key flows across devices.
- Friction Identification (Essential): I check whether teams can locate drop-offs, errors, and dead clicks in journeys like signup or checkout, with context to investigate causes.
- Structured Evaluation: I assess support for repeatable audits, such as heuristic checklists, task-based tests, or scorecards for comparing design changes.
- Audit Reporting: I look for clear, shareable reports that organize findings and evidence for design reviews and product prioritization.
- User Feedback: I evaluate whether teams can collect targeted survey responses or test feedback tied to specific pages, tasks, or user segments.
Once I have a list of tools that meet the criteria, I consider what sets each platform apart.
Differentiating Factors (What Sets Vendors Apart)
Here's how I compare and contrast different vendors:
Standout Features
Journey and funnel visualization is where I start. I look for tools that map multi-step flows and flag exact drop-off screens, so product teams can prioritize fixes by impact rather than guesswork. AI-powered insights matter too—I check whether a tool can surface friction patterns from session data without hours of manual review. Beyond analysis, I evaluate roadmap and backlog sync: tools like Hotjar or FullStory that push flagged issues into Jira or Linear help teams act on findings faster instead of losing them in a slide deck.
Beyond Features
I check how each tool handles PII in session recordings—masking and redaction matter when your flows capture payment or health data, and GDPR or CCPA compliance gaps can stall a rollout fast. Time-to-insight is another factor I evaluate closely: tools with pre-built heuristic templates and real-time reporting let teams flag issues during a launch week instead of waiting on batch-processed data. I also look at pricing flexibility, since a solo consultant running a one-off audit needs a very different plan structure than an enterprise team monitoring multiple products continuously.
Como escolher ferramentas de auditoria UX
É fácil perder-se em longas listas de funcionalidades e estruturas de preços complexas. Para o ajudar a manter o foco enquanto trabalha no seu processo único de seleção de software, eis uma lista de fatores a ter em conta:
| Fator | O que considerar |
| Escalabilidade | Certifique-se de que a ferramenta pode acompanhar o crescimento das necessidades da sua empresa, suportando volumes de dados crescentes e mais utilizadores sem comprometer o desempenho. |
| Integrações | Verifique se a ferramenta se integra com o seu conjunto de software existente, como o Google Analytics, sistemas de CRM e ferramentas de colaboração como o Slack. |
| Personalização | Procure opções que permitam adaptar a ferramenta aos seus fluxos de trabalho e necessidades de elaboração de relatórios específicos, garantindo que se integra nas suas operações. |
| Facilidade de utilização | Avalie se a interface da ferramenta é intuitiva. A sua equipa deve conseguir navegar e utilizar a ferramenta eficazmente, com um mínimo de formação. |
| Orçamento | Avalie o custo total, incluindo taxas de configuração e valores das subscrições. Escolha uma ferramenta que ofereça a melhor relação qualidade-preço dentro das limitações do seu orçamento. |
| Medidas de segurança | Confirme se a ferramenta dispõe de medidas sólidas de proteção de dados, como encriptação e conformidade com regulamentos como o RGPD, para proteger os dados dos utilizadores. |
| Suporte | Tenha em conta a qualidade e a disponibilidade dos serviços de apoio ao cliente, incluindo chat em direto, apoio telefónico e acesso a uma base de conhecimento para resolução de problemas. |
| Conjunto de funcionalidades | Identifique as funcionalidades essenciais de que necessita, como mapas de calor, reproduções de sessões e recolha de feedback, garantindo que estão alinhadas com os seus objetivos. |
Tendências nas ferramentas de auditoria de UX
Na minha investigação, consultei inúmeras atualizações de produtos, comunicados de imprensa e registos de lançamento de diferentes fornecedores de ferramentas de auditoria de UX. Eis algumas das tendências emergentes que estou a acompanhar:
- Colaboração em tempo real: Cada vez mais ferramentas permitem que as equipas trabalhem em conjunto em tempo real, possibilitando uma tomada de decisões mais rápida e ciclos de feedback mais dinâmicos. Esta tendência melhora o trabalho em equipa e ajuda a detetar problemas numa fase inicial do processo de design.
- Análise preditiva: Os fornecedores estão a integrar análises preditivas para antecipar o comportamento dos utilizadores e potenciais problemas. Esta tendência ajuda as equipas a responder proativamente às necessidades dos utilizadores e a melhorar a experiência do utilizador antes de surgirem problemas.
- Análise de voz e gestos: À medida que as interações por voz e gestos se tornam mais comuns, as ferramentas estão a expandir-se para analisar estes novos comportamentos dos utilizadores. Esta tendência ajuda as equipas a compreender como os utilizadores interagem com interfaces ativadas por voz e sem contacto, oferecendo novos conhecimentos.
- Utilização ética dos dados: Existe um foco crescente na recolha ética de dados e na privacidade. As ferramentas disponibilizam agora mais funcionalidades que asseguram a conformidade com as leis de proteção de dados, garantindo a confiança dos utilizadores e a segurança dos dados.
- Painéis de relatórios personalizados: Os utilizadores exigem maior controlo sobre a forma como os dados são visualizados. As ferramentas oferecem painéis personalizáveis que permitem às equipas adaptar os relatórios para destacar as métricas mais relevantes, melhorando os processos de tomada de decisões.
O que são ferramentas de auditoria de UX?
As ferramentas de auditoria de UX são soluções de software que ajudam a analisar e a melhorar a experiência do utilizador em plataformas digitais. Estas ferramentas são normalmente utilizadas por designers de UX, gestores de produto e profissionais de marketing para identificar problemas de usabilidade e aumentar o envolvimento dos utilizadores. Os mapas de calor, as reproduções de sessões e as funcionalidades de recolha de feedback ajudam a compreender o comportamento dos utilizadores e a tomar decisões de design fundamentadas. De um modo geral, estas ferramentas fornecem informações valiosas que conduzem a melhores experiências do utilizador e a uma maior satisfação dos clientes.
Funcionalidades das ferramentas de auditoria de UX
As ferramentas de auditoria de UX adequadas podem revelar problemas de usabilidade e ajudar a melhorar a experiência do seu produto digital. Eis as principais funcionalidades a procurar:
- Mapas de calor: acompanhe onde os utilizadores clicam, deslocam a página e movem o cursor na sua interface de utilizador para compreender o envolvimento e identificar pontos de fricção. São úteis para avaliar CTAs, a hierarquia visual e as áreas de abandono.
- Reproduções de sessões: reproduza o comportamento real dos utilizadores para apoiar os testes de usabilidade e identificar problemas de interação durante um processo de auditoria ou revisão de UX.
- Funis de conversão: visualize a jornada do cliente para detetar os pontos em que os utilizadores abandonam o processo, ajudando a melhorar as taxas de rejeição e a orientar as decisões de reformulação.
- Recolha de feedback: recolha contributos diretos durante a investigação com utilizadores para orientar o design do produto e validar alterações junto do seu público-alvo.
- Painéis personalizáveis: visualize os dados analíticos de uma forma alinhada com as prioridades da equipa e os objetivos empresariais, ajudando as partes interessadas a manterem-se alinhadas.
- Análise preditiva: utilize dados comportamentais para antecipar problemas e fornecer recomendações práticas antes que estes se agravem.
- Colaboração em tempo real: apoie equipas multifuncionais — incluindo as de design, desenvolvimento e produto — ao permitir revisões em direto e decisões mais rápidas.
- Utilização ética dos dados: cumpra as normas de conformidade e conquiste a confiança dos utilizadores com ferramentas que respeitam a privacidade, especialmente importantes para aplicações SaaS e empresariais.
- Análise de voz e gestos: analise novos tipos de interação, apoiando o design de interfaces de utilizador para experiências sem contacto ou orientadas por voz.
Benefícios das ferramentas de auditoria de UX
A integração de ferramentas de auditoria de UX no seu processo de auditoria de design ou de avaliação heurística oferece vantagens práticas para a sua equipa e para o seu produto:
- Maior envolvimento dos utilizadores: as informações obtidas através de mapas de calor e reproduções de sessões ajudam a criar uma experiência mais fácil de utilizar e a aumentar a satisfação com a jornada do cliente.
- Decisões de design fundamentadas: a recolha de feedback em tempo real e a utilização de painéis adaptados à sua equipa apoiam melhores métodos de investigação e decisões de design de produto.
- Taxas de conversão mais elevadas: a análise dos funis permite identificar obstáculos de UX, reduzir as taxas de rejeição e orientar os utilizadores de forma mais eficaz para as CTAs.
- Resolução proativa de problemas: com ferramentas preditivas, pode agir antes de os utilizadores enfrentarem problemas, mantendo o seu produto digital aperfeiçoado e fiável.
- Maior rapidez no alinhamento da equipa: as partes interessadas podem colaborar em tempo real, acelerando o processo de elaboração do relatório de auditoria de UX e reforçando os seus objetivos empresariais.
- Maior conformidade e confiança: a utilização ética dos dados reforça a confiança dos utilizadores — algo fundamental para qualquer plataforma SaaS ou produto que trate dados pessoais.
- Adaptabilidade às tecnologias emergentes: à medida que as interações evoluem, por exemplo através da voz ou dos gestos, as ferramentas que suportam comportamentos em evolução ajudam a preparar o design de interfaces de utilizador para o futuro.
Custos e preços das ferramentas de auditoria de UX
A seleção de ferramentas de auditoria de UX exige uma compreensão dos vários modelos de preços e planos disponíveis. Os custos variam consoante as funcionalidades, o tamanho da equipa, os complementos e muito mais. A tabela abaixo resume os planos comuns, os seus preços médios e as funcionalidades normalmente incluídas nas soluções de ferramentas de auditoria de UX:
Tabela de comparação de planos para ferramentas de auditoria de UX
| Tipo de plano | Preço médio | Funcionalidades comuns |
| Plano gratuito | $0 | Análise básica, mapas de calor limitados e reproduções de sessões restritas. |
| Plano pessoal | $5-$30/utilizador/ mês | Mapas de calor completos, reproduções de sessões, recolha básica de opiniões e opções de personalização limitadas. |
| Plano empresarial | $30-$100/ utilizador/mês | Análise avançada, funis de conversão, ferramentas melhoradas de recolha de opiniões e colaboração em tempo real. |
| Plano empresarial de grande escala | $100+/utilizador/ mês | Análise preditiva, painéis personalizados, capacidades completas de exportação de dados e apoio ao cliente dedicado. |
Perguntas frequentes sobre ferramentas de auditoria de UX
Eis algumas respostas a perguntas comuns sobre ferramentas de auditoria de UX:
Como é que as ferramentas de auditoria de UX ajudam a melhorar as taxas de conversão?
As ferramentas de auditoria de UX identificam os pontos em que os utilizadores abandonam o funil de conversão, analisando os percursos e o comportamento dos utilizadores. Ao compreender estes pontos, pode fazer alterações direcionadas para melhorar a experiência do utilizador, como simplificar os processos de finalização da compra ou melhorar a visibilidade dos apelos à ação, o que pode conduzir a taxas de conversão mais elevadas.
O que devo procurar numa ferramenta de auditoria de UX?
Ao escolher uma ferramenta de auditoria de UX, considere a sua capacidade para fornecer análises detalhadas, como mapas de calor e reproduções de sessões. Procure funcionalidades que suportem a colaboração em tempo real e painéis personalizáveis. Certifique-se de que a ferramenta se integra bem com o seu conjunto de software existente, de modo a proporcionar um fluxo de dados contínuo e informações abrangentes.
É possível utilizar ferramentas de auditoria de UX para aplicações móveis?
Sim, muitas ferramentas de auditoria de UX foram concebidas para analisar interfaces web e de aplicações móveis. Podem acompanhar as interações dos utilizadores em dispositivos móveis, fornecendo informações sobre a forma como estes navegam nas aplicações. Isto ajuda a otimizar as experiências de utilização em dispositivos móveis, identificando e resolvendo problemas específicos das plataformas móveis.
Com que frequência deve a minha equipa realizar uma auditoria de UX?
Recomenda-se realizar uma auditoria de UX anualmente ou antes de atualizações importantes do produto. As auditorias regulares ajudam a acompanhar os problemas relacionados com a experiência do utilizador e garantem que o produto evolui de acordo com as necessidades dos utilizadores. Esta abordagem proativa pode evitar que problemas menores se transformem em problemas significativos.
Que tipos de dados recolhem normalmente as ferramentas de auditoria de UX?
As ferramentas de auditoria de UX recolhem uma vasta gama de dados, incluindo cliques dos utilizadores, deslocações, percursos de navegação e tempos de interação. Podem também recolher opiniões através de inquéritos e analisar dados demográficos dos utilizadores. Estes dados ajudam a compreender o comportamento dos utilizadores e a tomar decisões fundamentadas sobre o design e a funcionalidade.
Como podem as ferramentas de auditoria de UX melhorar a colaboração da equipa?
Muitas ferramentas de auditoria de UX incluem funcionalidades de colaboração em tempo real, permitindo que os membros da equipa trabalhem em conjunto nas informações sobre os utilizadores e nas alterações de design. Ao partilhar dados e opiniões instantaneamente, a sua equipa pode tomar decisões mais rápidas e fundamentadas, melhorando a eficiência geral dos processos de melhoria da UX.