

Com tantas soluções diferentes de monitorização de utilizadores disponíveis, é difícil perceber qual é a mais adequada para si. Sabe que quer recolher dados relacionados com o comportamento, as preferências e o envolvimento dos utilizadores, bem como obter informações para otimizar os seus produtos, mas precisa de descobrir qual é a melhor ferramenta. Eu ajudo! Neste artigo, vou facilitar a sua escolha, partilhando as minhas experiências pessoais com dezenas de ferramentas de monitorização diferentes, utilizadas por equipas grandes e em produtos diversificados, e apresentando as minhas escolhas do melhor software de monitorização de utilizadores.
Why Trust Our Software Recommendations
6,700+
Reviews
20
Industry experts
16+
Evaluation factors
14
Years
Our team has been testing and reviewing software since 2012. As product managers ourselves, we know how difficult—and important—it is to choose the right software.
For this guide, we evaluated tools using hands-on testing and independent research, scoring tools using our selection criteria.
Our reviews reflect our human editorial judgment, not a sales pitch.
Expert reviewers:
- Andrew LumbySenior TPM
- Cristiano ValimSenior UI/UX Lead


Tabela comparativa: software de monitorização de utilizadores
Esta tabela comparativa resume os detalhes de preços das minhas principais escolhas de software de monitorização de utilizadores.
| Tool | Best For | Trial Info | Price | ||
|---|---|---|---|---|---|
| 1 | Best for heatmaps and session replay combined | Free plan available | From $25/month | Website | |
| 2 | Best for event-based product analytics | Free plan available | From $120/month (billed annually) | Website | |
| 3 | Best for session tracking in regulated industries | Free demo available | Pricing upon request | Website | |
| 4 | Best for product adoption scoring and tracking | Free plan + 30-day free trial + free demo available | Pricing upon request | Website | |
| 5 | Best for no-code heatmaps and CRO tracking | 30-day free trial available | From $29/month | Website | |
| 6 | Best for cross-platform journey and session analytics | Free demo available | Pricing upon request | Website | |
| 7 | Best for session replay tied to quantitative funnels | Free plan available | Pricing upon request | Website | |
| 8 | Best for unified analytics, replay, and experiments | Free plan + free demo available | Pricing upon request | Website | |
| 9 | Best for retroactive event analysis without tagging | Free plan available | Pricing upon request | Website | |
| 10 | Best for open-source, warehouse-native user tracking | Free plan available | Pricing upon request | Website |


Análises do melhor software de monitorização de utilizadores
Abaixo encontrará os meus resumos detalhados do melhor software de monitorização de utilizadores que integrou a minha lista restrita. As minhas análises apresentam uma visão detalhada das principais funcionalidades, vantagens & desvantagens, integrações e casos de utilização ideais de cada ferramenta, para o ajudar a encontrar a melhor opção para si.
 Best for heatmaps and session replay combined
- Free plan available
- From $25/month
Visit WebsiteCustomer Rating:4.7/5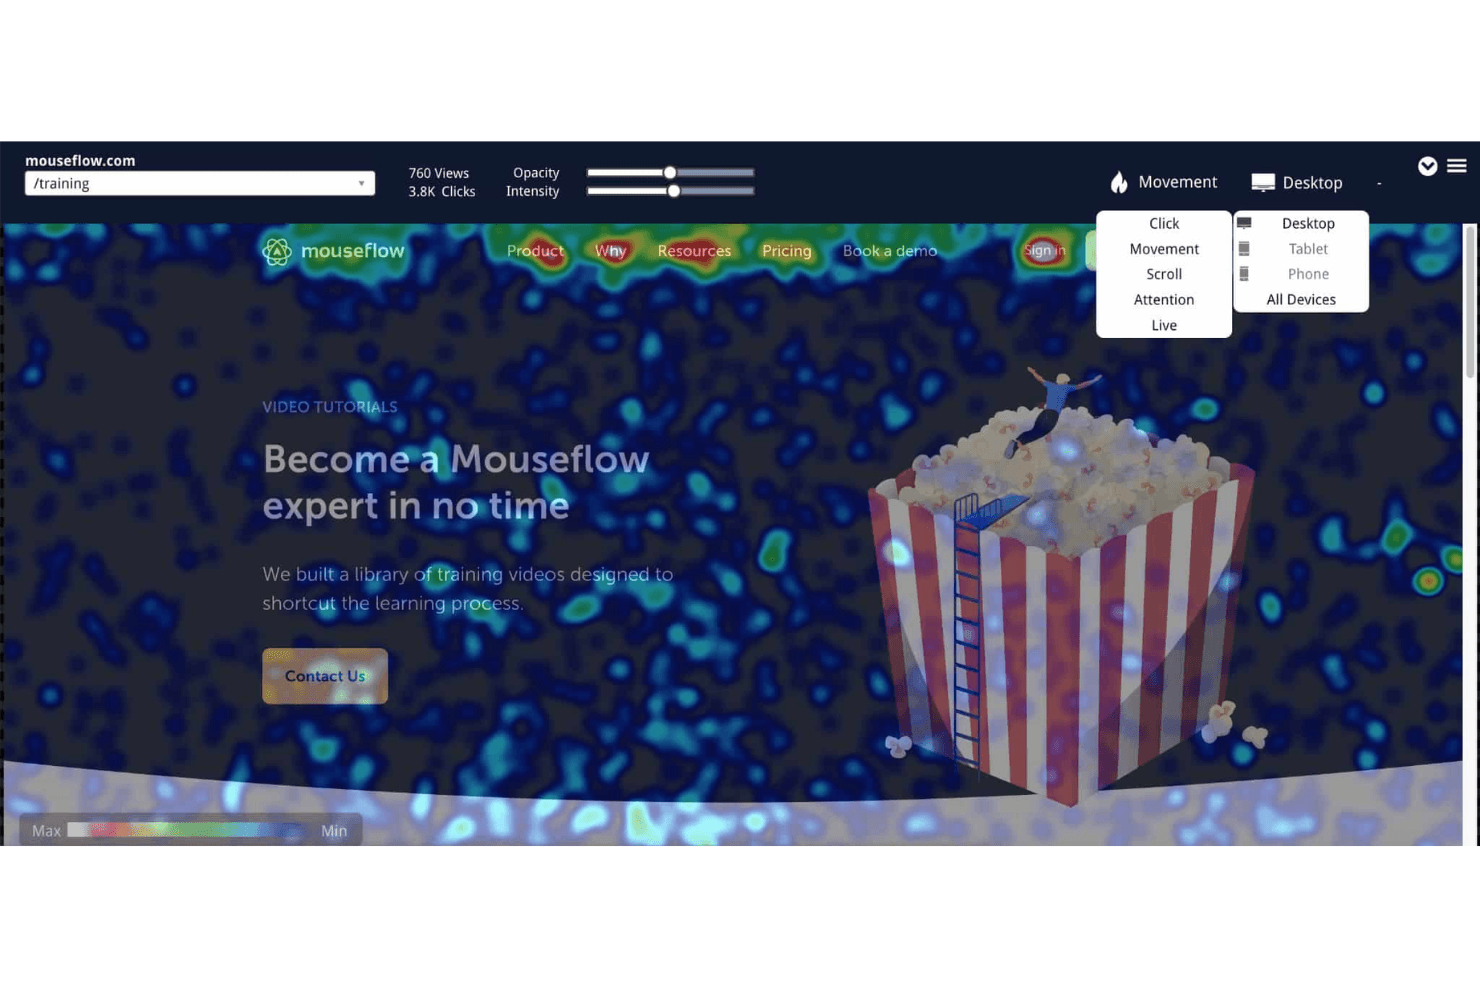
Mouseflow's heatmaps visualize user behavior by collecting and displaying data on clicks, scrolls, attention, and movement. Mouseflow is a user tracking platform that captures session replays, heatmaps, conversion funnels, form analytics, and friction detection across web experiences.
Who Is Mouseflow Best For?
Mouseflow is a strong fit for UX designers and digital marketers who need rich visual behavior data—heatmaps, session replays, and friction detection—without managing a complex analytics stack.
Why I Picked Mouseflow
Mouseflow earns its spot on my shortlist because it's one of the few tools that genuinely excels at both heatmaps and session replay without treating either as an afterthought. I particularly like how its six heatmap types, including friction heatmaps that surface rage clicks and dead clicks automatically, pair directly with session replay so I can spot a problem in the heatmap and immediately pull the exact recordings behind it. Mina AI adds another layer by letting me ask plain-English questions like "Why are users abandoning checkout?" and linking answers back to specific sessions.
Mouseflow Key Features
- Form analytics: Tracks which form fields cause abandonment, which submissions fail, and where users drop off before completing a form.
- Journey analytics: Maps the actual paths visitors take through your site and highlights where they exit.
- Conversion funnels: Visualizes multi-step user flows with revenue and friction metrics to show exactly where drop-off happens.
- Feedback surveys: Deploys in-session surveys, including NPS, that can trigger automatically when a visitor hits a friction point.
Mouseflow Integrations
Mouseflow lists 42 integrations, including Google Analytics, Google Tag Manager, Google Ads, HubSpot, Salesforce, Shopify, WordPress, Slack, and Microsoft Teams. It also offers a REST API and MCP server for custom data access.
Pros and Cons
Pros:
- Mina AI connects patterns to sessions
- Autocapture reveals friction without manual tagging
- Combines heatmaps with session replay
Cons:
- No native mobile app SDK
- Monthly session caps can halt tracking
Learn more about Mouseflow: Best for event-based product analytics
- Free plan available
- From $120/month (billed annually)
Visit WebsiteCustomer Rating:4.5/5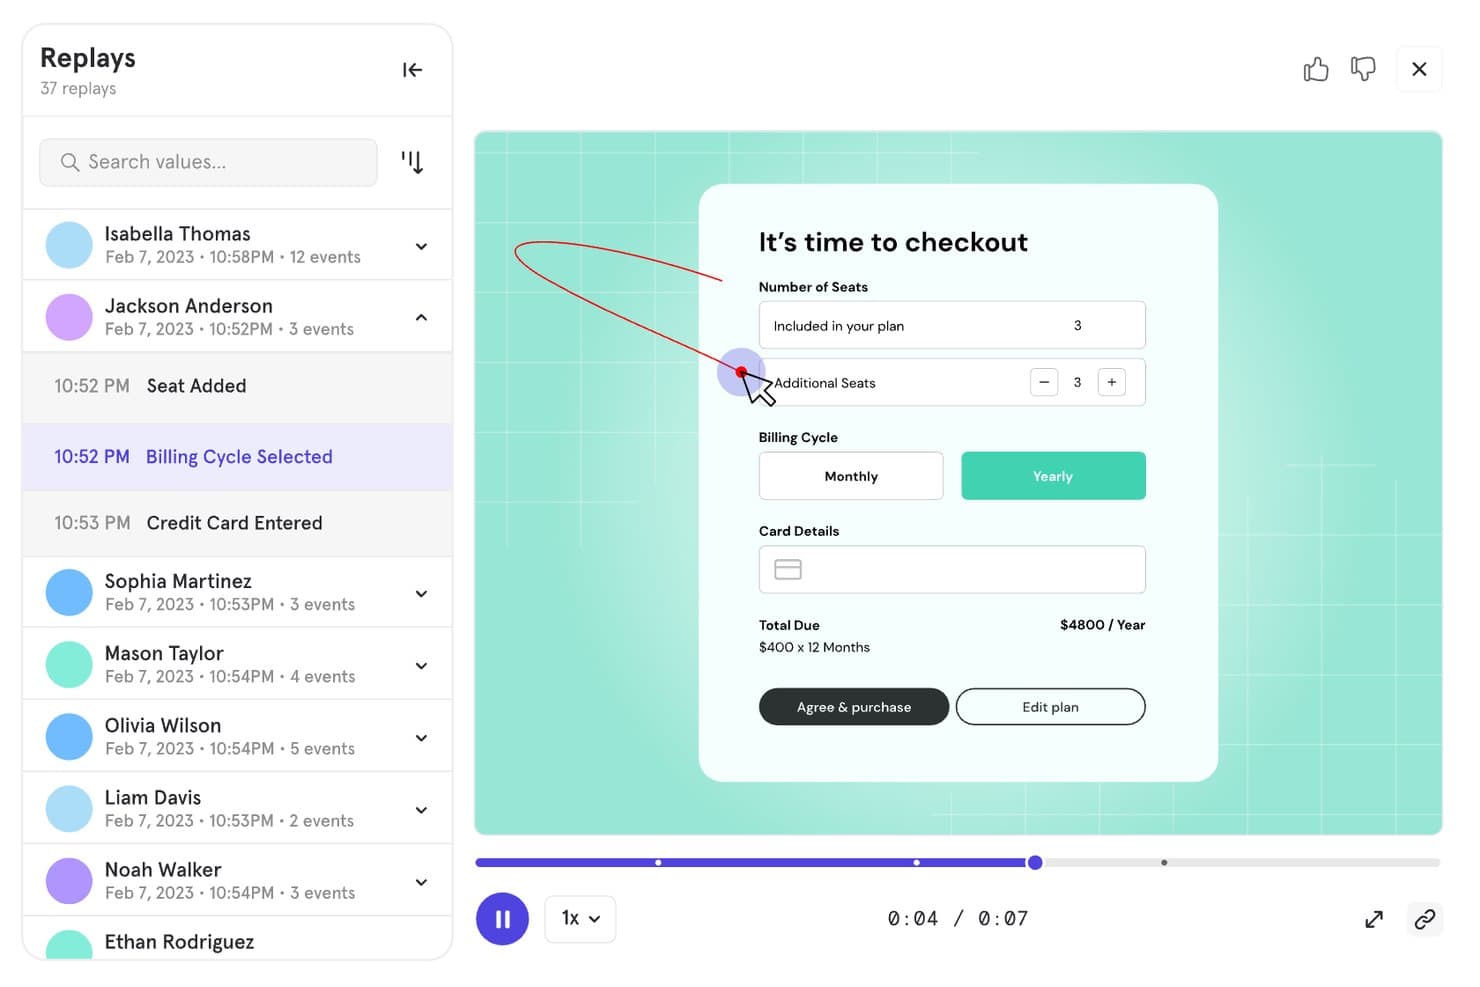
Mixpanel lets users replay sessions to track checkout behavior. Mixpanel is a product analytics and user tracking platform that combines event-based tracking, session replay, funnel and retention analysis, behavioral cohorts, and built-in experimentation and feature flags across web, mobile, and server-side data sources.
Who Is Mixpanel Best For?
Mixpanel is a strong fit for product and growth teams that need to go deep on user behavior—tracking events, analyzing funnels, and running experiments all in one place.
Why I Picked Mixpanel
Mixpanel earns its spot on my shortlist because event-based tracking is genuinely where it shines. I love how you can jump directly from a funnel drop-off into filtered session replays of the exact users who churned at that step, without switching tools or losing context. Autocapture handles interaction logging across web and mobile automatically, while behavioral cohorts let you slice retention and flow reports by any user property or action.
Mixpanel Key Features
- Multi-platform event tracking: Captures user actions across web, iOS, Android, Flutter, and server-side or data warehouse sources in a single unified timeline.
- Behavioral cohorts: Lets you group users by any combination of actions, properties, or event sequences to filter reports and retention analysis.
- Built-in experimentation: Runs multi-variant A/B tests with statistical methods including Frequentist, Sequential, and CUPED, plus sample ratio mismatch detection.
- Feature flags: Supports percentage rollouts, cohort-based targeting, sticky variants, and offline caching with a full audit trail.
Mixpanel Integrations
Mixpanel supports integrations with Segment and mParticle, plus data warehouse connectors and data pipelines. Its APIs support custom data ingestion, exports, and querying.
Pros and Cons
Pros:
- Combines analytics with experimentation and feature flags
- Captures granular cross-platform user behavior
- Connects funnels directly to session replays
Cons:
- Costs increase as tracked volume grows
- Event setup demands technical planning
 Best for session tracking in regulated industries
- Free demo available
- Pricing upon request
Visit WebsiteCustomer Rating:4.7/5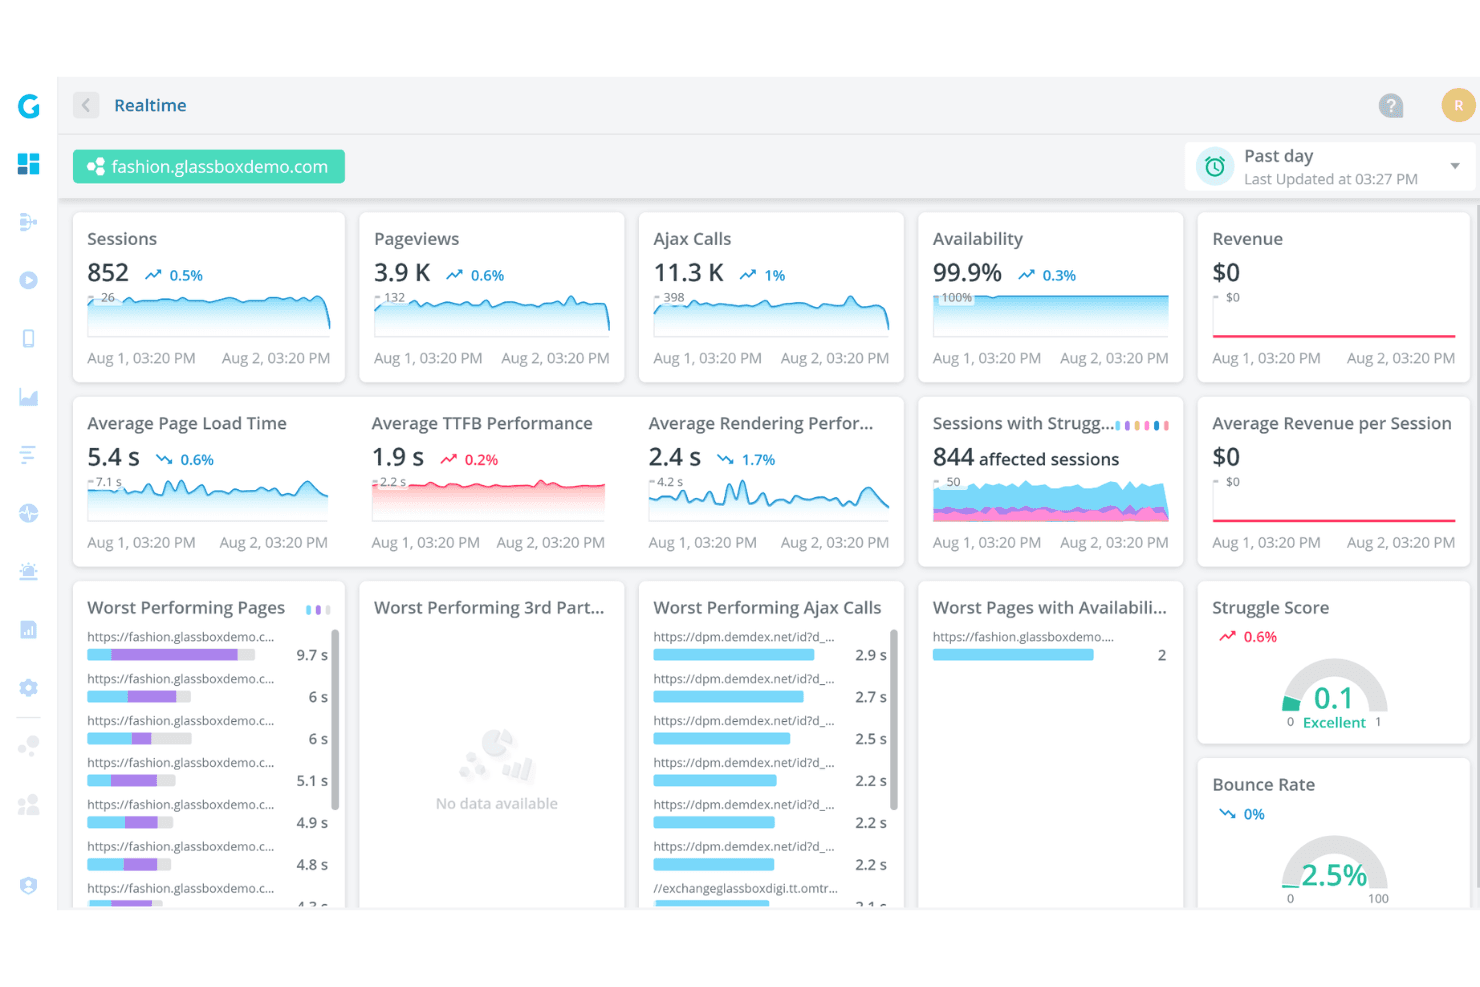
Glassbox offers a real-time analytics dashboard displaying sessions, pageviews, Ajax calls, availability, page load times, and struggle scores for a demo fashion website. Glassbox is a digital experience analytics platform that combines tagless autocapture, session replay, heatmaps (Interaction Maps), funnel analysis, and AI-assisted behavior detection across web and native mobile apps.
Who Is Glassbox Best For?
Glassbox is a strong fit for enterprise teams in banking, finance, and other regulated industries that need session tracking with built-in compliance controls.
Why I Picked Glassbox
Glassbox earns its spot on my shortlist because of how seriously it takes compliance without sacrificing depth of insight. I love that it ships with built-in HIPAA, PCI, GDPR, and GLBA controls alongside SOC 2 Type II and ISO 27001 certifications, which means regulated teams aren't retrofitting privacy on top of an analytics tool. Its tagless autocapture logs over 1,000 events per session with sensitive fields masked by default, and the Struggle Score flags friction moments automatically so compliance-heavy teams can act on behavior data without manually tagging a single element.
Glassbox Key Features
- Augmented Journey Map™: A visual map of user journeys across your site or app that highlights where users drop off at each step.
- GIA session summarization: An AI assistant that generates plain-language summaries of individual sessions and lets you search recordings using natural language queries.
- Voice of the Silent: A built-in customer feedback tool that collects qualitative input directly within the platform alongside behavioral data.
- Single-tenant and on-premises deployment: Glassbox supports deployment on your own infrastructure or a dedicated cloud instance on AWS or Azure.
Glassbox Integrations
Glassbox offers integrations with Adobe Analytics, Google Analytics, Google Tag Manager, Adobe Launch, Tealium, Jira, Slack, Qualtrics, Optimizely, and VWO. It also provides an open API for custom integrations.
Pros and Cons
Pros:
- Compliance controls suit regulated product teams
- Handles web and native mobile journeys
- Tagless capture avoids manual event tagging
Cons:
- High data volume can overwhelm new users
- Replay retention may limit historical investigation
Learn more about Glassbox: Best for product adoption scoring and tracking
- Free plan + 30-day free trial + free demo available
- Pricing upon request
Visit WebsiteCustomer Rating:4.4/5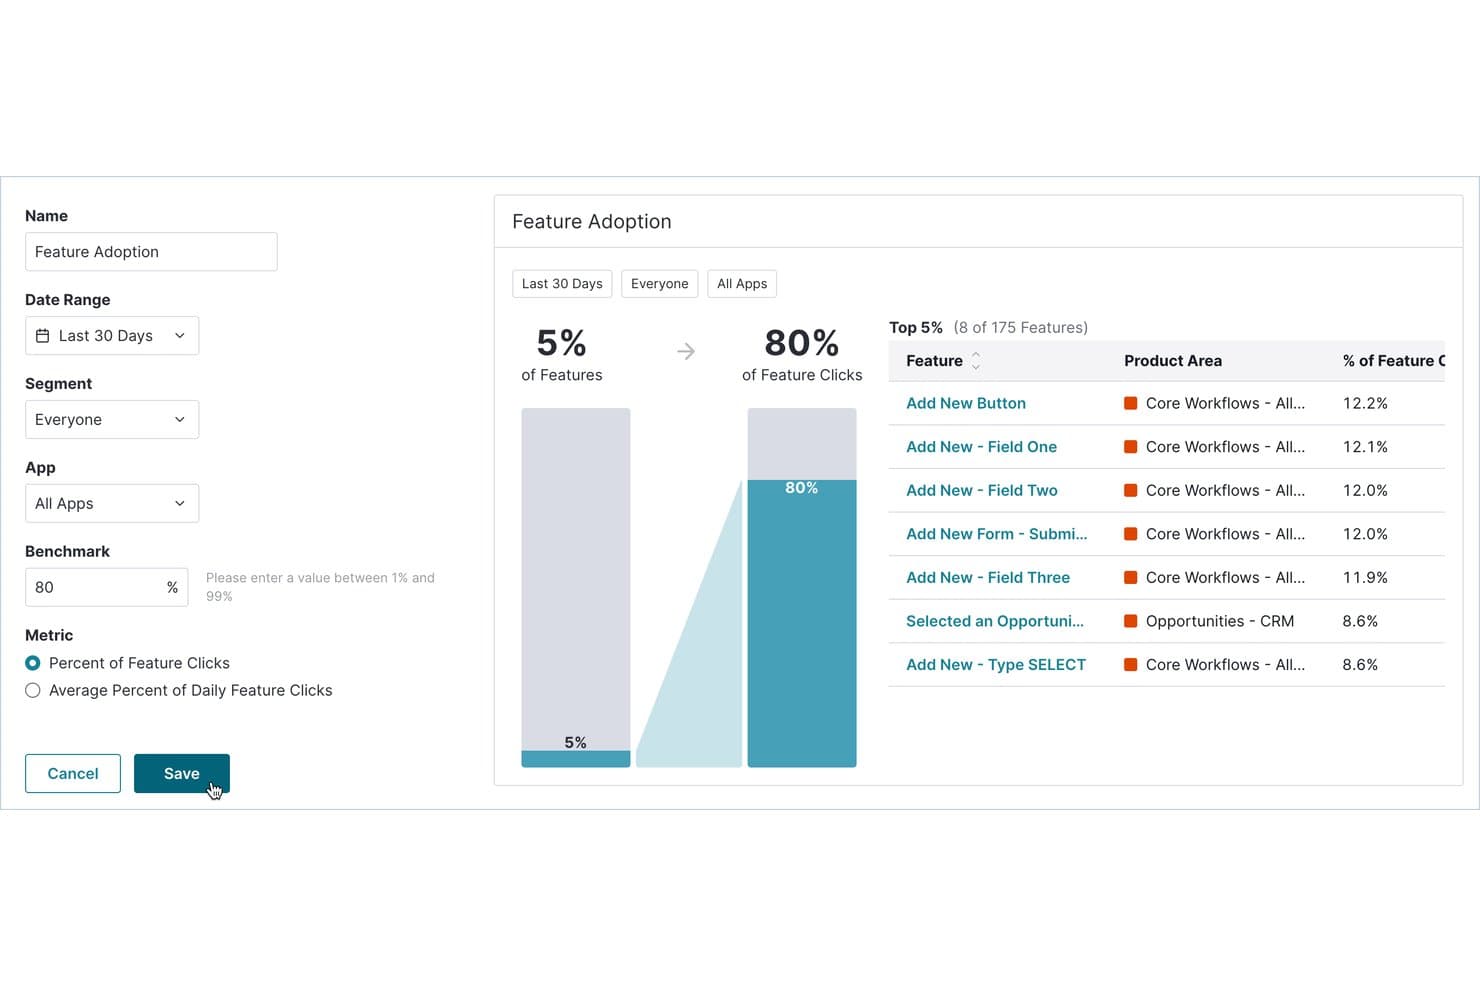
Pendo tracks which features drive the most user clicks and adoption. Pendo is a product analytics and user tracking platform that combines autocapture behavior tracking, session replay, funnel and path analysis, in-app guides, and NPS surveys in one tool.
Who Is Pendo Best For?
Pendo is a strong fit for product managers and growth teams at mid-market to enterprise companies who need to tie user behavior data directly to adoption and retention outcomes.
Why I Picked Pendo
Pendo earns its spot on my shortlist because of its Product Engagement Score (PES), which rolls adoption, stickiness, and growth into a single metric that tells you exactly where users are in their journey. I also love that autocapture logs every interaction from the moment you install the snippet, so you can tag features retroactively and still see their full history. That means I'm never locked out of historical data just because I didn't instrument something upfront.
Pendo Key Features
- Session replay: Watch real user sessions across web and mobile apps, with rage clicks and U-turns flagged automatically.
- Funnel and path analysis: Track how users move through multi-step flows and identify exactly where they drop off.
- Leo AI assistant: Ask plain-English questions about your product data and get answers directly from live Pendo data.
- Data Sync: Export product usage and user metadata to data warehouses like Snowflake, S3, Azure, or Google Cloud.
Pendo Integrations
Pendo offers 85+ integrations, including Salesforce, Zendesk, Atlassian, Snowflake, Amazon S3, Azure, and Google Cloud. Its Data Sync sends product usage and account metadata to supported warehouses and cloud storage.
Pros and Cons
Pros:
- Unlimited session replays expose friction signals
- Product Engagement Score tracks adoption trends
- Autocapture enables retroactive event analysis
Cons:
- Replay retention defaults to 30 days
- Heatmaps cover tagged features only
Learn more about Pendo: Best for no-code heatmaps and CRO tracking
- 30-day free trial available
- From $29/month
Visit WebsiteCustomer Rating:4.3/5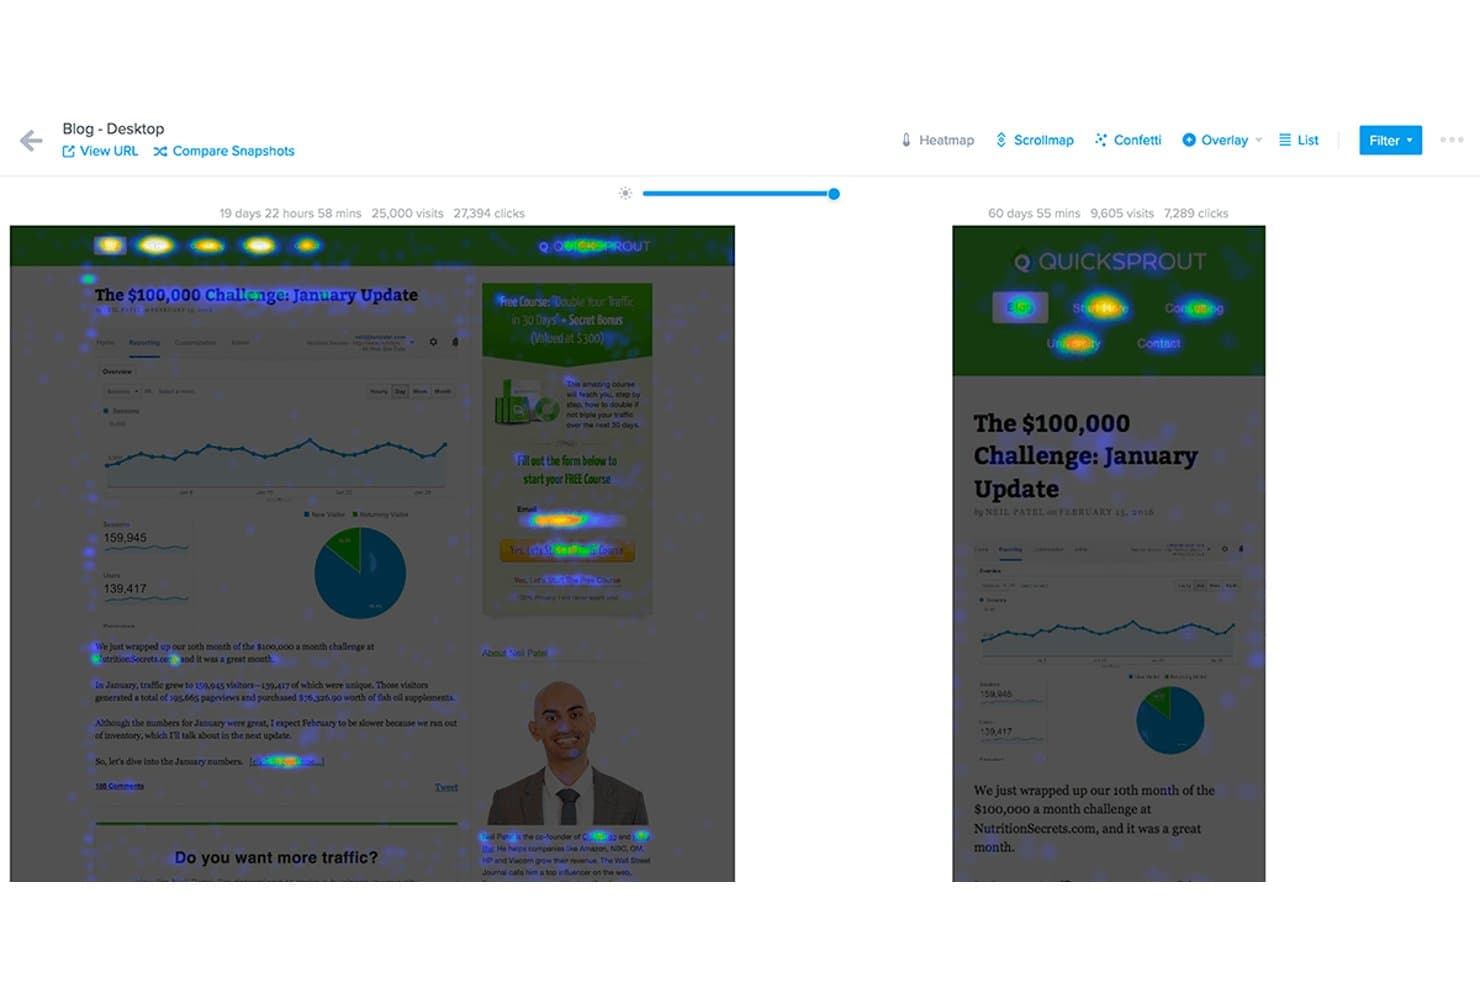
Crazy Egg compares heatmaps across two page snapshots side by side. Crazy Egg is a website behavior tracking tool that combines heatmaps, session recordings, funnel tracking, A/B testing, and on-site surveys into a single no-code platform.
Who Is Crazy Egg Best For?
Crazy Egg is a strong fit for digital marketers and UX designers who need quick, no-code visibility into website behavior without managing a complex analytics stack.
Why I Picked Crazy Egg
Crazy Egg earns its spot on my shortlist because its five heatmap types give you a level of visual detail that's genuinely hard to find in one no-code tool. I particularly like the confetti map, which breaks individual clicks down by 20+ attributes like UTM source, device, and traffic type, so you can see exactly which audience segment is ignoring your CTA. Pair that with AI-flagged session recordings filtered by funnel drop-off, and you've got a tight feedback loop between behavior data and conversion decisions.
Crazy Egg Key Features
- Scroll heatmap: Shows exactly how far down a page visitors scroll, so you can see where attention drops off before users reach key content.
- A/B testing: Lets you run unlimited split tests directly in the platform without touching your codebase.
- On-site surveys: Collects qualitative feedback from visitors at specific points in their journey using targeted, in-page survey prompts.
- Error tracking: Automatically flags JavaScript errors and broken interactions that may be disrupting the user experience on your site.
Crazy Egg Integrations
Crazy Egg offers integrations with Google Tag Manager, Segment, Shopify, WordPress, Wix, Squarespace, Magento, Drupal, Joomla, Google, Meta, and TikTok. It also supports server-side conversion tracking through an API.
Pros and Cons
Pros:
- Funnels connect conversion drop-offs with recordings
- AI flags useful recordings for faster analysis
- Five heatmap types reveal detailed behavior patterns
Cons:
- Website-only tracking excludes mobile app journeys
- Recording caps can pause data collection
Learn more about Crazy Egg: Best for cross-platform journey and session analytics
- Free demo available
- Pricing upon request
Visit WebsiteCustomer Rating:4.7/5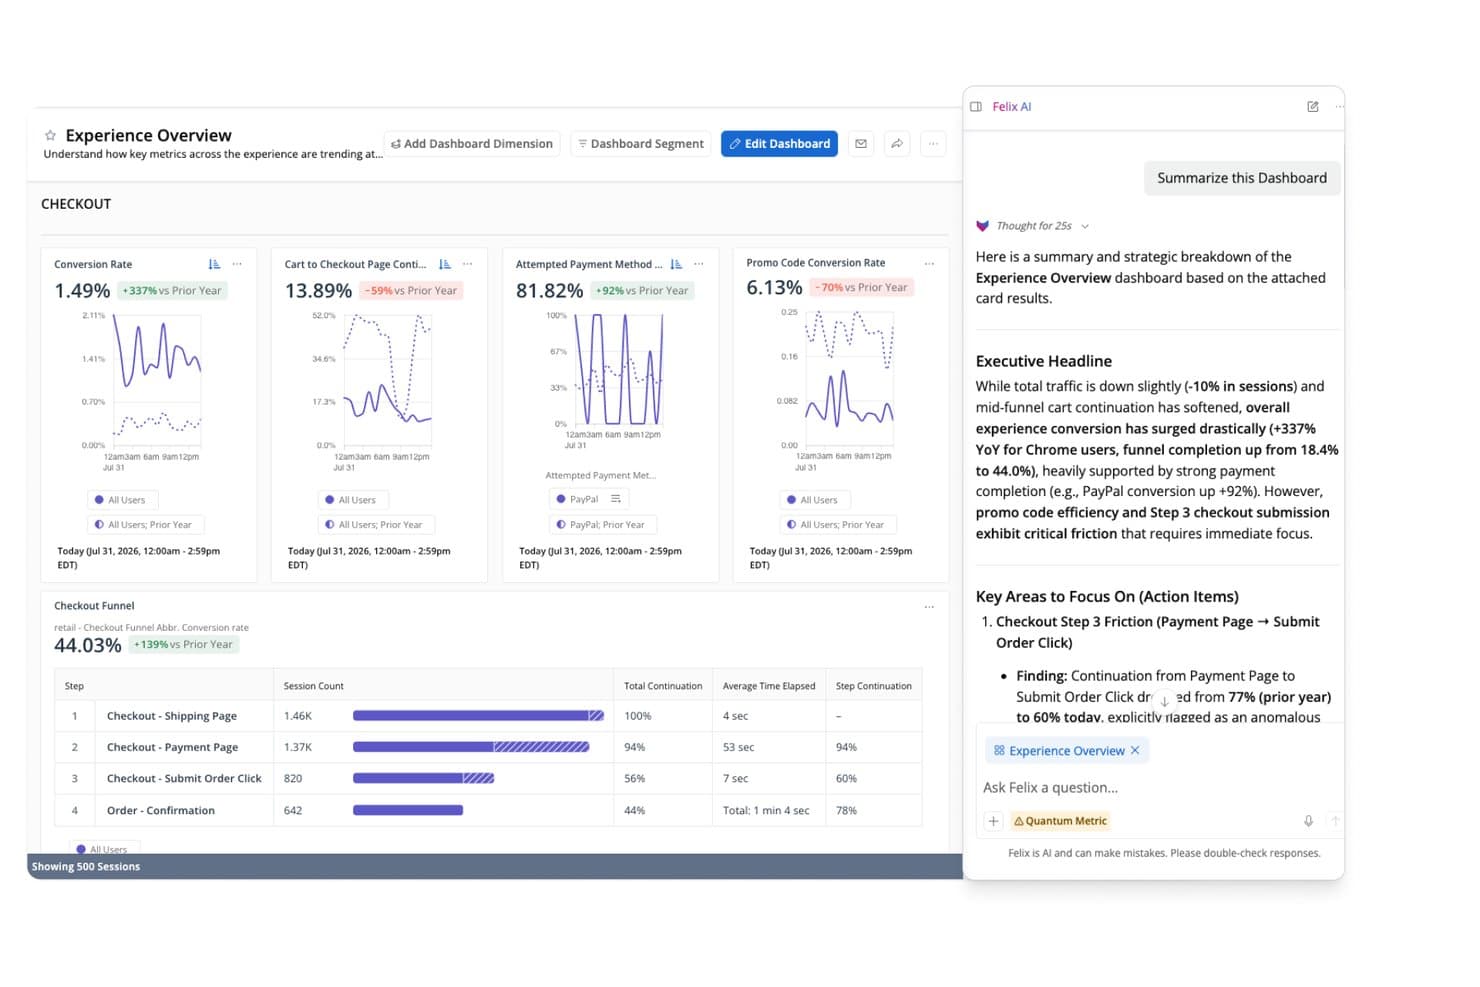
Quantum Metric's Felix AI summarizes checkout funnel insights instantly. Quantum Metric is an enterprise user tracking platform that combines autocapture session replay, real-time interaction heatmaps, funnel and journey analytics, and AI-powered behavior analysis across web and native mobile apps.
Who Is Quantum Metric Best For?
Quantum Metric is built for enterprise product, UX, and analytics teams that need to connect web and native mobile behavior data in a single platform.
Why I Picked Quantum Metric
Quantum Metric earns its spot on my shortlist because it stitches web and native mobile sessions into a single, continuous journey view without requiring separate tools. I love how Opportunity Analysis automatically ranks friction points by business impact, so my team isn't guessing which drop-off actually matters. Felix AI adds another layer by writing session summaries and flagging anomalies in plain language, turning raw replay data into something you can act on in minutes.
Quantum Metric Key Features
- Precision eventing: Lets you define and capture custom events on top of the 300+ signals autocaptured by default, giving you targeted tracking where behavioral context alone isn't enough.
- Cohort retention analysis: Groups users by shared behaviors or attributes and tracks how they return over time, so you can spot where engagement drops off after key product moments.
- Data Streaming add-on: Pipes session and behavioral data directly into Snowflake, BigQuery, Redshift, Databricks, and other warehouse destinations with filtering and schema alignment applied before export.
- Privacy controls with device-level encryption: Encrypts sensitive data on the user's device before it's transmitted and lets you exclude specific inputs or components from capture at a granular level.
Quantum Metric Integrations
Documented integrations include Optimizely, Adobe Customer Journey Analytics, Alchemer, Snowflake, BigQuery, Redshift, Databricks, Amazon S3, and Oracle. Quantum Metric’s Data Streaming add-on connects behavioral data to these warehouse destinations.
Pros and Cons
Pros:
- Opportunity Analysis connects friction to business impact
- Felix AI summarizes sessions and flags anomalies
- Cross-platform journey stitching unifies web and mobile
Cons:
- Search and segment navigation frustrate reviewers
- Replay and session loading can be slow
Learn more about Quantum Metric: Best for session replay tied to quantitative funnels
- Free plan available
- Pricing upon request
Visit WebsiteCustomer Rating:4.5/5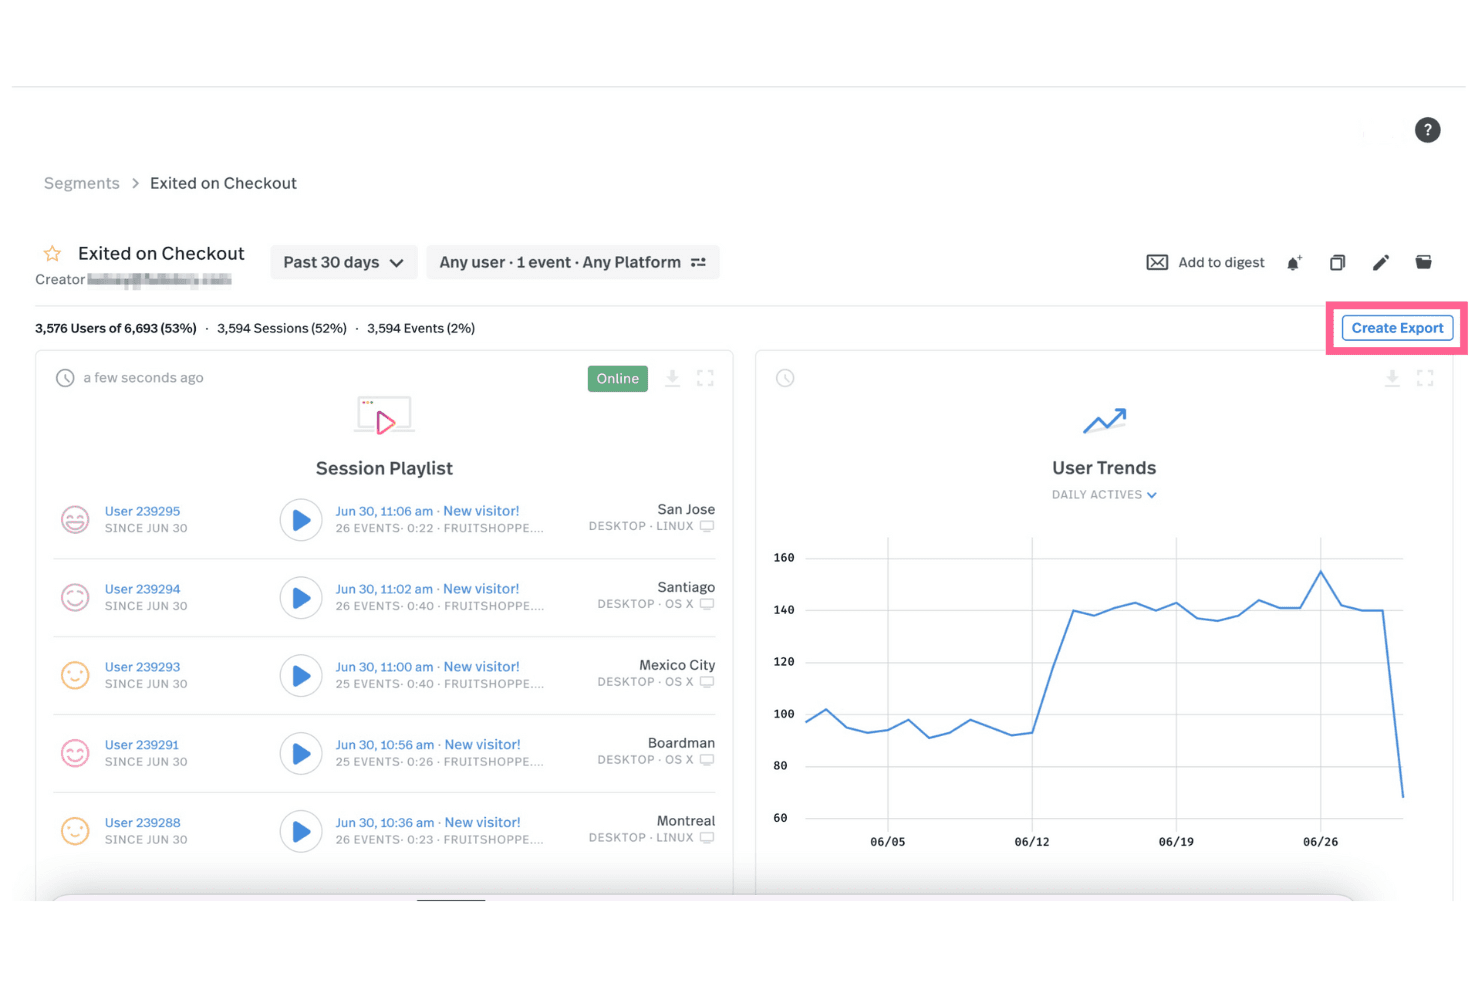
Fullstory lets you view session replays for various events and export this data to your other systems. Fullstory is a user tracking and session replay platform that captures behavioral data through tagless autocapture, offering session replay, heatmaps, funnel tracking, conversion analysis, and warehouse-native data export across web and mobile.
Who Is Fullstory Best For?
Fullstory suits product managers and growth teams who need to connect session replays directly to funnel data and conversion analysis.
Why I Picked Fullstory
Fullstory earns its spot on my shortlist because it ties session replay directly to quantitative funnel data in a way that most tools don't. I love that I can watch a replay of a user who dropped off mid-checkout and immediately see where that drop sits within the Funnels & Conversions module, without switching tools. Fullstory's tagless autocapture also means I'm not waiting on engineering to instrument events before I can start analyzing behavior.
Fullstory Key Features
- Tagless autocapture: Fullstory automatically records all user interactions across web and mobile without requiring manual event tagging.
- AI session summaries: StoryAI generates one-click summaries of individual sessions, giving you behavioral context without watching full replays.
- Omnisearch: A cross-session search tool that lets you find specific user actions, events, or sessions across your entire dataset.
- Warehouse-native data export: Fullstory Anywhere sends raw event data directly to BigQuery, Amazon Redshift, or Snowflake so your data stays in your own warehouse.
Fullstory Integrations
Fullstory integrates with Google Analytics, Google BigQuery, Google Tag Manager, Salesforce, Adobe, Slack, Optimizely, AB Tasty, Dynamic Yield, and Twilio Segment. Its APIs, webhooks, and Anywhere Warehouse support custom connections to BigQuery, Amazon Redshift, and Snowflake.
Pros and Cons
Pros:
- AI summaries speed session analysis
- Tagless capture reduces instrumentation work
- Replay connects directly to funnels
Cons:
- Adoption scoring targets employee tools
- No native experimentation or feature flags
Learn more about Fullstory: Best for unified analytics, replay, and experiments
- Free plan + free demo available
- Pricing upon request
Visit WebsiteCustomer Rating:4.5/5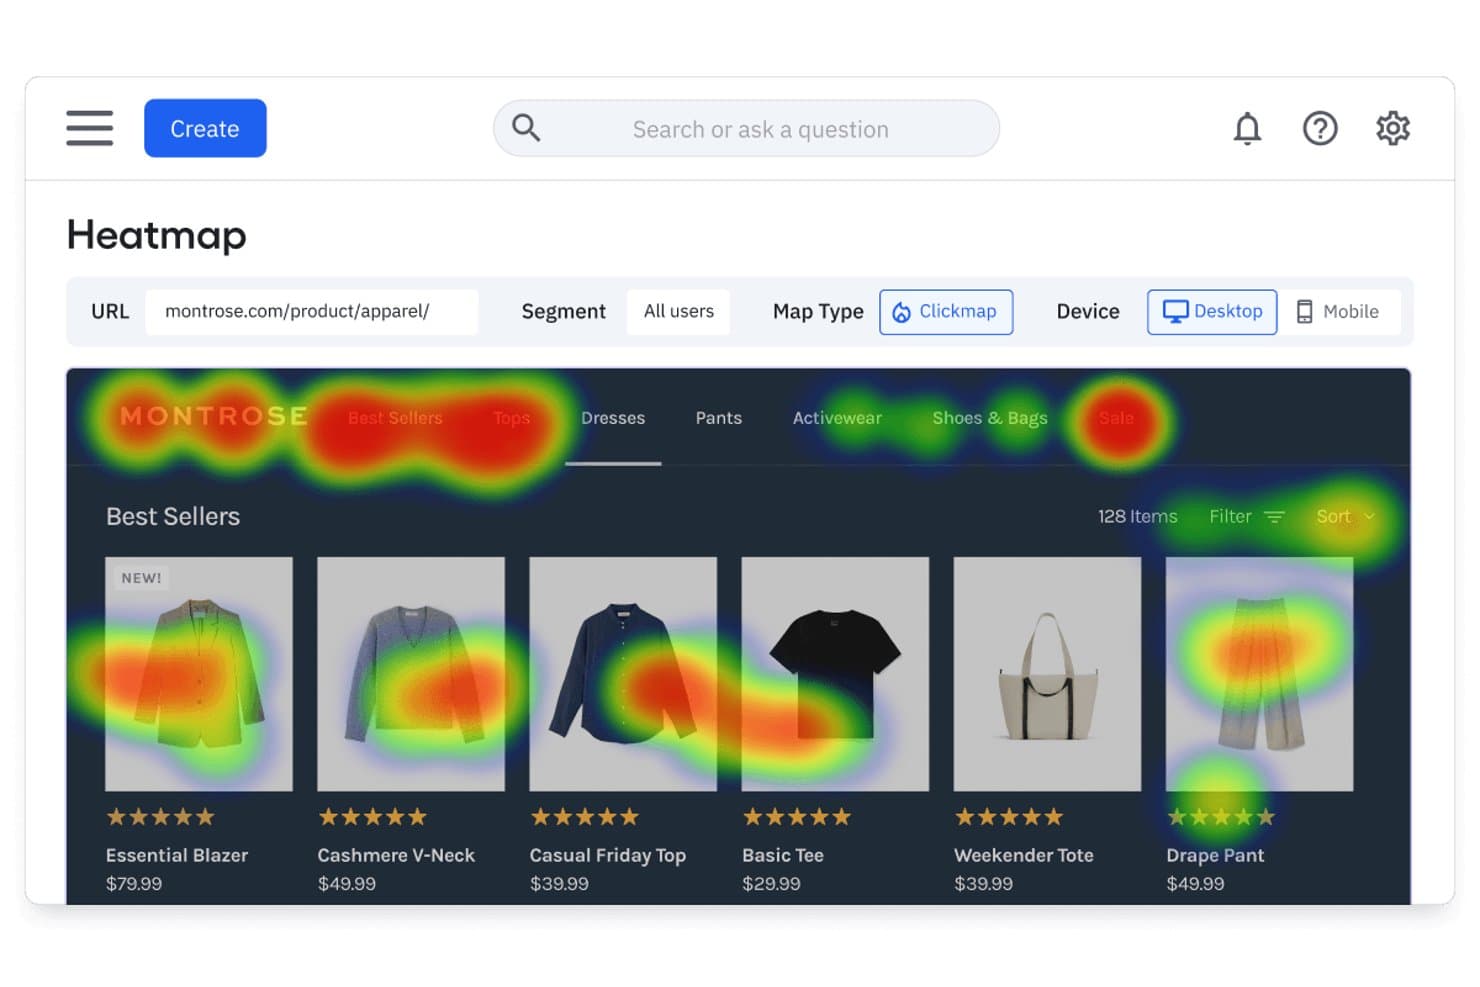
Amplitude's heatmap reveals where users click on product pages. Amplitude is a product analytics platform that combines autocapture-based behavior tracking, session replay, heatmaps, funnel analysis, and built-in experimentation tools across web and mobile.
Who Is Amplitude Best For?
Amplitude is a strong fit for product and growth teams that want analytics, session replay, heatmaps, and experimentation in one place instead of stitching together separate tools.
Why I Picked Amplitude
Amplitude earns its spot on my shortlist because it pulls analytics, session replay, heatmaps, and experimentation into one platform, so I'm not bouncing between tools to connect the dots. I especially like how replays link directly to funnel events and AI summaries flag friction points without me having to scrub through footage manually. Autocapture gets behavioral data flowing instantly, and visual event labeling means non-engineers on my team can define what to track without writing a line of code.
Amplitude Key Features
- Behavioral cohort syncing: Build cohorts from user behavior data and sync them directly to connected marketing and messaging platforms.
- AI-assisted chart building: Use natural language to generate analytics charts and receive automated root-cause alerts on metric changes.
- Visual event labeling: Click on page elements to define and label tracked events without writing any code.
- Built-in experimentation: Run feature experiments and web experiments with multi-armed bandit testing available on Growth plans and above.
Amplitude Integrations
Amplitude offers 159+ integrations, including Segment, Snowflake, BigQuery, Databricks, HubSpot, Braze, Salesforce, LaunchDarkly, Optimizely, and GA4. It also supports an HTTP API, webhooks, and MCP connections for custom data workflows.
Pros and Cons
Pros:
- Visual event labeling reduces engineering dependency
- AI summaries pinpoint friction within replays
- Unifies analytics, replay, heatmaps, and experiments
Cons:
- Autocapture needs precision events for depth
- Native mobile app heatmaps remain unavailable
Learn more about Amplitude: Best for retroactive event analysis without tagging
- Free plan available
- Pricing upon request
Visit WebsiteCustomer Rating:4.3/5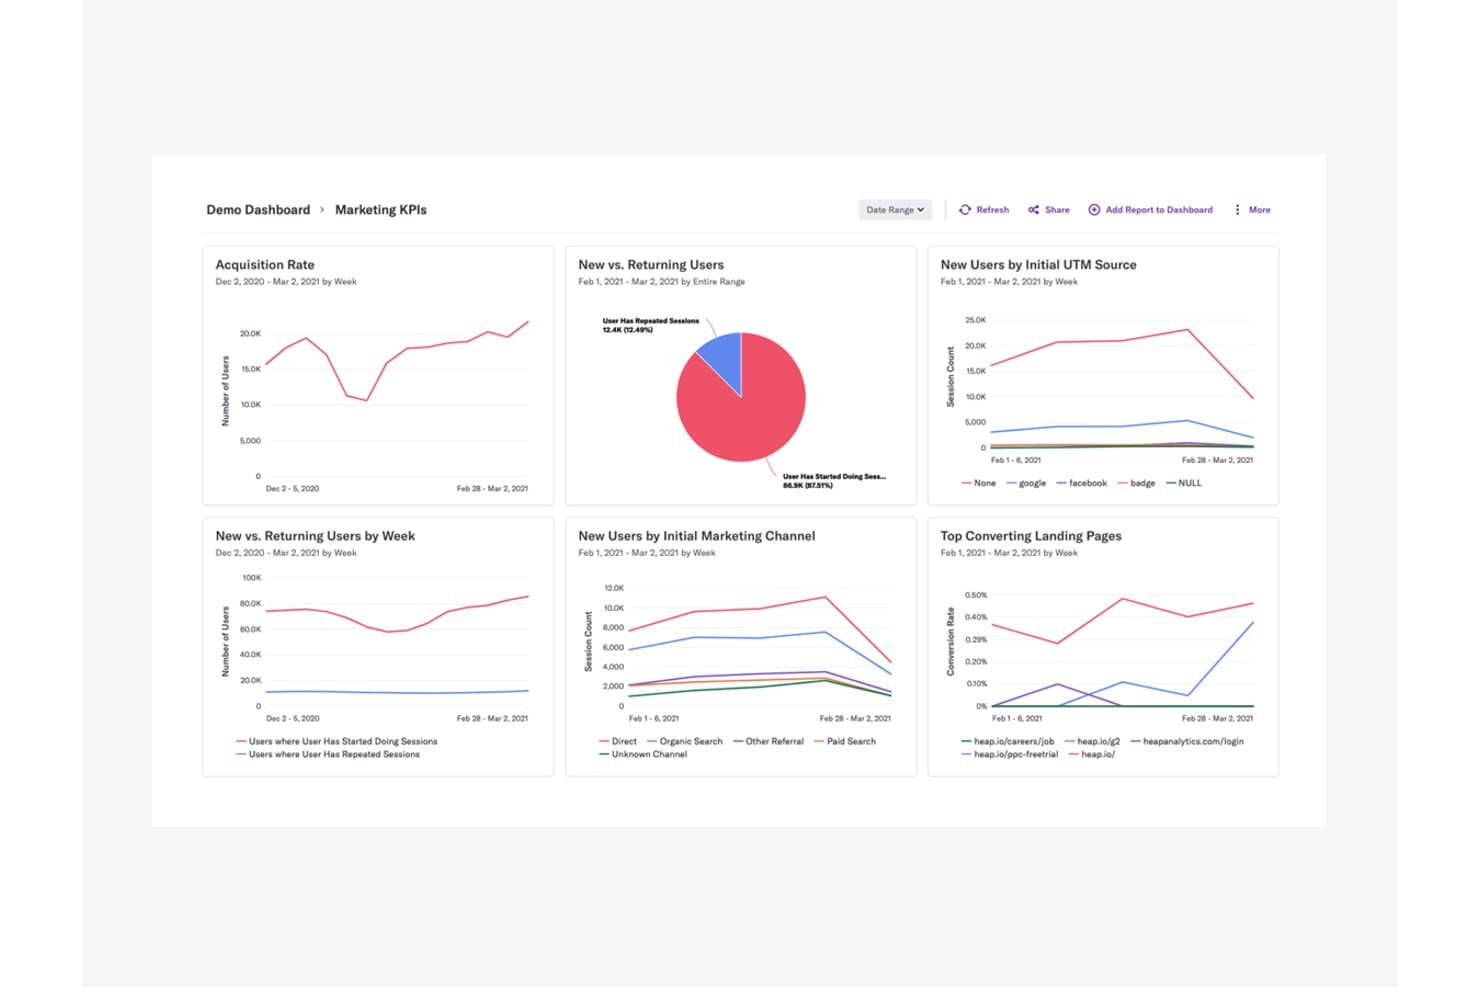
Heap centralizes marketing KPIs to reveal user acquisition and behavior trends. Heap (by Contentsquare) is a product analytics and user tracking platform that automatically captures clicks, pageviews, form fills, and user journeys across web and mobile—without requiring you to tag events in advance.
Who Is Heap Best For?
Heap is a strong fit for product and growth teams who need to analyze user behavior without waiting on engineering to instrument events.
Why I Picked Heap
I picked Heap as one of the best because its autocapture approach means every click, form fill, and pageview is recorded from day one, with no pre-tagging required. What I really value is the ability to define events retroactively, so if a drop-off surfaces in a funnel weeks after launch, I can still go back and analyze the exact interactions that led to it. Pair that with the ability to jump from a funnel step directly to a session replay of that moment, and you get a level of context that's hard to replicate elsewhere.
Heap Key Features
- Engagement Matrix: Visualizes user engagement levels across your product to help you spot which features drive retention and which go unused.
- Sense AI assistant: Generates summaries, answers follow-up questions, and surfaces insights from your analytics data through a conversational interface.
- Account-based analytics: Groups behavioral data by company or account so you can analyze usage patterns at the organizational level, not just the individual user level.
- Heap Activate: Sends behavioral data from Heap directly to customer engagement tools, enabling targeted in-app guides and email outreach based on actual user actions.
Heap Integrations
Heap offers Heap Connect for data warehouse syncing and Heap Activate for customer engagement tools. APIs are available for custom integrations.
Pros and Cons
Pros:
- Autocapture reduces engineering instrumentation work
- Funnel drop-offs connect directly to replays
- Retroactive event analysis needs no tagging
Cons:
- No native feature flags or experimentation
- Replay and heatmaps aren’t universally included
Learn more about Heap (by Contentsquare): 10Best for open-source, warehouse-native user tracking
PostHog
- Free plan available
- Pricing upon request
Visit WebsiteCustomer Rating:4.5/5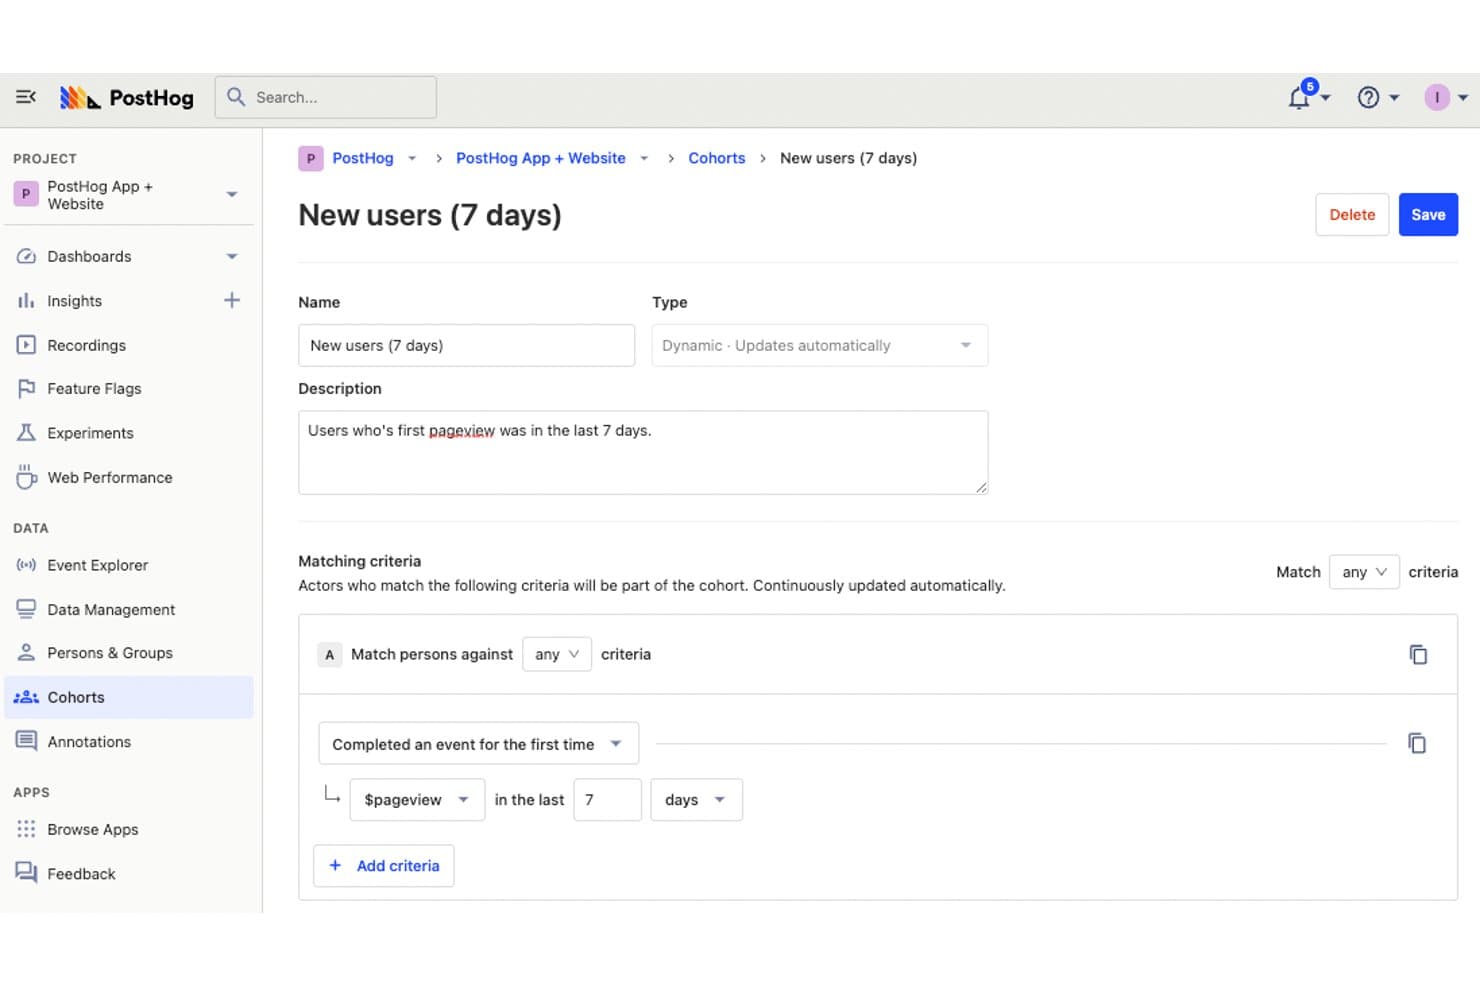
PostHog lets users define dynamic cohorts to track new users. PostHog is an open-source user tracking platform that combines product analytics, session replay, heatmaps, and funnel tracking with built-in feature flags, experimentation, and a warehouse-native data layer.
Who Is PostHog Best For?
PostHog is a strong fit for product and engineering teams that want full control over their data without piecing together separate analytics, replay, and experimentation tools.
Why I Picked PostHog
PostHog earns its spot on my shortlist because it's the only user tracking tool I've seen that combines session replay, heatmaps, and funnel analysis with a built-in data warehouse and a fully open-source codebase. I love that autocapture logs clicks, rage clicks, and scroll depth without any manual tagging, and that I can jump directly from a funnel drop-off to the session recordings behind it. The AI-powered replay summaries and MCP access let me cluster sessions by error or behavior pattern in seconds.
PostHog Key Features
- Correlation analysis: Automatically surfaces which user properties or behaviors are statistically linked to higher or lower conversion rates within your funnels.
- Feature flag integration in replays: Flags active during a session appear directly in the replay timeline, so you can filter recordings by A/B test group or feature rollout.
- CDP event transformation: Enriches, filters, renames, and scrubs PII from events as they arrive, then streams processed data to 50+ destinations in real time.
- SQL access via HogQL: Lets you query your event data directly with a PostHog-flavored SQL dialect, giving analytics and engineering teams full flexibility beyond preset report types.
PostHog Integrations
PostHog supports 50+ CDP destinations, including Slack, Braze, Customer.io, Salesforce, HubSpot, Vitally, Gainsight, PagerDuty, and webhooks. It also connects to Snowflake and BigQuery as warehouse sources and supports custom destinations.
Pros and Cons
Pros:
- Warehouse-native architecture supports SQL analysis
- Funnels link directly to session replays
- Autocapture reduces manual event tagging
Cons:
- Replay exports remain limited to JSON
- Developer-first workflows challenge nontechnical marketers
Learn more about PostHog:
Outro software de monitorização de utilizadores
Eis algumas opções adicionais de software de monitorização de utilizadores que não chegaram à minha lista restrita, mas que ainda vale a pena explorar:
- 11ContentsquareBest for revenue-tied behavior and journey analysis
- 12LogRocketBest for session replay tied to error context
- 13SemrushBest for competitor audience data and heatmaps
- 14UXCamBest for mobile app behavior tracking with AI
- 15UserpilotBest for SaaS behavior tracking and funnel analysis
- 16Lucky OrangeBest for real-time website behavior and AI insights
- 17Microsoft ClarityBest for free, unlimited behavioral data capture
How I Evaluate User Tracking Software
I split my evaluation into three parts, with core functionality carrying the most weight—I look for tools that capture granular user interactions and replay sessions reliably. From there, I assess standout features like autocapture instrumentation. Finally, I consider factors beyond features, like pricing scalability and compliance posture.
Core Functionality (Table Stakes For This List)
When I'm selecting tools for my list, I score each one on a scale from 0 (does not offer the functionality) to 5 (excels in this area) for each core functionality listed below. I then convert the total into a percentage to help assess each tool's overall fit, with extra weight on any functionalities I've deemed essential.
- Behavior Capture (Essential): I check whether the tool records clicks, scrolls, taps, and navigation paths across both web and app environments with enough granularity to reconstruct real user intent.
- Session Recording or Replay: Playback quality matters, so I evaluate filtering, retention windows, and whether sessions link to specific errors or events that help you pinpoint where users get stuck.
- Heatmap Visualization: I look for click, scroll, and movement heatmaps that can be filtered by segment or device so you can compare how mobile visitors interact versus desktop users on the same page.
- Event and Funnel Tracking: Multi-step funnel builders are where I focus. I evaluate whether you can define custom conversion sequences and spot exactly which step loses the most users during checkout or onboarding flows.
- User Data Segmentation: The ability to layer attributes like device type, referral source, and user cohort into a single filter set tells me whether a tool supports the kind of comparative analysis PMs actually need.
- Data Export or Integration: I check for native connections to tools like Mixpanel, Amplitude, Segment, and common data warehouses, plus whether export supports automated or real-time data flow rather than just manual CSV pulls.
Once I have a list of tools that meet the criteria, I consider what sets each platform apart.
Differentiating Factors (What Sets Vendors Apart)
Here's how I compare and contrast different vendors:
Standout Features
Autocapture instrumentation is the first thing I evaluate because it removes the need to manually tag every button, link, or form field. Tools like Heap and PostHog take different approaches here, and I look at how cleanly each one retroactively surfaces events you didn't plan for. I also check for AI session summarization, which flags rage clicks and dead-end flows so you're not scrubbing through hundreds of replays to find friction. Feature flagging paired with experimentation matters too—when a tool lets you roll out a change to a segment and measure behavioral impact in the same platform, you skip the context-switching between analytics and your testing stack.
Beyond Features
I evaluate how much engineering time each tool demands upfront. Some platforms, like Heap, autocapture events out of the box, while others need a custom event schema before you see any data. That gap matters when your team lacks dedicated data engineering support. Pricing scalability is just as important—usage-based models tied to monthly tracked users or event volume can spike costs fast as your product grows. I also check each vendor's compliance posture, looking at built-in PII redaction, consent management, and data residency options that affect whether you can ship session replay in regulated markets.
Como escolher software de monitorização de utilizadores
É fácil perder-se em listas longas de funcionalidades e estruturas de preços complexas. Para o ajudar a manter o foco enquanto realiza o seu processo único de seleção de software, eis uma lista de verificação dos fatores a ter em conta:
| Fator | O que considerar |
|---|---|
| FatorEscalabilidade | O que considerarA ferramenta acompanha o crescimento da sua equipa? Verifique se suporta um número crescente de utilizadores e dados sem degradar o desempenho. |
| FatorIntegrações | O que considerarCertifique-se de que estabelece ligação com as ferramentas que já utiliza. Procure integrações nativas com o seu CRM, plataformas de análise e outro software essencial. |
| FatorPersonalização | O que considerarPode adaptar o software aos seus fluxos de trabalho? Verifique se é possível personalizar painéis, relatórios e definições de utilizador de acordo com as suas necessidades. |
| FatorFacilidade de utilização | O que considerarA interface é intuitiva? Teste se os membros da equipa conseguem aprender rapidamente a utilizar e navegar na plataforma sem formação extensiva. |
| FatorImplementação e integração inicial | O que considerarQuanto tempo demorará a começar? Avalie os recursos disponíveis, como tutoriais e suporte, bem como o tempo de configuração necessário. |
| FatorCusto | O que considerarEstá dentro do seu orçamento? Compare os planos de preços, verifique se existem custos ocultos e avalie se a ferramenta oferece um bom retorno do investimento. |
| FatorMedidas de segurança | O que considerarProtege os seus dados? Verifique se cumpre as normas do setor, se oferece encriptação de dados e se dispõe de uma política de privacidade clara. |
| FatorDisponibilidade do suporte | O que considerarPode obter ajuda quando necessário? Procure suporte 24 horas por dia, 7 dias por semana, vários métodos de contacto e uma equipa de suporte ágil para ajudar a sua equipa. |
O que é software de monitorização de utilizadores?
O software de monitorização de utilizadores é uma ferramenta que acompanha e analisa o que as pessoas fazem em websites, aplicações ou outras plataformas digitais. Os profissionais de marketing, gestores de produto e designers de UX utilizam-no para ver como os visitantes navegam no site, onde clicam ou onde ficam bloqueados. Estas informações ajudam a identificar o que precisa de ser corrigido, testar novas ideias e tomar decisões mais inteligentes para manter os utilizadores envolvidos.
Funcionalidades
Ao selecionar software de monitorização de utilizadores, tenha em atenção as seguintes funcionalidades essenciais:
- Mapas de calor: Visualize onde os utilizadores clicam, fazem deslocamento e concentram a atenção, ajudando a compreender o comportamento dos utilizadores no seu site.
- Repetições de sessões: Reproduza as interações dos utilizadores para identificar problemas de usabilidade e melhorar a experiência do utilizador.
- Funis de conversão: Acompanhe os percursos dos utilizadores para ver onde abandonam o processo de conversão.
- Recolha de feedback dos utilizadores: Recolha opiniões diretamente dos utilizadores através de inquéritos e sondagens para tomar decisões informadas.
- Análise em tempo real: Aceda a dados em direto para monitorizar a atividade dos utilizadores e responder rapidamente às alterações.
- Painéis personalizáveis: Adapte os painéis para apresentar as métricas mais importantes para a sua equipa.
- Segmentação avançada: Filtre e segmente os utilizadores com base no comportamento ou nos atributos, para uma análise direcionada.
- Monitorização da velocidade das páginas: Meça a rapidez com que o seu site carrega para otimizar o desempenho e melhorar a satisfação dos utilizadores.
- Monitorização de transações: Simule as interações dos utilizadores para testar e garantir a funcionalidade do website.
- Análise da causa-raiz: Identifique e diagnostique problemas que afetam o desempenho do site para implementar soluções eficazes.
Vantagens
A implementação de software de monitorização de utilizadores proporciona várias vantagens para a sua equipa e para a sua empresa. Eis algumas das que pode esperar:
- Melhoria da experiência do utilizador: Ao analisar mapas de calor e repetições de sessões, pode identificar e corrigir problemas de usabilidade, proporcionando uma experiência do utilizador mais fluida.
- Aumento das taxas de conversão: Os funis de conversão ajudam a compreender onde os utilizadores abandonam o processo, permitindo otimizar os percursos e aumentar as conversões.
- Decisões baseadas em dados: A análise em tempo real e a recolha de feedback dos utilizadores permitem à sua equipa tomar decisões informadas com base no comportamento real dos utilizadores.
- Resolução mais rápida de problemas: A análise da causa-raiz ajuda a identificar e resolver rapidamente problemas de desempenho, minimizando os períodos de inatividade e as interrupções.
- Maior envolvimento: Com a segmentação avançada, pode adaptar o conteúdo e as interações a grupos específicos de utilizadores, melhorando o envolvimento e a satisfação.
- Otimização do desempenho: A monitorização da velocidade das páginas fornece informações sobre os tempos de carregamento, ajudando a otimizar o desempenho do site para aumentar a satisfação dos utilizadores.
Custos & preços
A seleção de software de monitorização de utilizadores exige uma compreensão dos vários modelos de preços e planos disponíveis. Os custos variam consoante as funcionalidades, o tamanho da equipa, os complementos e outros fatores. As equipas que pretendam minimizar os custos iniciais podem comparar software gratuito de monitorização de utilizadores antes de aderirem a um plano pago.
A tabela abaixo resume os planos comuns, os respetivos preços médios e as funcionalidades normalmente incluídas nas soluções de software de monitorização de utilizadores:
Tabela de comparação de planos de software de monitorização de utilizadores
| Tipo de plano | Preço médio | Funcionalidades comuns |
|---|---|---|
| Tipo de planoPlano gratuito | Preço médio$0 | Funcionalidades comunsMapas de calor básicos, repetições de sessões limitadas e recolha de feedback dos utilizadores. |
| Tipo de planoPlano pessoal | Preço médio$5-$25/utilizador/mês | Funcionalidades comunsMapas de calor avançados, repetições de sessões, funis de conversão e análise básica. |
| Tipo de planoPlano empresarial | Preço médio$50-$150/utilizador/mês | Funcionalidades comunsAnálise em tempo real, segmentação avançada, painéis personalizáveis e alertas. |
| Tipo de planoPlano empresarial avançado | Preço médio$200-$500/utilizador/mês | Funcionalidades comunsPersonalização completa, suporte prioritário, gestor de conta dedicado e acesso completo à API. |
Perguntas frequentes sobre software de monitorização de utilizadores
Eis algumas respostas a perguntas comuns sobre software de monitorização de utilizadores:
O software de monitorização de utilizadores pode afetar o desempenho do site?
Sim, o software de monitorização de utilizadores pode afetar o desempenho do site se não for implementado corretamente. É essencial escolher ferramentas leves que não tornem os tempos de carregamento mais lentos. Considere utilizar scripts de monitorização assíncronos e analisar regularmente as métricas de desempenho para garantir que o seu site continua rápido e responsivo para os utilizadores.
Os dados dos utilizadores recolhidos pelo software de monitorização são seguros?
Sim, o software de monitorização de utilizadores de fornecedores reputados dá prioridade à segurança dos dados. Muitas vezes, utiliza encriptação e cumpre regulamentações de proteção de dados, como o RGPD. Verifique sempre a política de privacidade e as medidas de segurança do software para garantir que os dados dos seus utilizadores são tratados de forma responsável e segura pelo fornecedor.
Como pode garantir que os dados de monitorização dos utilizadores continuam a ser úteis?
Defina objetivos claros sobre o que precisa de aprender antes de recolher quaisquer dados. Analise os resultados com frequência para detetar tendências e remover informações desatualizadas ou irrelevantes. Partilhe os conhecimentos obtidos com a sua equipa num formato utilizável para orientar a tomada de decisões práticas.
Que erros comuns devem as equipas evitar ao utilizar software de monitorização de utilizadores?
Evite recolher dados sem objetivos ou contexto definidos. Por vezes, as equipas esquecem-se de validar se as etiquetas e configurações de monitorização funcionam conforme previsto. Outro erro frequente é não analisar nem limpar dados redundantes ou imprecisos, o que pode causar confusão mais tarde.