

Com tantas soluções diferentes de relatórios visuais disponíveis, é difícil perceber qual é a mais adequada para si. Sabe que quer transformar conjuntos de dados complexos em apresentações claras e visualmente apelativas, que lhe permitam extrair informações sobre os utilizadores num instante, mas precisa de descobrir qual é a melhor ferramenta para o trabalho. Eu ajudo! Nesta publicação, vou facilitar a sua escolha, partilhando as minhas experiências pessoais na utilização de dezenas de ferramentas diferentes com grandes equipas e projetos diversificados, juntamente com as minhas escolhas das melhores ferramentas de relatórios visuais.
Why Trust Our Software Recommendations
6,700+
Reviews
20
Industry experts
16+
Evaluation factors
14
Years
Our team has been testing and reviewing software since 2012. As product managers ourselves, we know how difficult—and important—it is to choose the right software.
For this guide, we evaluated tools using hands-on testing and independent research, scoring tools using our selection criteria.
Our reviews reflect our human editorial judgment, not a sales pitch.
Expert reviewers:
- Andrew LumbySenior TPM
- Cristiano ValimSenior UI/UX Lead


Tabela comparativa: ferramentas de relatórios visuais
Esta tabela comparativa resume os detalhes de preços das minhas principais escolhas de ferramentas de relatórios visuais.
| Tool | Best For | Trial Info | Price | ||
|---|---|---|---|---|---|
| 1 | Best for custom business intelligence data segmentation | 15-day free trial | From $30/month (billed annually) | Website | |
| 2 | Best for enterprise-scale narrative dashboarding | 14-day free trial | Pricing upon request | Website | |
| 3 | Best for AI-driven KPI alerts and summaries | Free plan + 14-day free trial + free demo available | From $71/month (billed annually) | Website | |
| 4 | Best for credit-based analytics across all users | 30-day free trial | Pricing upon request | Website | |
| 5 | Best for SAP-native enterprise data visualization | Free demo available | Pricing upon request | Website | |
| 6 | Best for visual product analytics with AI insights | Free plan available | Pricing upon request | Website | |
| 7 | Best for DAX-powered custom product KPI reports | 30-day free trial | From $14/user/month (billed annually) | Website | |
| 8 | Best for free visual reports on Google data | Free plan available | Free to use | Website | |
| 9 | Best for associative data exploration at scale | 30-day free trial | Pricing upon request | Website | |
| 10 | Best for open-source BI with governed AI queries | 14-day free trial + free plan available | From $100/month | Website |


Análises das melhores ferramentas de relatórios visuais
Abaixo encontram-se os meus resumos detalhados das melhores ferramentas de relatórios visuais que entraram na minha lista restrita. As minhas análises oferecem uma visão detalhada das principais funcionalidades, vantagens e desvantagens, integrações e casos de utilização ideais de cada ferramenta, para o ajudar a encontrar a melhor opção para si.
 Best for custom business intelligence data segmentation
- 15-day free trial
- From $30/month (billed annually)
Visit WebsiteCustomer Rating:4.3/5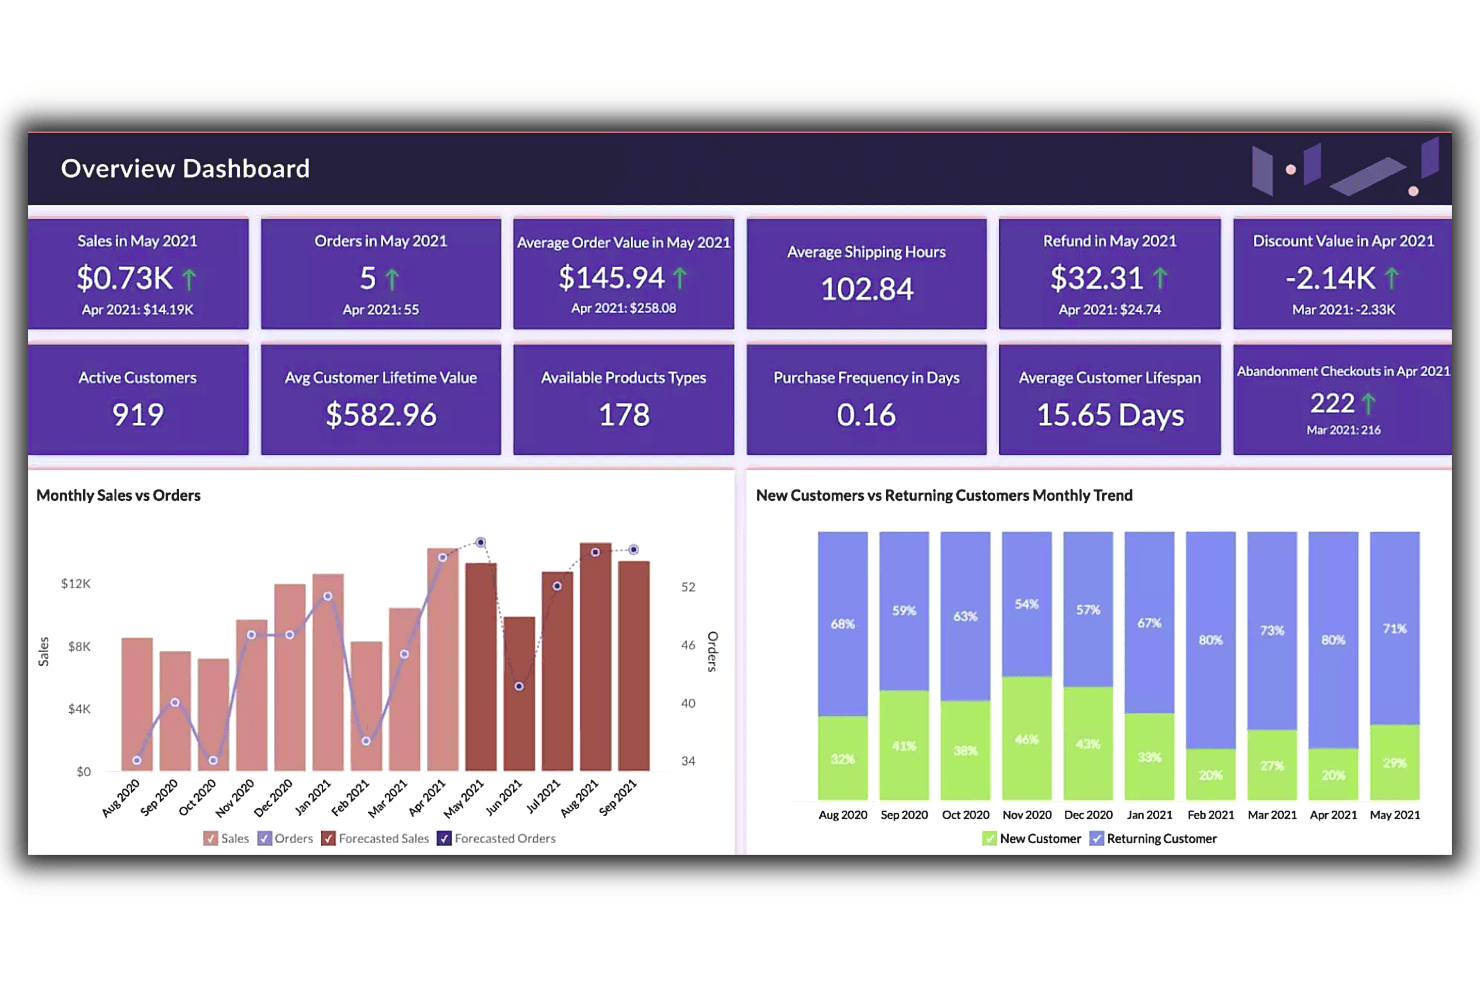
Zoho’s overview dashboard feature provides an at-a-glance view of essential data, letting users effectively compare trends and generate insights faster. Zoho Analytics is a business intelligence and visual reporting platform that combines 80+ chart types, drag-and-drop dashboards, AI-powered insights through Ask Zia, and 250+ data source connectors into a single analytics suite.
Who Is Zoho Analytics Best For?
Zoho Analytics is a strong fit for BI analysts and operations teams who need to segment and visualize data across multiple sources without relying on a dedicated data engineering team.
Why I Picked Zoho Analytics
I picked Zoho Analytics as one of the best because its custom segmentation capabilities let you slice BI data in ways most visual reporting tools don't support out of the box. I especially like the formula engine for building custom KPIs and the SQL query tables, which let you define precise data cuts without needing a data engineer. Ask Zia's anomaly detection and forecasting layer on top of those custom segments means you're not just viewing sliced data—you're getting automatic alerts when a segmented metric moves unexpectedly.
Zoho Analytics Key Features
- Ask Zia AI insights: A natural language interface that lets you ask data questions in plain language and returns automatic summaries, forecasts, and anomaly alerts.
- White-label embedded BI: Publish dashboards under your own brand via SSO or SAML, with custom themes available in the cloud or on-premise.
- 80+ chart types: A visualization library spanning geo maps, funnels, pivot tables, histograms, and image-based custom visuals.
- Scheduled email delivery: Automatically send reports to stakeholders on a recurring schedule, with up to 100 schedules on Enterprise plans.
Zoho Analytics Integrations
Zoho Analytics offers 250+ data sources and 50+ prebuilt business-app connectors, including Jira, Salesforce, Shopify, Zendesk, Zoho CRM, Google Drive, PostgreSQL, MySQL, and Amazon S3. APIs support custom imports, embedded reports, and integrations.
Pros and Cons
Pros:
- Dashboards support branded stakeholder presentations
- Ask Zia flags anomalies in KPI trends
- Custom KPIs segment product metrics precisely
Cons:
- Product analytics workflows lack native depth
- Large datasets can cause report lag
Learn more about Zoho Analytics: Best for enterprise-scale narrative dashboarding
- 14-day free trial
- Pricing upon request
Visit WebsiteCustomer Rating:4.5/5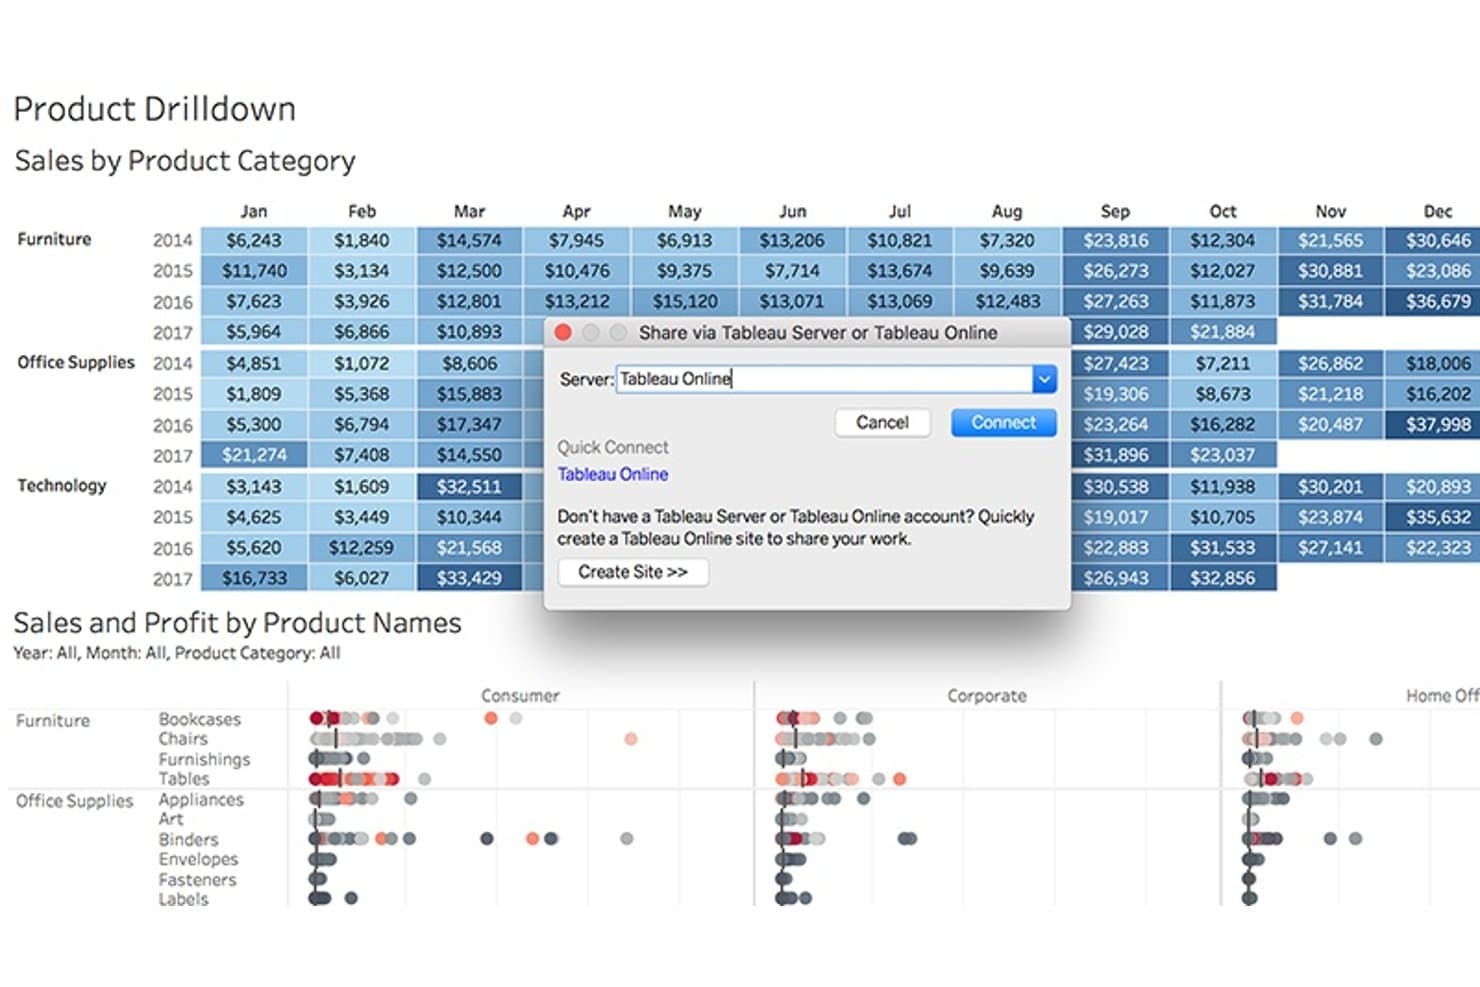
Tableau lets users publish product sales dashboards directly to Tableau Online. Tableau is a business intelligence and data visualization platform that lets you build interactive dashboards, connect multiple data sources, and share narrative-style reports through drag-and-drop authoring, calculated fields, and AI-generated metric insights via Tableau Pulse.
Who Is Tableau Best For?
Tableau is the right fit for BI analysts and enterprise teams who need to build, govern, and share complex dashboards across a large organization.
Why I Picked Tableau
Tableau earns its spot as one of the best on my shortlist because no other tool I've used matches its ability to turn complex data into a structured narrative at enterprise scale. I love how the Stories feature lets you sequence multiple dashboard views into a single, flowing presentation, which is exactly what you need when walking stakeholders through a product performance review. Tableau Pulse layers on top of that by surfacing AI-generated metric digests with natural-language explanations, delivered directly to Slack or Teams.
Tableau Key Features
- Data source connectivity: Connect to cloud data warehouses like Snowflake, BigQuery, and Redshift, plus SaaS tools like Salesforce and Google Analytics, in a single workbook.
- Calculated fields and LOD expressions: Define custom KPIs like activation rate or retention directly in your workbook using Tableau's formula language.
- Interactive dashboard actions: Let stakeholders filter, highlight, or drill down across views by clicking directly on charts within a published dashboard.
- Device-specific dashboard layouts: Design separate layouts for desktop, tablet, and mobile so dashboards render cleanly for any audience.
Tableau Integrations
Tableau offers native data connectors for Snowflake, BigQuery, Redshift, Databricks, Salesforce, Google Analytics, and SQL Server. Slack and Microsoft Teams support Tableau Pulse delivery, while REST, Metadata, and Embedding APIs support custom integrations.
Pros and Cons
Pros:
- Interactive filters help stakeholders explore performance drivers
- Flexible KPI calculations support nuanced product analysis
- Narrative dashboards clarify complex product trends
Cons:
- Large datasets can slow dashboard performance
- Advanced analysis requires substantial BI expertise
Learn more about Tableau: Best for AI-driven KPI alerts and summaries
- Free plan + 14-day free trial + free demo available
- From $71/month (billed annually)
Visit WebsiteCustomer Rating:4.5/5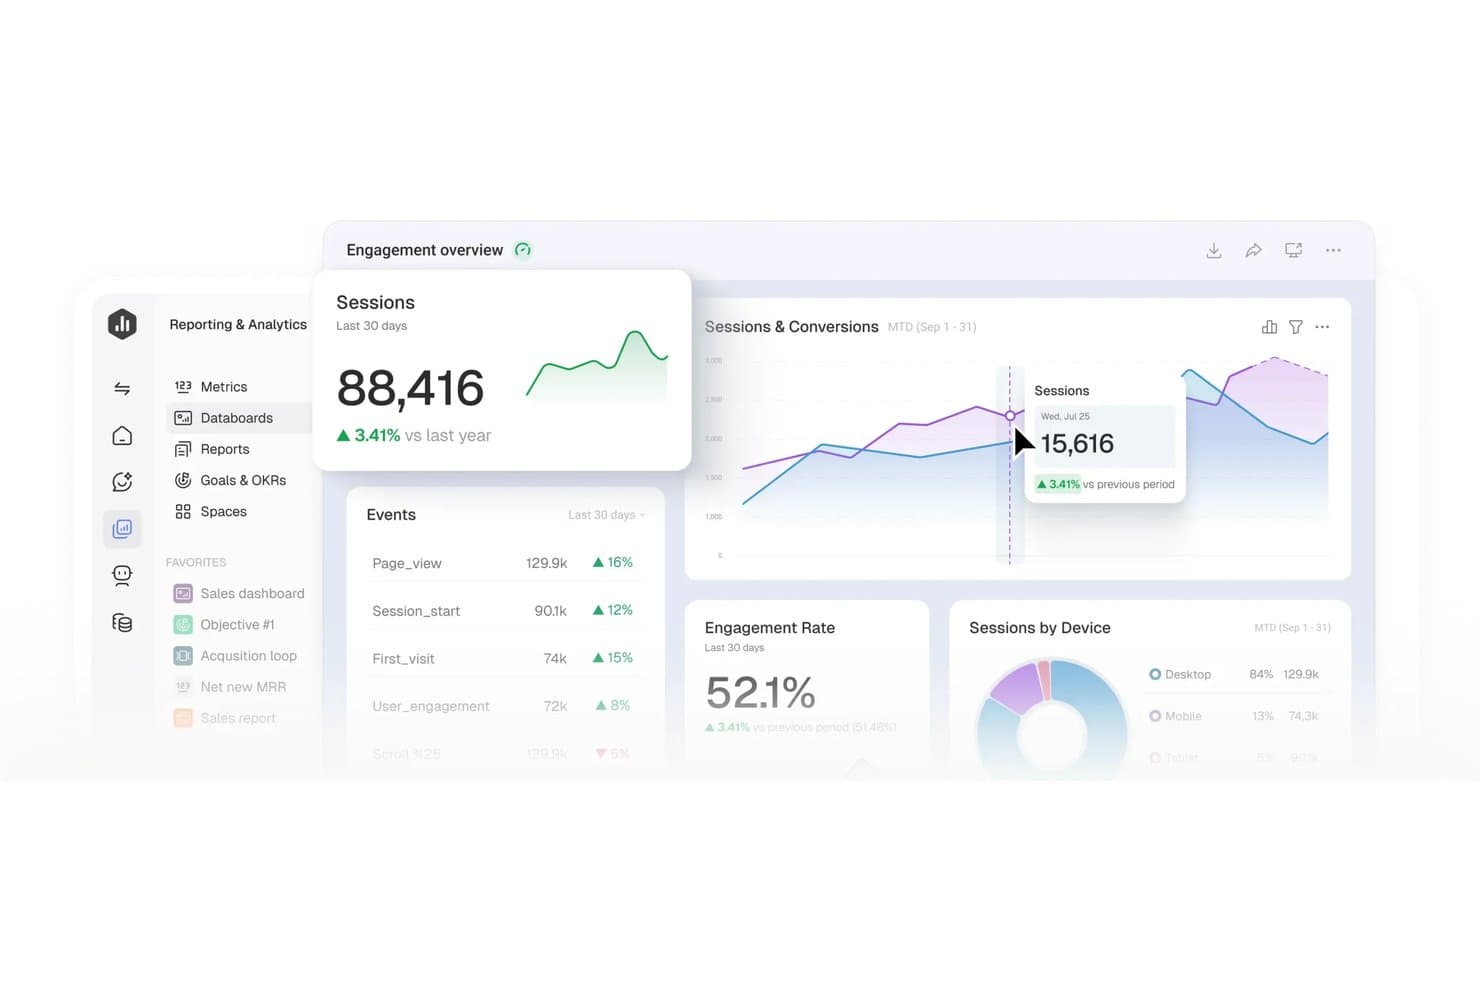
Databox centralizes product metrics into visual, real-time dashboards. Databox is a no-code dashboard and reporting platform that connects 130+ data sources and turns them into visual dashboards, automated reports, and AI-generated performance summaries.
Who Is Databox Best For?
Databox is a strong fit for marketing, sales, and operations teams that need automated client reporting and AI-driven KPI alerts without writing a single line of code.
Why I Picked Databox
I've included Databox in my top picks because its AI-driven anomaly detection and automated performance summaries genuinely change how fast you can act on KPI shifts. Genie, its AI analyst, doesn't just surface a metric drop—it explains what drove the change and suggests next steps, which I find far more useful than a static alert. Paired with scheduled scorecards that recap up to 15 metrics daily or weekly, your team stays informed without building a single manual report.
Databox Key Features
- Genie AI dashboard builder: Describe the dashboard you need in plain language and Genie builds it for you, including the metrics and layout.
- 130+ native integrations: Connect sources like GA4, Salesforce, Mixpanel, Jira Cloud, Shopify, and BigQuery, plus 350+ more via Dataddo.
- Custom calculated metrics: Build cross-source metrics like ROAS, conversion rates, or revenue per order using filters and formulas, no SQL needed.
- Mobile and TV dashboard viewing: Access interactive dashboards on iOS, Android, and Apple Watch, or stream them to office TVs.
Databox Integrations
Databox offers 130+ native integrations, including Jira Cloud, Mixpanel, Airtable, Google Sheets, BigQuery, Snowflake, MySQL, and PostgreSQL. It also supports custom connections through a no-code REST API connector, Ingestion API, Databox REST API, Dataddo, Zapier, and Make.
Pros and Cons
Pros:
- Mobile dashboards support product reviews anywhere
- Scheduled summaries reduce manual stakeholder reporting
- Genie explains KPI changes and suggests actions
Cons:
- Advanced product analysis requires careful metric setup
- Refreshes aren’t continuous by default
Learn more about Databox: 4Best for credit-based analytics across all users
Domo
- 30-day free trial
- Pricing upon request
Visit WebsiteCustomer Rating:4.4/5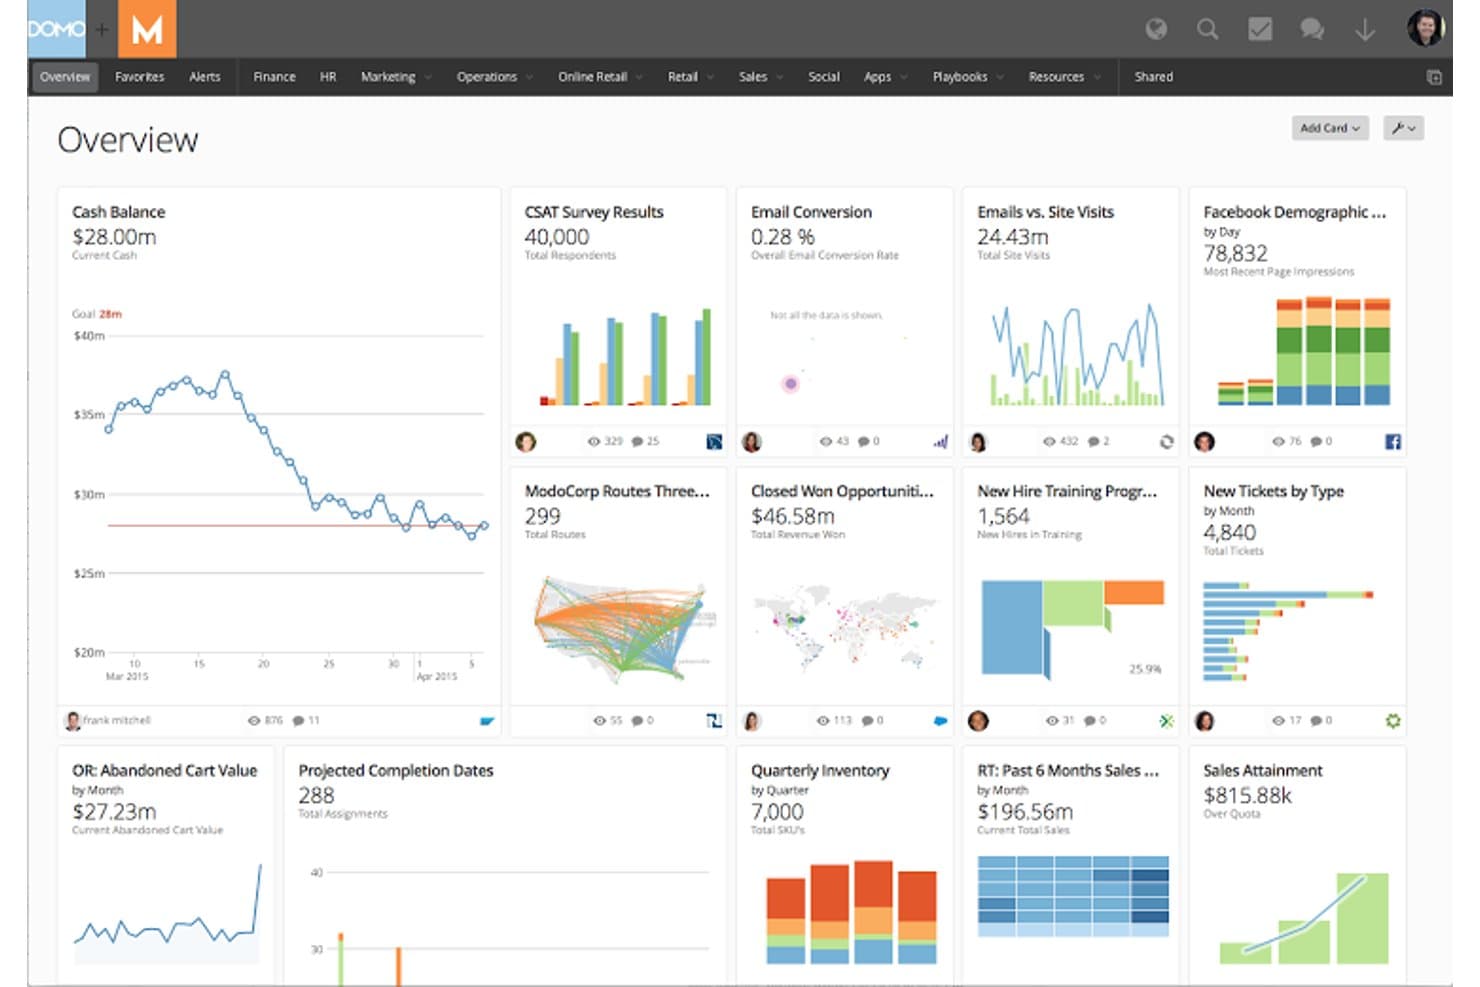
Domo centralizes business metrics into a single visual dashboard. Domo is a business intelligence and analytics platform that brings together data integration, ETL, 150+ chart types, drag-and-drop dashboards, and embedded reporting in a single environment.
Who Is Domo Best For?
Domo is a strong fit for enterprise product and operations teams that need to give every user access to analytics without managing per-seat licensing costs.
Why I Picked Domo
I've included Domo in my top picks because its credit-based pricing model means you can roll out analytics to every person on your team without per-seat costs adding up. I especially like Beast Mode, which lets you define custom product metrics directly on top of your data without touching the source. Pair that with unlimited dashboards and no-code drag-and-drop building, and product teams can publish trusted, stakeholder-ready views without waiting on a BI team.
Domo Key Features
- Beast Mode manager: A central library where you can define, store, and reuse custom calculated metrics across all your dashboards without altering source data.
- Magic ETL pipeline builder: A no-code, drag-and-drop interface for cleaning, joining, and reshaping data from multiple sources before it reaches your visuals.
- Domo Embed with white-labeling: Embeds live dashboards into external products or client portals with custom branding, role-based filtering, and two-way interactive controls.
- Federated queries: Runs live queries directly against your existing data warehouse (Snowflake, BigQuery, etc.) without copying data into Domo's storage.
Domo Integrations
Domo offers 1,000+ connectors, including Salesforce, Google Analytics, Snowflake, BigQuery, Redshift, and Databricks. It also supports Excel, CSV, SFTP, APIs, webhooks, Workbench, and Java and Python SDKs for custom integrations.
Pros and Cons
Pros:
- White-labeled embeds extend customer-facing analytics
- Unlimited dashboards support broad stakeholder reporting
- Custom metrics clarify product performance
Cons:
- Credit usage complicates high-frequency data refreshes
- Complex navigation slows first-time dashboard builders
Learn more about Domo: Best for SAP-native enterprise data visualization
- Free demo available
- Pricing upon request
Visit WebsiteCustomer Rating:4.3/5
Bring together analytics and planning using SAP Analytics Cloud. SAP Analytics Cloud is a business intelligence and planning platform that combines dashboard creation, AI-generated insights, and data visualization across a wide range of chart types and interactive stories.
Who Is SAP Analytics Cloud Best For?
SAP Analytics Cloud is a strong fit for enterprise teams already running SAP systems who need to combine BI, planning, and data visualization in one place.
Why I Picked SAP Analytics Cloud
SAP Analytics Cloud earns its spot on my shortlist because it's the strongest option I've found for enterprise teams already running SAP systems who need serious data visualization without exporting data into a separate tool. I especially like Smart Insights, which automatically surfaces top contributors and variance explanations alongside any chart, so your stakeholders get context without you having to build it manually. Live connections to S/4HANA and BW mean your dashboards reflect current data, not a yesterday's snapshot.
SAP Analytics Cloud Key Features
- Trellis views: Split any chart into small-multiple panels to compare segments, regions, or product lines side by side in a single story page.
- Scheduled publication: Automatically deliver stories to stakeholders via email as PDF or PowerPoint on a recurring schedule, no SAP account required to receive them.
- Smart Discovery: Runs machine-learning analysis on your dataset to surface hidden drivers and patterns without you needing to build the queries manually.
- Analytics Designer: Build custom, scripted analytic applications on top of your data models for more tailored dashboard experiences beyond standard story layouts.
SAP Analytics Cloud Integrations
SAP Analytics Cloud offers native integrations with SAP HANA, SAP S/4HANA, SAP BW, SAP Datasphere, Google BigQuery, Snowflake, and Google Drive. It also supports OData, CSV, and XLSX connections, plus REST APIs for custom integrations.
Pros and Cons
Pros:
- Scheduled exports support executive readouts
- Trellis views compare segments side by side
- Custom KPI formulas suit product scorecards
Cons:
- Advanced reporting requires modeling or scripting skills
- Story migration can disrupt established dashboards
Learn more about SAP Analytics Cloud: Best for visual product analytics with AI insights
- Free plan available
- Pricing upon request
Visit WebsiteCustomer Rating:4.5/5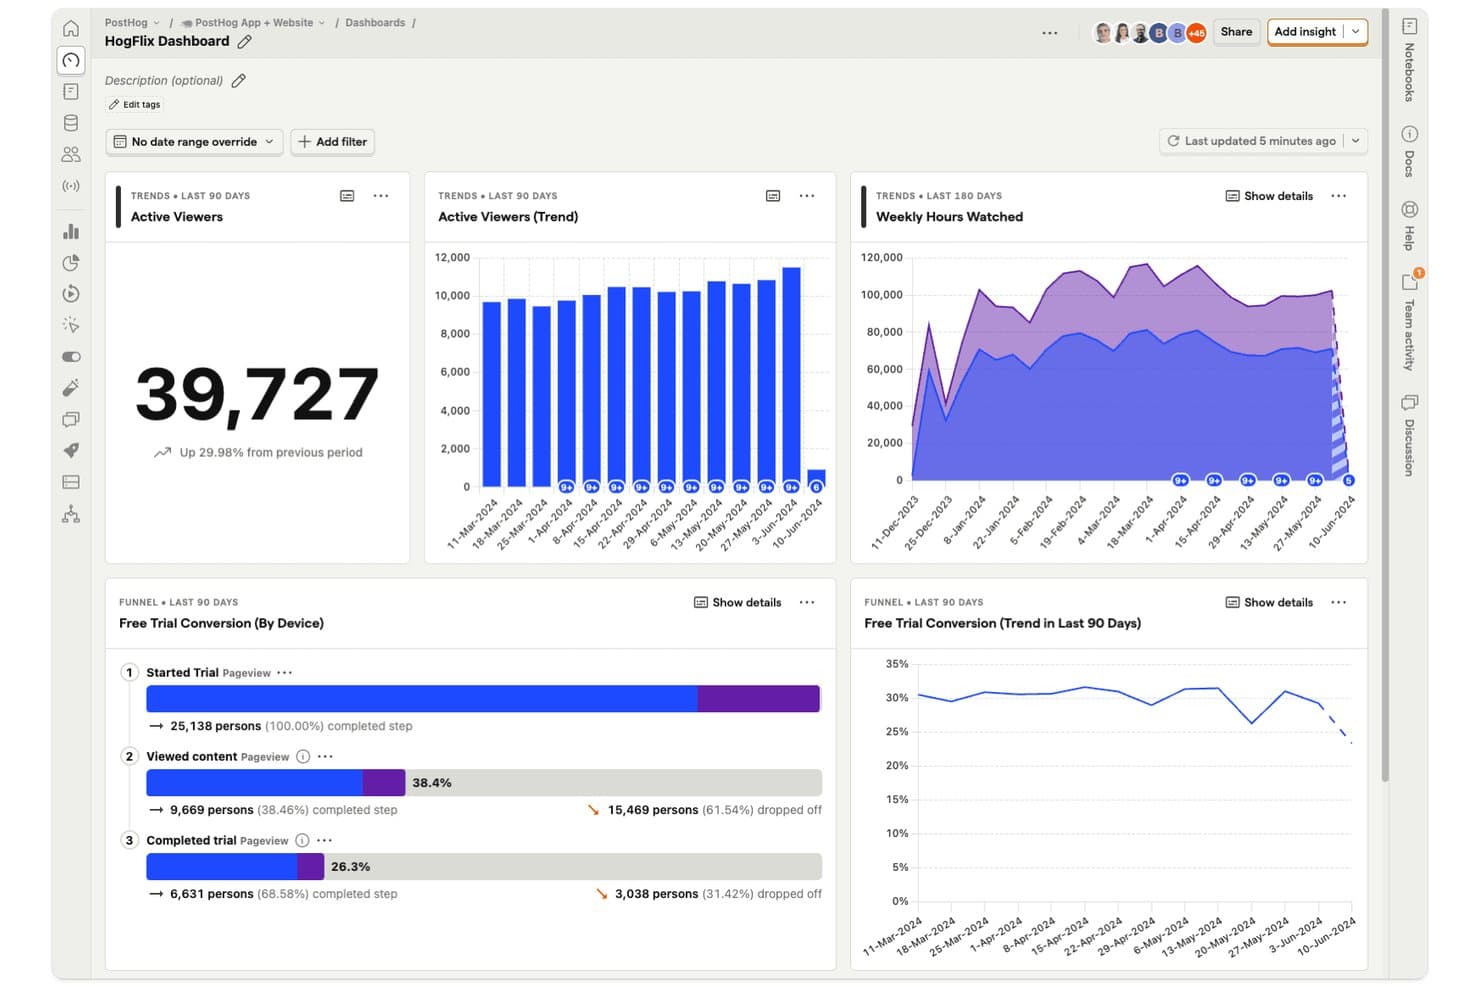
PostHog dashboards let product managers track viewer trends and funnel conversions in one view. PostHog is a product analytics platform that combines event tracking, visual dashboards, funnels, retention analysis, and SQL-based reporting with an integrated data warehouse for querying product and business data in one place.
Who Is PostHog Best For?
PostHog is a strong fit for product and engineering teams that want event-based analytics, AI-assisted insights, and dashboard sharing without managing separate tools.
Why I Picked PostHog
I've included PostHog in my top picks because its AI-assisted analytics go beyond surface-level charts. When I ask "why did signups drop?" directly in the dashboard, PostHog AI runs correlation analysis and surfaces the likely cause without me writing a single query. I also love the AI refresh analysis, which automatically flags spikes, drops, and trend reversals after a dashboard refresh, something I haven't seen done this cleanly elsewhere.
PostHog Key Features
- Semantic layer metrics: Define a single approved version of each metric (like MRR or activation rate) with an owner, an approval workflow, and a drift flag when the source changes.
- Dashboard subscriptions: Send insights or dashboards to email or Slack on a daily, weekly, or custom schedule, with optional AI-written summaries of what changed.
- Breakdown analysis: Slice any insight by event, person, session, feature flag, or cohort properties, with support for up to three breakdowns on trend charts.
- Terraform-managed dashboards: Export and manage dashboards and insights as code using a native Terraform integration and a one-click "Manage with Terraform" button.
PostHog Integrations
PostHog offers hundreds of integrations, including Snowflake, BigQuery, Redshift, Databricks, Stripe, Salesforce, HubSpot, Jira, Google Analytics, and Shopify. It also supports REST and query APIs, webhooks, Airbyte, and Fivetran for custom connectivity.
Pros and Cons
Pros:
- Dashboards support subscriptions, embeds, and APIs
- Warehouse joins connect product and business data
- AI explains sudden product metric changes
Cons:
- Shared dashboards refresh slower than live events
- Technical setup can confuse nontechnical stakeholders
Learn more about PostHog: Best for DAX-powered custom product KPI reports
- 30-day free trial
- From $14/user/month (billed annually)
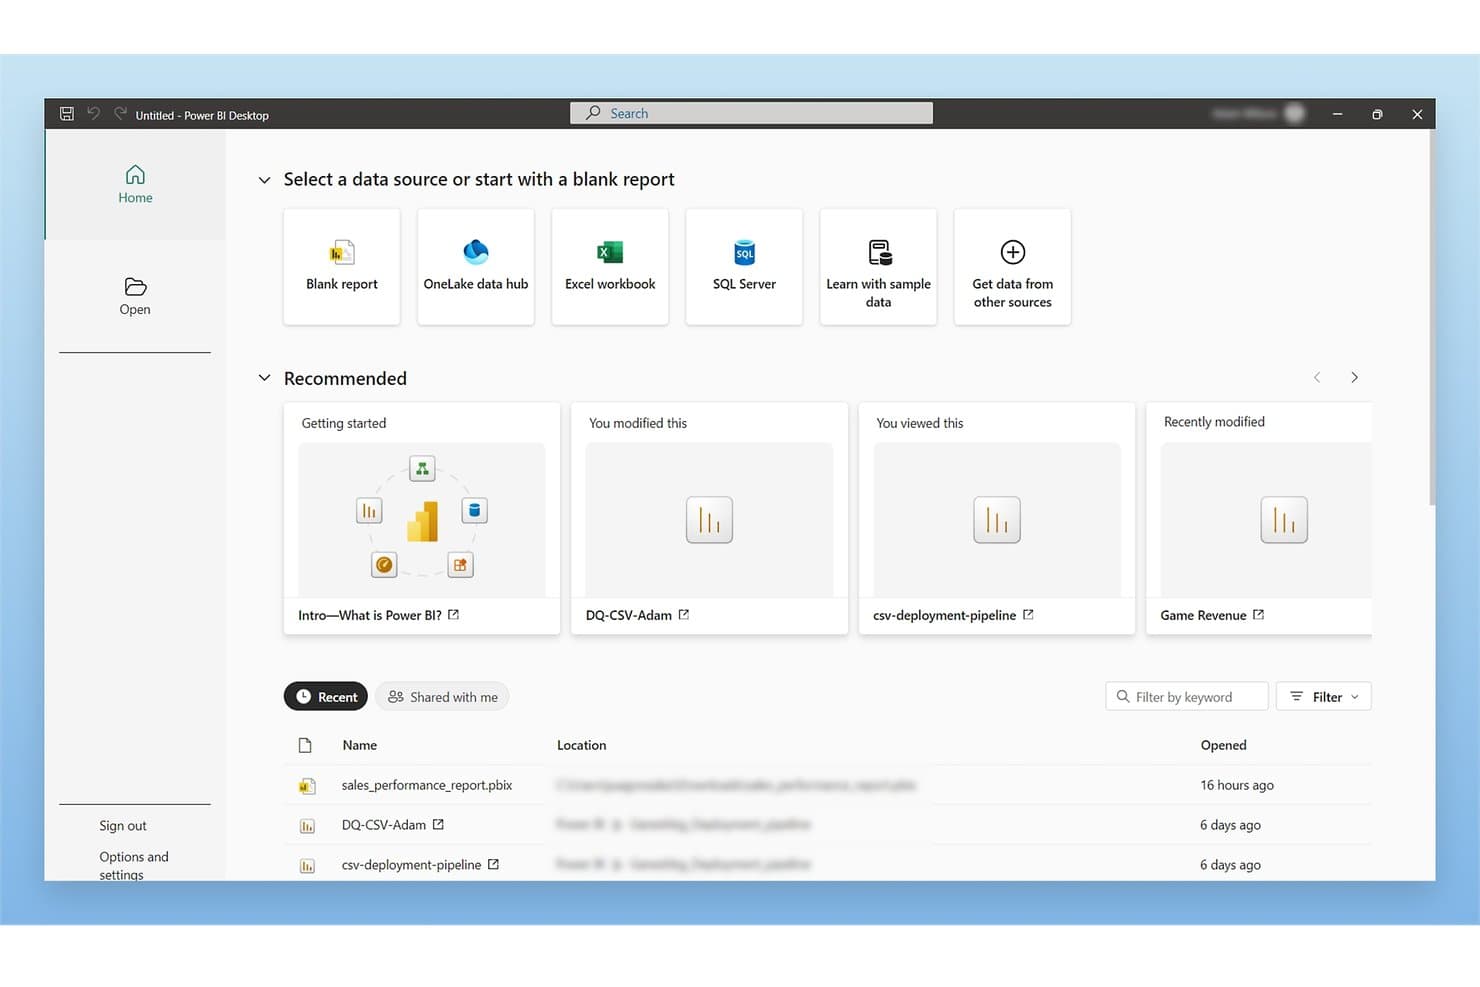
Microsoft Power BI lets users connect to multiple data sources from one home screen. Microsoft Power BI is a business intelligence and data visualization platform that lets you connect to hundreds of data sources, build interactive dashboards and multi-page reports, and analyze product metrics using DAX custom measures, AI-generated insights, and automated data refresh.
Who Is Microsoft Power BI Best For?
Microsoft Power BI is a strong fit for BI analysts and product managers who are already working within the Microsoft ecosystem and need to build custom KPI reports with precise, formula-driven metrics.
Why I Picked Microsoft Power BI
I picked Microsoft Power BI as one of the best because its DAX formula language lets you build precisely calculated KPI measures that go well beyond what standard chart tools offer. For example, you can write a DAX measure that calculates rolling 90-day retention or week-over-week feature adoption, then pin it to a dashboard that refreshes automatically. I also like that Copilot can generate and debug DAX queries, which cuts the time it takes to get a custom metric from idea to live report.
Microsoft Power BI Key Features
- Anomaly detection: Automatically flags unusual data points on line charts and explains the likely contributing factors in plain language.
- Power Query connector library: Connects to hundreds of data sources—including databases, files, and business apps—through a single data transformation interface.
- Mobile-optimized report layouts: Lets you design separate dashboard layouts for iOS and Android apps, either manually or with an auto-create option.
- Power BI Embedded: Lets you embed branded, interactive reports directly into your own customer-facing apps without requiring end users to hold a Power BI license.
Microsoft Power BI Integrations
Power BI offers hundreds of documented Power Query connectors, including Microsoft 365, Azure, Dynamics 365, Salesforce, Google Analytics, SQL Server, Snowflake, and Mixpanel (Beta). REST APIs and Power BI Embedded support custom integrations.
Pros and Cons
Pros:
- Automated refresh reduces manual reporting work
- Interactive filtering reveals cross-functional metric patterns
- DAX supports precise product KPI definitions
Cons:
- Large datasets can slow complex reports
- DAX and modeling require specialist support
Learn more about Microsoft Power BI: Best for free visual reports on Google data
- Free plan available
- Free to use
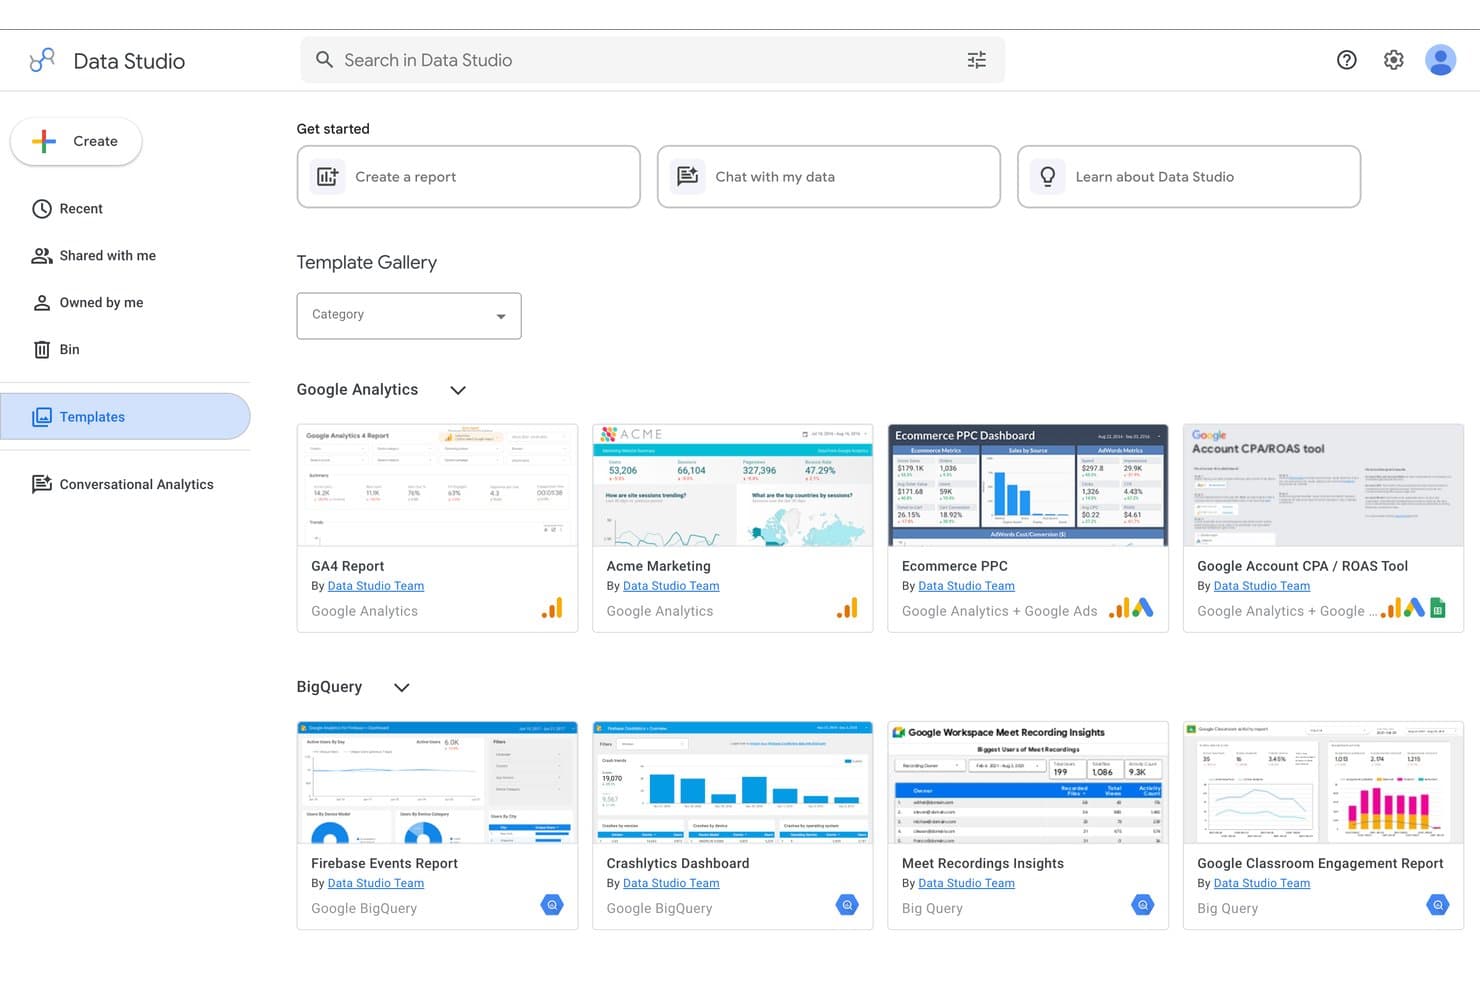
Google Data Studio offers pre-built templates for quick report creation. Google Data Studio (formerly Looker Studio) is a free visual reporting and dashboard tool that lets you connect data sources, build interactive charts, and share reports across your team.
Who Is Google Data Studio Best For?
Google Data Studio is a strong fit for product managers and analysts who already live in the Google ecosystem and need to build dashboards without a dedicated BI team.
Why I Picked Google Data Studio
Google Data Studio earns its spot on my shortlist because it's the only free tool that gives you native, zero-config connections to Google Analytics, Google Ads, BigQuery, and Search Console in one canvas. I love that you can blend up to five sources in a single chart, so I can layer acquisition data from Ads alongside product usage trends from Analytics without writing a line of SQL. Conversational Analytics, which became generally available in mid-2026, lets me ask plain-language questions against BigQuery data agents and get visual answers instantly.
Google Data Studio Key Features
- Cross-filtering: Clicking a value in one chart instantly filters all other charts on the page, letting you explore product data without manually adjusting controls.
- Calculated fields: Build custom metrics using math, CASE logic, and regex functions directly on a data source or individual chart, no SQL required.
- Row-level security: Filter data by viewer email address so each stakeholder sees only the product data relevant to their role.
- Version history: View, restore, or delete earlier versions of any report or data source to track how your dashboards have changed over time.
Google Data Studio Integrations
Google Data Studio connects to 1,400+ data sources, including native integrations with BigQuery, Google Analytics, Google Sheets, Search Console, and YouTube Analytics. It also supports 1,300+ community connectors and an API for custom integrations.
Pros and Cons
Pros:
- Blends five sources into one dashboard
- Calculated fields support custom product KPIs
- Cross-filtering reveals relationships across product metrics
Cons:
- Embedded reports retain an unwanted watermark
- Cached updates limit real-time product monitoring
Learn more about Google Data Studio: Best for associative data exploration at scale
- 30-day free trial
- Pricing upon request
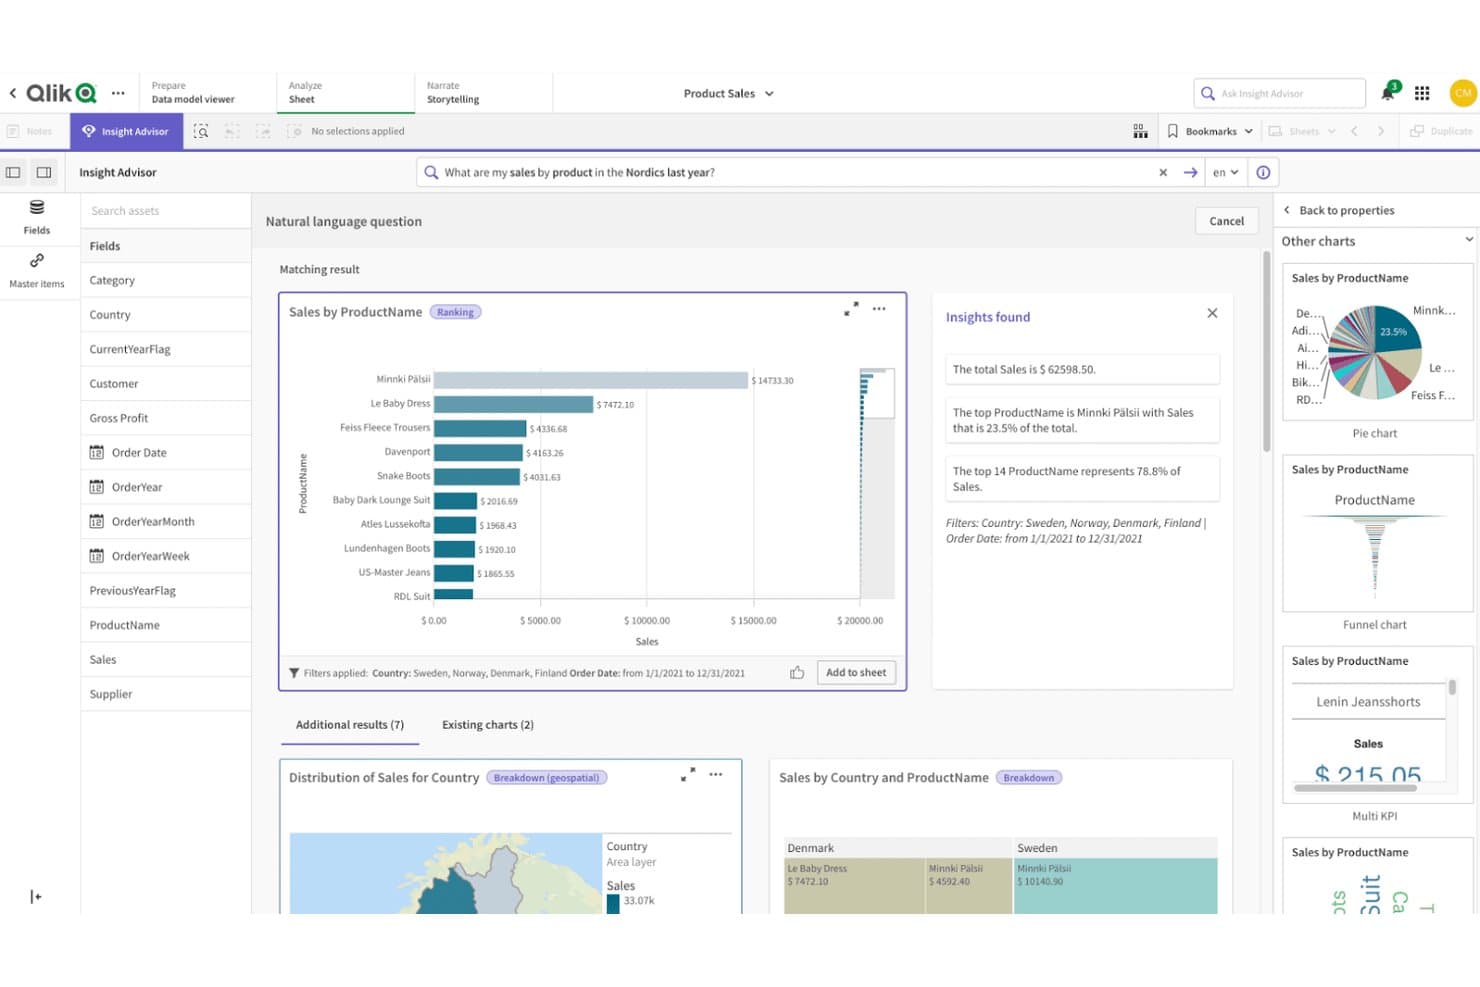
Qlik Sense lets users query product sales data visually using natural language. Qlik Sense is a cloud-based analytics platform that lets you build dashboards, explore data through its associative engine, connect hundreds of data sources, and share reports via scheduled exports or embedded analytics.
Who Is Qlik Sense Best For?
Qlik Sense is a strong fit for BI analysts and enterprise teams that need to explore large, multi-source datasets and share findings across a wide stakeholder group.
Why I Picked Qlik Sense
Qlik Sense earns its spot on my shortlist because its associative engine handles large, multi-source datasets in a way most BI tools can't match. I love how selection-based filtering works here: pick a value in one chart and every other chart instantly updates, with related and excluded values color-coded so you can spot connections across your product data without writing a single query. Pair that with AI-driven anomaly detection that flags threshold breaches automatically, and you get a reporting setup that scales well beyond basic dashboards.
Qlik Sense Key Features
- Multi-source dashboard consolidation: Combine data from hundreds of connected sources into a single dashboard view without writing SQL.
- Scheduled report delivery: Export reports as PDF, PowerPoint, or Excel files and deliver them automatically by email, to cloud storage, or to SharePoint.
- AI-driven natural language queries: Ask plain-language questions about your data through Qlik Answers to surface insights without building a chart manually.
- No-code data preparation: Use visual pipelines to clean, join, and transform raw data before it reaches your dashboards.
Qlik Sense Integrations
Qlik Sense supports hundreds of standard connectors plus Qlik Talend Cloud for databases, SaaS apps, SAP, mainframe, and legacy sources. Automations work with Salesforce and Slack, while embedded analytics supports CRM tools and ServiceNow.
Pros and Cons
Pros:
- Scheduled exports support recurring stakeholder reporting
- AI anomaly alerts surface KPI changes
- Associative filtering reveals cross-metric relationships
Cons:
- Some visualizations require extensions or add-ons
- Backend scripting slows first dashboard delivery
Learn more about Qlik Sense: 10Best for open-source BI with governed AI queries
Metabase
- 14-day free trial + free plan available
- From $100/month
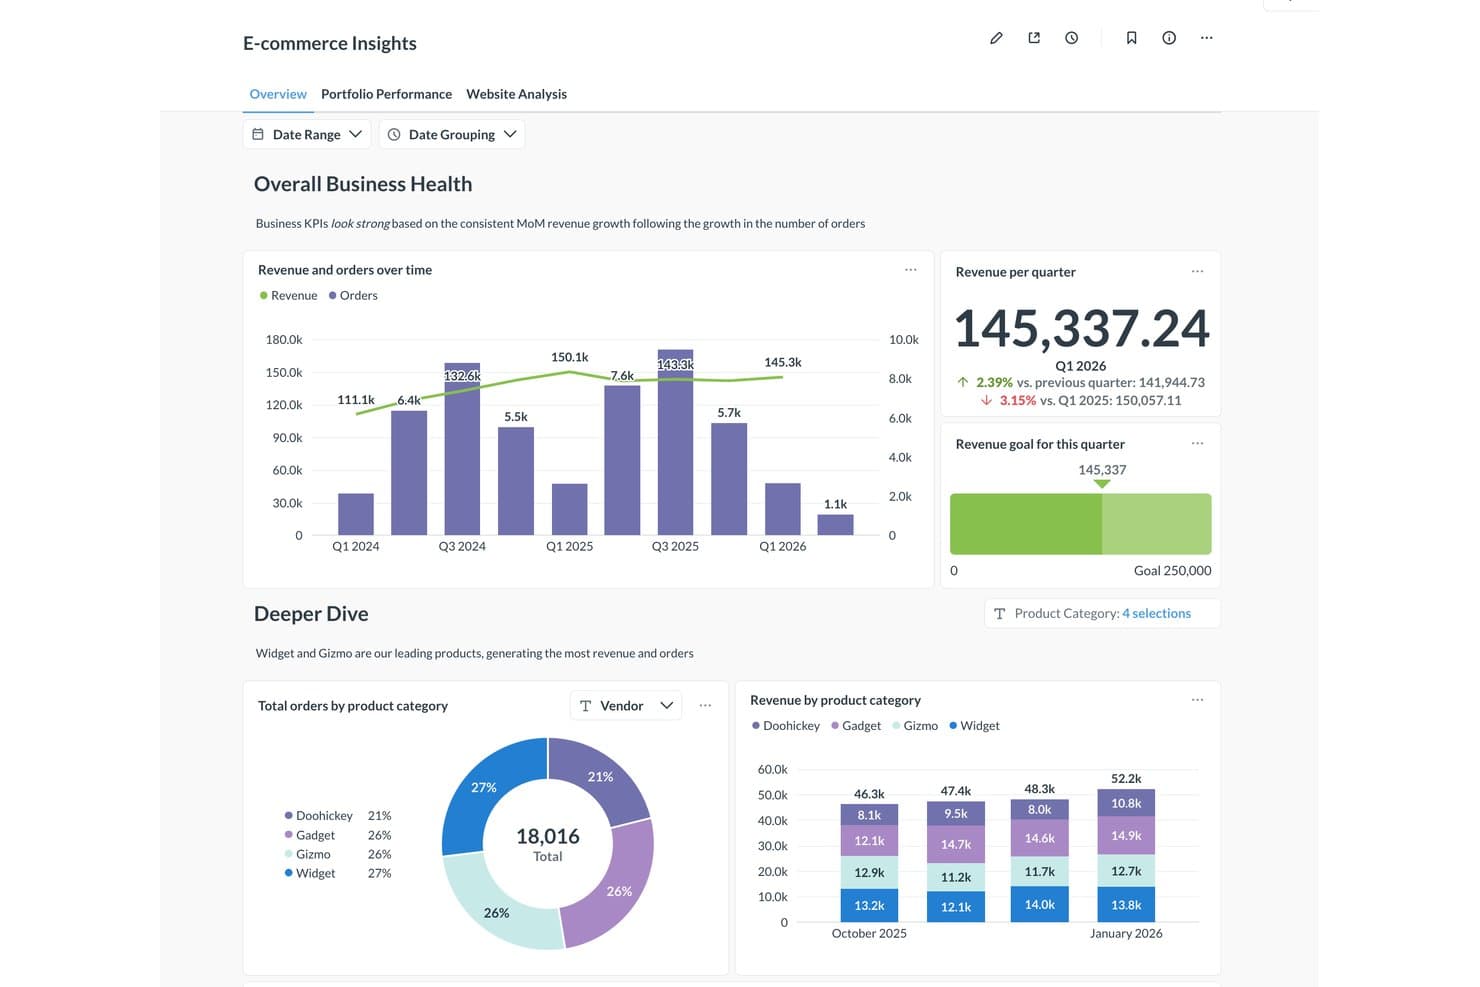
Metabase visualizes product revenue and orders across categories in one dashboard. Metabase is an open-source BI and visual reporting platform that combines a no-code query builder, a broad chart library, live database queries, governed AI querying, and embeddable dashboards.
Who Is Metabase Best For?
Metabase suits BI analysts and product managers who need governed, self-serve reporting on live database and warehouse data without paying per seat or per dashboard.
Why I Picked Metabase
Metabase earns its spot on my shortlist because its governed AI querying is genuinely built around how analysts and product managers actually work. Metabot answers plain-language questions while respecting each user's existing data permissions and routing answers through your semantic layer, so a PM asking "what's our 30-day activation rate?" gets a verified, auditable result rather than a hallucinated one. I also like that you can inspect and edit every AI-generated query, which makes it trustworthy for sharing product metrics with stakeholders.
Metabase Key Features
- No-code query builder: Build queries through clicks and prompts alone, with automatic chart type selection based on your data.
- Scheduled email and Slack delivery: Send dashboard snapshots and alerts on a schedule to anyone, including people without a Metabase login.
- Row- and column-level permissions: Restrict exactly which data each user group can see, down to individual rows and columns (Pro and above).
- Custom metric definitions: Define and verify shared KPIs like activation rate in Data Studio so every team queries the same numbers.
Metabase Integrations
Metabase supports 18 official database connectors, including BigQuery, Snowflake, PostgreSQL, Redshift, Databricks, and MySQL, plus 11 community connectors for self-hosted deployments. Google Sheets sync is available on Cloud plans with Storage; Salesforce, Amplitude, Mixpanel, and Jira require ETL.
Pros and Cons
Pros:
- Drill-through reveals underlying records without setup
- Live dashboards track changing product KPIs
- Governed AI answers use verified product metrics
Cons:
- Dashboard management becomes difficult at scale
- Performance can slow on complex dashboards
Learn more about Metabase:
Outras ferramentas de relatórios visuais
Eis algumas opções adicionais de ferramentas de relatórios visuais que não entraram na minha lista restrita, mas que ainda vale a pena conhecer:
- 11ThoughtSpotBest for AI-driven search across product metrics
- 12Power BIBest for Microsoft 365-native data reporting
- 13SisenseBest for AI-driven embedded product dashboards
- 14KlipfolioBest for multi-source dashboards with KPIs
- 15AmplitudeBest for behavioral product analytics reporting
- 16Looker StudioBest for Google data visual reporting
- 17Amazon QuickSightBest for AWS-native embedded analytics reporting
- 18HexBest for analyst-built apps shared with product teams
- 19Dundas BIBest for embedded BI with ETL built in
- 20SigmaBest for live warehouse queries without data extracts
How I Evaluate Visual Reporting Tools
I split my evaluation into three parts: core functionality (whether a tool can generate charts from real data and build multi-widget dashboards), which carries the most weight; standout features like AI-generated insights; and beyond features—onboarding quality and pricing transparency.
Core Functionality (Table Stakes For This List)
When I'm selecting tools for my list, I score each one on a scale from 0 (does not offer the functionality) to 5 (excels in this area) for each core functionality listed below. I then convert the total into a percentage to help assess each tool's overall fit, with extra weight on any functionalities I've deemed essential.
- Data Visualization Engine (Essential): I evaluate the range of chart types and customization depth—can you move beyond bar charts to heatmaps, funnels, or scatter plots when the data calls for it?
- Dashboard Creation (Essential): Multi-widget layouts matter here. I look for flexible drag-and-drop canvases that let you build cross-functional views without locking you into rigid grids.
- Data Source Connectivity: The best tools connect to databases, spreadsheets, cloud apps, and APIs out of the box. I check whether a tool can pull from sources like SQL databases, Google Sheets, and CRMs in a single dashboard.
- Report Sharing and Export: I look at how easily you can distribute finished reports—scheduled email delivery, shareable links with viewer permissions, and export to formats like PDF or CSV all factor in.
- Automated Data Refresh: Stale numbers undermine trust in any report. I evaluate whether dashboards refresh on a reliable schedule or in near real time so stakeholders always see current data.
- Interactive Filtering: Static charts don't cut it when a VP wants to drill into one region's pipeline. I check for cross-filtering, date-range selectors, and dimension drill-downs that work without rebuilding the visual.
Once I have a list of tools that meet the criteria, I consider what sets each platform apart.
Differentiating Factors (What Sets Vendors Apart)
Here's how I compare and contrast different vendors:
Standout Features
AI-generated insights matter most to me here. I look for tools that flag anomalies in product metrics automatically—like a sudden drop in activation rate—and surface plain-language summaries instead of forcing you to dig through charts. Custom metric formulas are equally valuable; I check whether you can define calculated KPIs like feature stickiness without exporting to a spreadsheet. I also evaluate white-labeled client reports, since product marketing teams often need branded, embeddable dashboards they can share externally without exposing the raw tool interface.
Beyond Features
I evaluate how well a tool fits into an existing product stack—native connectors to Jira, Amplitude, or Salesforce cut weeks off setup compared to building custom pipelines. Data governance matters just as much, especially role-based permissions and SOC 2 compliance, since product dashboards often surface sensitive usage or revenue data. I also check whether pricing scales reasonably as reporting reaches more stakeholders across the org.
Como escolher ferramentas de relatórios visuais
É fácil ficar atolado em listas extensas de funcionalidades e estruturas de preços complexas. Para o ajudar a manter o foco enquanto percorre o seu processo único de seleção de software, eis uma lista de verificação dos fatores a ter em conta:
| Fator | O que considerar |
|---|---|
| FatorEscalabilidade | O que considerarA ferramenta pode acompanhar o crescimento da sua empresa? Considere se consegue lidar com volumes de dados e números de utilizadores crescentes sem problemas de desempenho. |
| FatorIntegrações | O que considerarLiga-se aos seus sistemas existentes? Avalie a compatibilidade com as suas fontes de dados e software atuais. |
| FatorPersonalização | O que considerarPode adaptá-la às suas necessidades? Procure opções para personalizar painéis e relatórios de modo a corresponderem aos seus fluxos de trabalho. |
| FatorFacilidade de utilização | O que considerarÉ intuitiva para a sua equipa? Certifique-se de que a ferramenta é fácil de utilizar e não requer formação extensa para começar. |
| FatorImplementação e integração inicial | O que considerarCom que rapidez pode implementá-la? Considere o tempo e os recursos necessários para integrar a sua equipa e ligá-la aos seus sistemas. |
| FatorCusto | O que considerarEnquadra-se no seu orçamento? Analise a estrutura de preços, incluindo quaisquer taxas ocultas, e compare-a com as funcionalidades oferecidas. |
| FatorMedidas de segurança | O que considerarOs seus dados estão protegidos? Verifique as normas de encriptação, os controlos de acesso e a conformidade com os regulamentos de proteção de dados. |
| FatorDisponibilidade do suporte | O que considerarExiste ajuda disponível quando necessário? Certifique-se de que o fornecedor oferece canais de suporte adequados, como chat, e-mail ou telefone, e verifique os tempos de resposta. |
O que são ferramentas de relatórios visuais?
As ferramentas de relatórios visuais são softwares que o ajudam a transformar dados brutos em gráficos, diagramas e painéis fáceis de ler. Analistas, gestores e responsáveis de equipa utilizam estas ferramentas para identificar tendências, acompanhar o progresso e partilhar informações com outras pessoas. Estas ferramentas facilitam a compreensão de informações complexas e a comunicação rápida dos resultados.
Funcionalidades
Ao selecionar ferramentas de elaboração de relatórios visuais, esteja atento às seguintes funcionalidades essenciais:
- Painéis personalizáveis: Permitem adaptar as visualizações às necessidades e aos fluxos de trabalho específicos da sua empresa.
- Atualizações de dados em tempo real: Garantem que as informações que analisa e sobre as quais elabora relatórios estão sempre atualizadas e corretas.
- Integração de dados: Liga-se facilmente a várias fontes de dados para fornecer uma visão abrangente das suas análises.
- Visualizações interativas: Permitem aos utilizadores interagir com os dados através de gráficos dinâmicos para obter informações mais aprofundadas.
- Análise preditiva: Utiliza dados históricos para prever tendências futuras, ajudando-o a tomar decisões empresariais fundamentadas.
- Interface intuitiva: Facilita a navegação e a utilização eficaz da ferramenta por parte de membros da equipa com diferentes níveis de conhecimentos.
- Funcionalidades de colaboração: Permitem às equipas partilhar informações e trabalhar em conjunto de forma eficiente em projetos orientados por dados.
- Medidas de segurança: Protegem os dados sensíveis através de encriptação e controlos de acesso, garantindo a conformidade com os regulamentos.
- Recursos de formação e suporte: Fornecem aos utilizadores as ferramentas e orientações necessárias para maximizar o potencial do software.
- Escalabilidade: Suporta volumes de dados e números de utilizadores crescentes, garantindo uma utilização prolongada à medida que a sua empresa se expande.
Benefícios
A implementação de ferramentas de elaboração de relatórios visuais proporciona vários benefícios à sua equipa e à sua empresa. Eis alguns dos benefícios que pode esperar:
- Melhoria da tomada de decisões: As atualizações de dados em tempo real e a análise preditiva ajudam-no a tomar decisões fundamentadas com base nas informações mais recentes.
- Colaboração melhorada: As funcionalidades de colaboração permitem aos membros da equipa partilhar informações e trabalhar em conjunto de forma eficaz em projetos orientados por dados.
- Maior eficiência: Os painéis personalizáveis e as interfaces intuitivas facilitam a visualização e a análise rápida dos dados.
- Informações mais úteis sobre os dados: As visualizações interativas e a integração de dados proporcionam uma visão clara e abrangente das métricas da sua empresa.
- Escalabilidade: A capacidade de lidar com volumes de dados e números de utilizadores crescentes garante que as ferramentas continuam a ser úteis à medida que a sua empresa se expande.
- Segurança dos dados: As medidas de segurança protegem as informações sensíveis, garantindo a conformidade com os regulamentos de proteção de dados.
- Recursos de formação acessíveis: Os recursos de formação e suporte permitem à sua equipa tirar pleno partido das capacidades do software.
Custos e preços
A seleção de ferramentas de elaboração de relatórios visuais requer uma compreensão dos vários modelos de preços e planos disponíveis. Os custos variam consoante as funcionalidades, a dimensão da equipa, os complementos, entre outros fatores. A tabela abaixo resume os planos comuns, os respetivos preços médios e as funcionalidades normalmente incluídas nas soluções de ferramentas de elaboração de relatórios visuais:
Tabela de comparação de planos para ferramentas de elaboração de relatórios visuais
| Tipo de plano | Preço médio | Funcionalidades comuns |
|---|---|---|
| Tipo de planoPlano gratuito | Preço médio$0 | Funcionalidades comunsVisualizações básicas, fontes de dados limitadas e suporte da comunidade. |
| Tipo de planoPlano pessoal | Preço médio$5-$25/ utilizador/mês | Funcionalidades comunsPainéis personalizáveis, várias integrações de dados e suporte por e-mail. |
| Tipo de planoPlano empresarial | Preço médio$30-$60/ utilizador/mês | Funcionalidades comunsAnálise avançada, atualizações em tempo real, ferramentas de colaboração e suporte telefónico. |
| Tipo de planoPlano empresarial de grande dimensão | Preço médio$75-$150/ utilizador/mês | Funcionalidades comunsIntegração completa de dados, análise preditiva, suporte dedicado e melhorias de segurança. |
Perguntas frequentes sobre ferramentas de relatórios visuais
Eis algumas respostas a perguntas comuns sobre ferramentas de relatórios visuais:
As ferramentas de relatórios visuais exigem conhecimentos técnicos?
Não, a maioria das ferramentas de relatórios visuais foi concebida para ser fácil de utilizar e não exige competências técnicas aprofundadas. Incluem frequentemente interfaces de arrastar e largar e um design intuitivo. No entanto, algumas funcionalidades avançadas podem exigir alguma formação ou apoio. É útil consultar os recursos de formação disponibilizados pelo fornecedor para começar.
Como manter a precisão e a consistência dos relatórios ao longo do tempo?
A precisão resulta da utilização de fontes de dados verificadas e da aplicação de regras consistentes ao criar relatórios. Estabeleça um calendário de revisão para detetar discrepâncias atempadamente. A sua equipa deve chegar a acordo sobre as definições dos dados, para que todos interpretem os resultados da mesma forma.
Quais são as armadilhas comuns ao implementar ferramentas de relatórios visuais em várias equipas?
As equipas enfrentam frequentemente desafios como relatórios duplicados, formatos inconsistentes ou painéis que não são utilizados regularmente. Estes problemas resultam geralmente de funções pouco claras ou da falta de normas comuns. A definição de processos claros para a criação e revisão de relatórios ajuda a manter o alinhamento.
Como garantir que os painéis continuam relevantes para os objetivos da empresa?
Os painéis precisam de ser revistos regularmente para continuarem alinhados com os objetivos da sua equipa. Se os objetivos ou as métricas mudarem, atualize os elementos visuais e as fontes de dados em conformidade. Incentive o feedback dos utilizadores principais para que os relatórios continuem a apoiar a tomada de decisões no dia a dia.
Como podem as equipas promover a adoção de ferramentas de relatórios visuais entre os colaboradores?
Incentive os colaboradores a utilizar a ferramenta, mostrando como esta se integra nas suas rotinas diárias. Disponibilize sessões curtas e práticas para os ajudar a sentirem-se à vontade na sua utilização. Quando as equipas percebem como a ferramenta simplifica o seu trabalho, é mais provável que dependam dela de forma consistente.