
Com tantas soluções de análise diferentes disponíveis, é difícil perceber qual é a mais adequada para si. Sabe que quer apresentar dados complexos sobre os produtos de forma clara e acessível, permitindo que as equipas compreendam rapidamente como os clientes utilizam os seus produtos e tomem decisões informadas, mas precisa de descobrir qual é a melhor ferramenta. Eu ajudo! Neste artigo, vou tornar a sua escolha mais fácil, partilhando a minha experiência pessoal com dezenas de ferramentas diferentes, utilizadas por equipas grandes e com produtos diversificados, bem como as minhas escolhas dos melhores painéis de análise de produtos.
Why Trust Our Software Recommendations
6,700+
Reviews
20
Industry experts
16+
Evaluation factors
14
Years
Our team has been testing and reviewing software since 2012. As product managers ourselves, we know how difficult—and important—it is to choose the right software.
For this guide, we evaluated tools using hands-on testing and independent research, scoring tools using our selection criteria.
Our reviews reflect our human editorial judgment, not a sales pitch.
Expert reviewers:
- Andrew LumbySenior TPM
- Cristiano ValimSenior UI/UX Lead


Tabela comparativa de painéis de análise de produtos
Compare abaixo os detalhes de preços das minhas principais escolhas de painéis de análise de produtos.
| Tool | Best For | Trial Info | Price | ||
|---|---|---|---|---|---|
| 1 | Best for real-time collaboration and visualization of product analytics data | Free plan + 14-day free trial + free demo available | From $8/user/month (billed annually) | Website | |
| 2 | Product analytics dashboard with predictive analytics | Free plan available | From $50,000/year (billed annually) | Website | |
| 3 | Best for no-code adoption analytics and onboarding | 14-day free trial | From $299/month | Website | |
| 4 | Best for linking session replays to dashboard metrics | Free plan available | Pricing upon request | Website | |
| 5 | Product analytics tool with a resource wiki builder | Free plan + 30-day free trial + free demo available | Pricing upon request | Website | |
| 6 | Best for AI-driven session replay and friction analysis | Free demo available | Pricing upon request | Website | |
| 7 | Best for behavioral analytics with real-time alerts | Free plan available | From $120/month (billed annually) | Website | |
| 8 | Best for warehouse-native behavioral analytics | Free plan + free demo available | Pricing upon request | Website | |
| 9 | Best for open-source, warehouse-native analytics | Free plan available | Pricing upon request | Website | |
| 10 | Best for quantitative and qualitative data in one view | Free plan + free demo + 15-day free trial available | From $39/month (billed annually) | Website |


Análises dos melhores painéis de análise de produtos
Abaixo encontram-se os meus resumos detalhados dos melhores painéis de análise de produtos que entraram na minha lista restrita. As minhas análises apresentam uma visão detalhada das principais funcionalidades, vantagens & desvantagens, integrações e casos de utilização ideais de cada ferramenta, para o ajudar a encontrar a melhor opção para si.
 1Best for real-time collaboration and visualization of product analytics data
Miro
- Free plan + 14-day free trial + free demo available
- From $8/user/month (billed annually)
Visit WebsiteCustomer Rating:4.8/5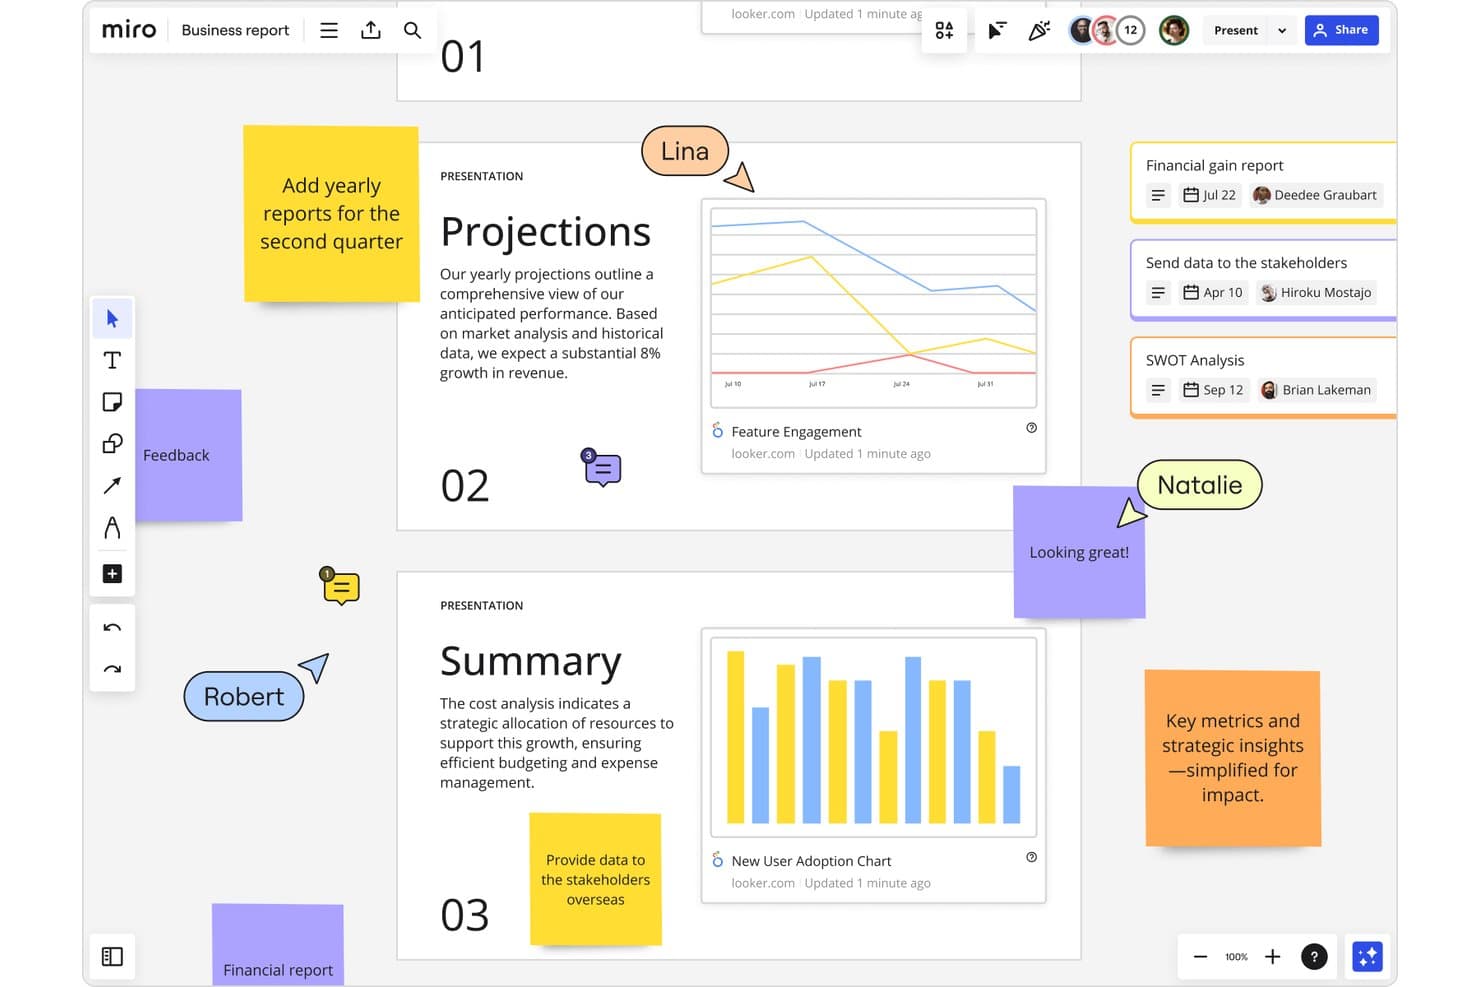
Miro integrates Looker analytics dashboards into collaborative product boards. Miro is a visual collaboration workspace that lets product teams map user journeys, build shareable visual boards, and bring in data from external analytics tools to discuss and act on together.
Who Is Miro Best For?
Miro fits product teams that already use dedicated analytics tools and need a shared space to bring that data together, discuss it, and turn it into decisions.
Why I Picked Miro
I've included Miro in my top picks because it's the strongest option for teams that need a shared space to bring analytics data together and turn it into decisions. When my team pulls charts from Amplitude into a Miro board, we can annotate them, run live workshops, and map findings directly onto a customer journey template without switching tools. Talktrack lets me walk stakeholders through a board asynchronously, which keeps alignment moving even when everyone can't meet at the same time.
Miro Key Features
- Journey mapping templates: Pre-built templates let you diagram user flows, onboarding paths, and friction points directly on a shared canvas.
- Two-way project tool sync: Boards connect bidirectionally with Jira, Asana, Linear, and ClickUp so decisions made on the board flow straight into delivery work.
- Data tables: Nested tables and tree views let you organize and display structured information alongside visual content on the same board.
- Talktrack: Record a narrated walkthrough of any board so stakeholders can review findings and decisions on their own schedule.
Miro Integrations
Miro offers 250+ integrations, including Amplitude, Looker, Jira, Asana, Linear, ClickUp, and Azure DevOps. Its REST API and SDKs support custom integrations, while Amplitude embeds static chart images rather than live dashboards.
Pros and Cons
Pros:
- Links journey maps to prioritization
- Turns charts into shared decisions
- Supports real-time analytics review workshops
Cons:
- Manual boards replace calculated dashboards
- No native event or behavior tracking
 Product analytics dashboard with predictive analytics
- Free plan available
- From $50,000/year (billed annually)
Visit WebsiteCustomer Rating:4.6/5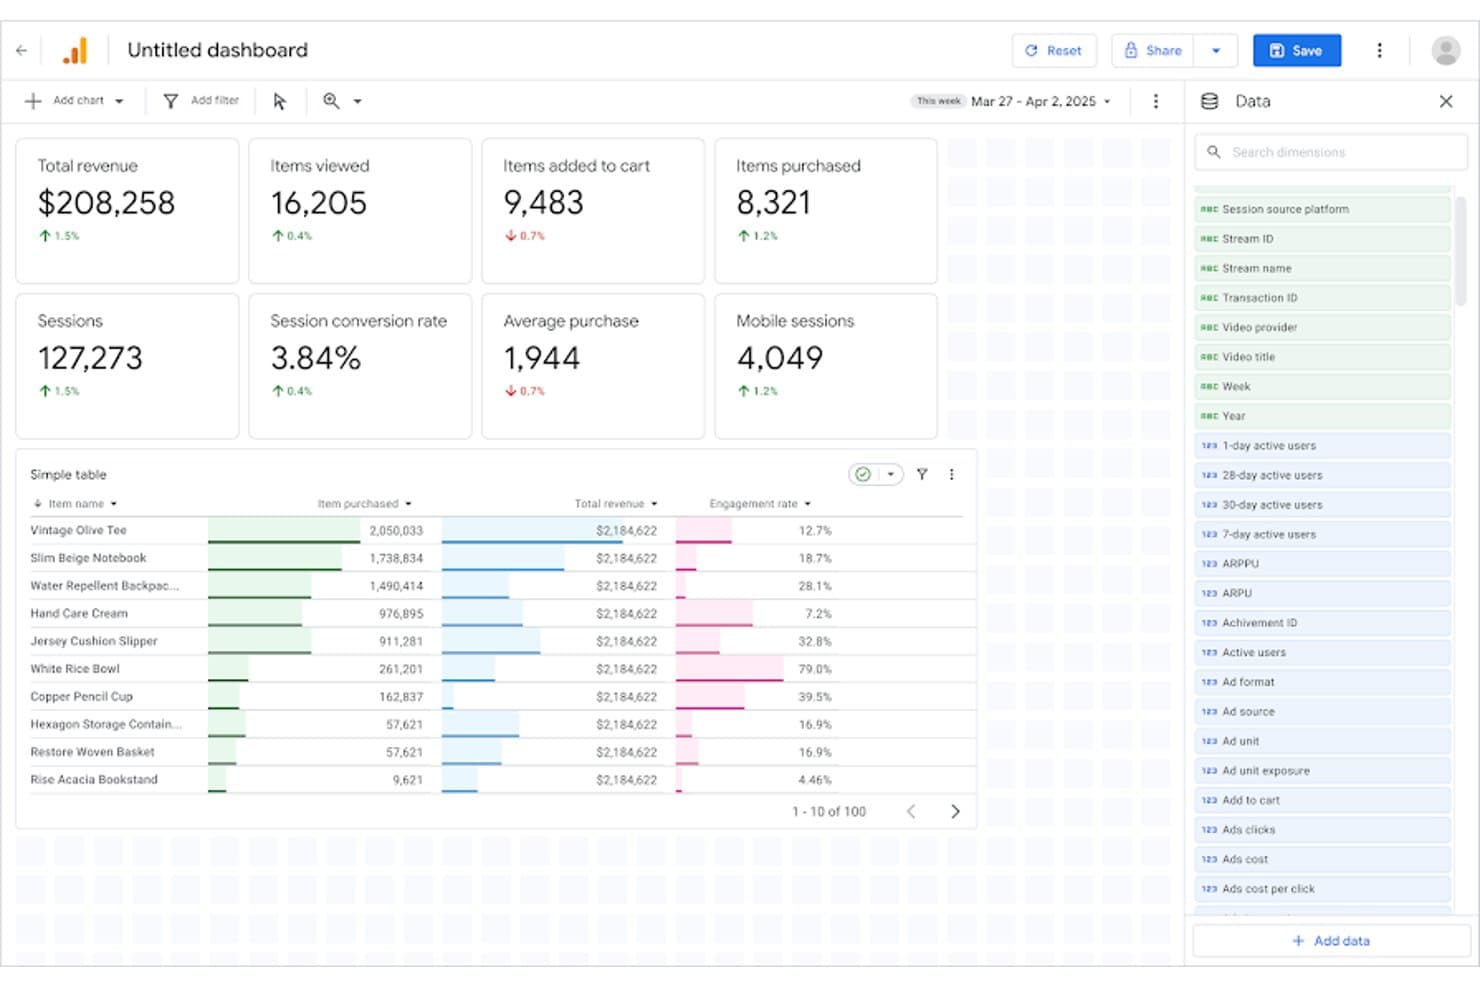
Google Analytics tracks product revenue, sessions, and item performance in one dashboard. Google Analytics is a web and app analytics platform that tracks user behavior through event-based data collection, funnel and cohort analysis, segmentation, and customizable dashboards.
Who Is Google Analytics Best For?
Google Analytics is a strong fit for product and growth teams already embedded in the Google ecosystem who need a free, capable starting point for web and app behavioral analytics.
Why I Picked Google Analytics
Google Analytics earns its spot on my shortlist because its built-in predictive analytics do something most product analytics tools don't: flag users likely to churn or convert before it happens, using ML trained on your own behavioral data. I rely on its Funnel Exploration and Cohort Exploration reports to trace exactly where users drop off and how retention shifts across segments over time. Its BigQuery export then lets me join that behavioral data with product and revenue sources for deeper analysis.
Google Analytics Key Features
- Segment overlap analysis: Compare up to three user segments simultaneously to identify where audience behaviors intersect and inform prioritization decisions.
- Path exploration: Visualize the exact routes users take through your product, including backwards path analysis to trace steps leading to a key event.
- BigQuery export: Send raw event data directly to BigQuery to join behavioral data with product or revenue sources for warehouse-level analysis.
- Predictive audiences: Use ML-generated audience lists to surface users likely to purchase or churn based on their behavioral patterns in your product.
Google Analytics Integrations
Google Analytics offers native integrations with Google Ads, Search Console, BigQuery, AdMob, and Salesforce Marketing Cloud. Its Admin API and Data API support custom integrations, while data import connects additional first-party and campaign cost sources.
Pros and Cons
Pros:
- Cohort reports support retention diagnosis
- Open and closed funnel analysis
- Predictive audiences flag likely churners
Cons:
- No session replay limits friction diagnosis
- Marketing orientation weakens feature adoption context
Learn more about Google Analytics: Best for no-code adoption analytics and onboarding
- 14-day free trial
- From $299/month
Visit WebsiteCustomer Rating:4.7/5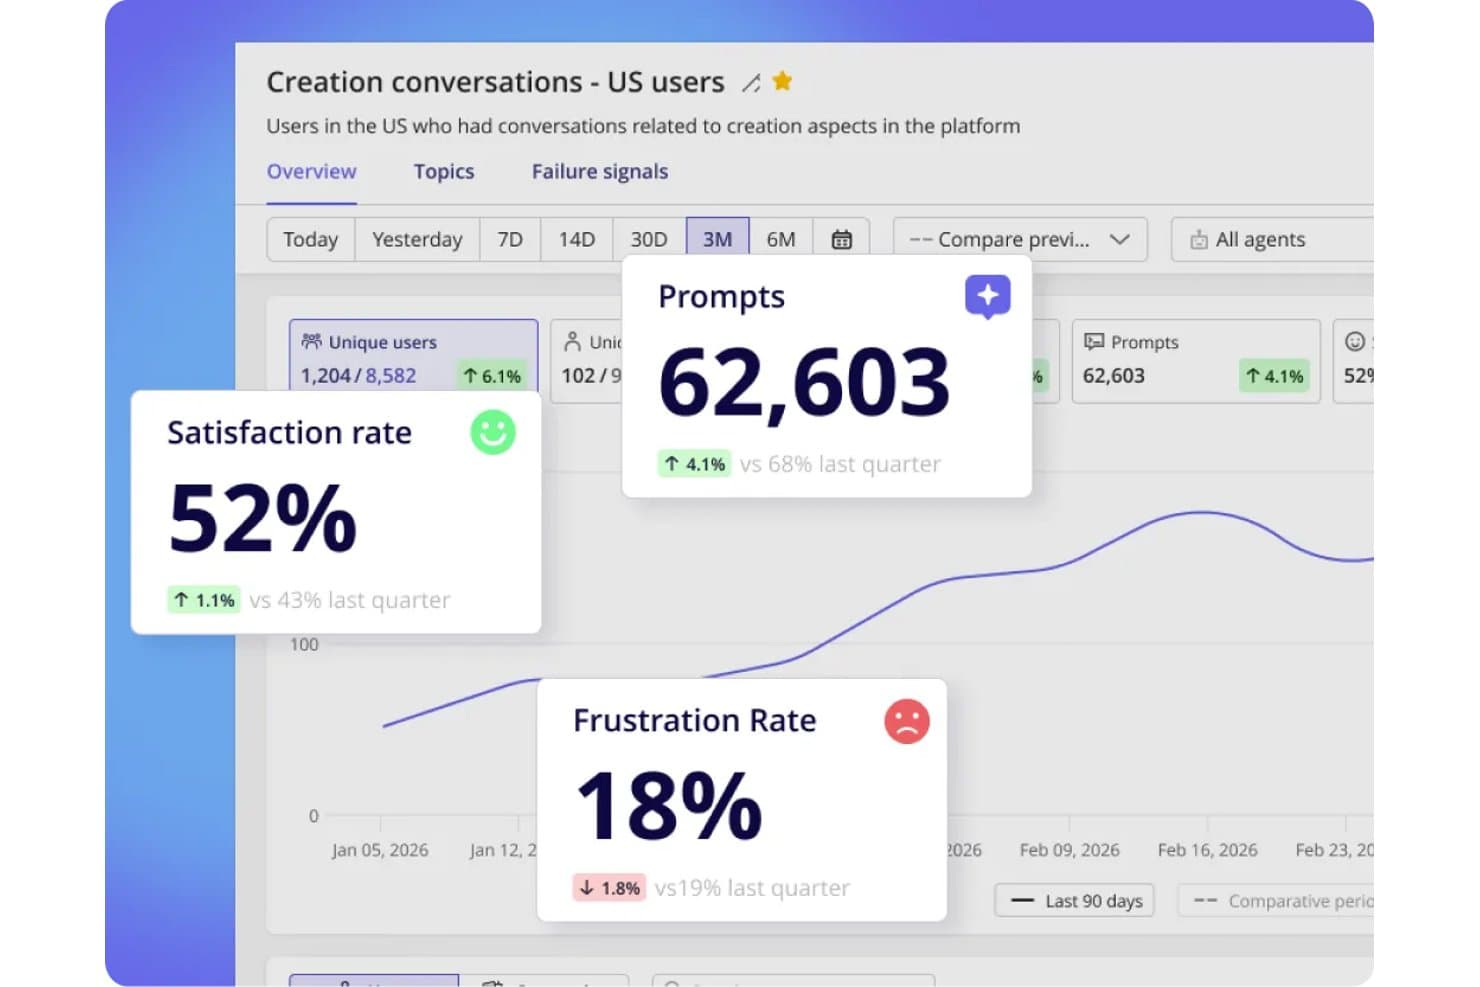
Userpilot tracks satisfaction, frustration rates, and prompts in one dashboard. Userpilot is a product analytics and onboarding platform that combines no-code behavioral tracking, funnel and retention analysis, user segmentation, session replay, and in-app feedback tools in a single product.
Who Is Userpilot Best For?
Userpilot is a strong fit for non-technical product managers who want adoption analytics and onboarding tools in one place, without writing SQL or filing developer tickets.
Why I Picked Userpilot
I picked Userpilot as one of the best because it's built specifically for product managers who need adoption analytics without writing a line of SQL or waiting on engineering. I love that autocapture handles behavioral tracking from day one, and retroactive event renaming means your taxonomy stays clean without losing historical data. Lia, Userpilot's AI agent, goes further by explaining drops in your Trends reports and predicting activation and retention changes in plain language.
Userpilot Key Features
- Funnel and path analysis: Funnels link drop-off points to specific steps in the user journey, while Paths show how users navigate through your product.
- User and account-level profiles: Every tracked user and company gets a dedicated profile, letting you analyze behavior at both the individual and organizational level.
- In-app surveys and NPS: Built-in NPS and customizable surveys collect feedback directly inside your product, with AI-powered sentiment and theme analysis on Growth plans.
- Session replay with frustration indicators: Recorded user sessions surface rage clicks and friction signals, with saved playlists and console logs available on Growth.
Userpilot Integrations
Userpilot offers eight documented integrations, including Segment, Mixpanel, Amplitude, Heap, Intercom, Slack, HubSpot, and Salesforce. Growth includes an HTTP API and webhooks.
Pros and Cons
Pros:
- Onboarding and analytics share one workspace
- Account-level profiles connect usage to organizations
- Autocapture tracks behavior without developer tickets
Cons:
- Dashboard sharing options remain limited
- Core funnel reports require Growth
Learn more about Userpilot: Best for linking session replays to dashboard metrics
- Free plan available
- Pricing upon request
Visit WebsiteCustomer Rating:4.5/5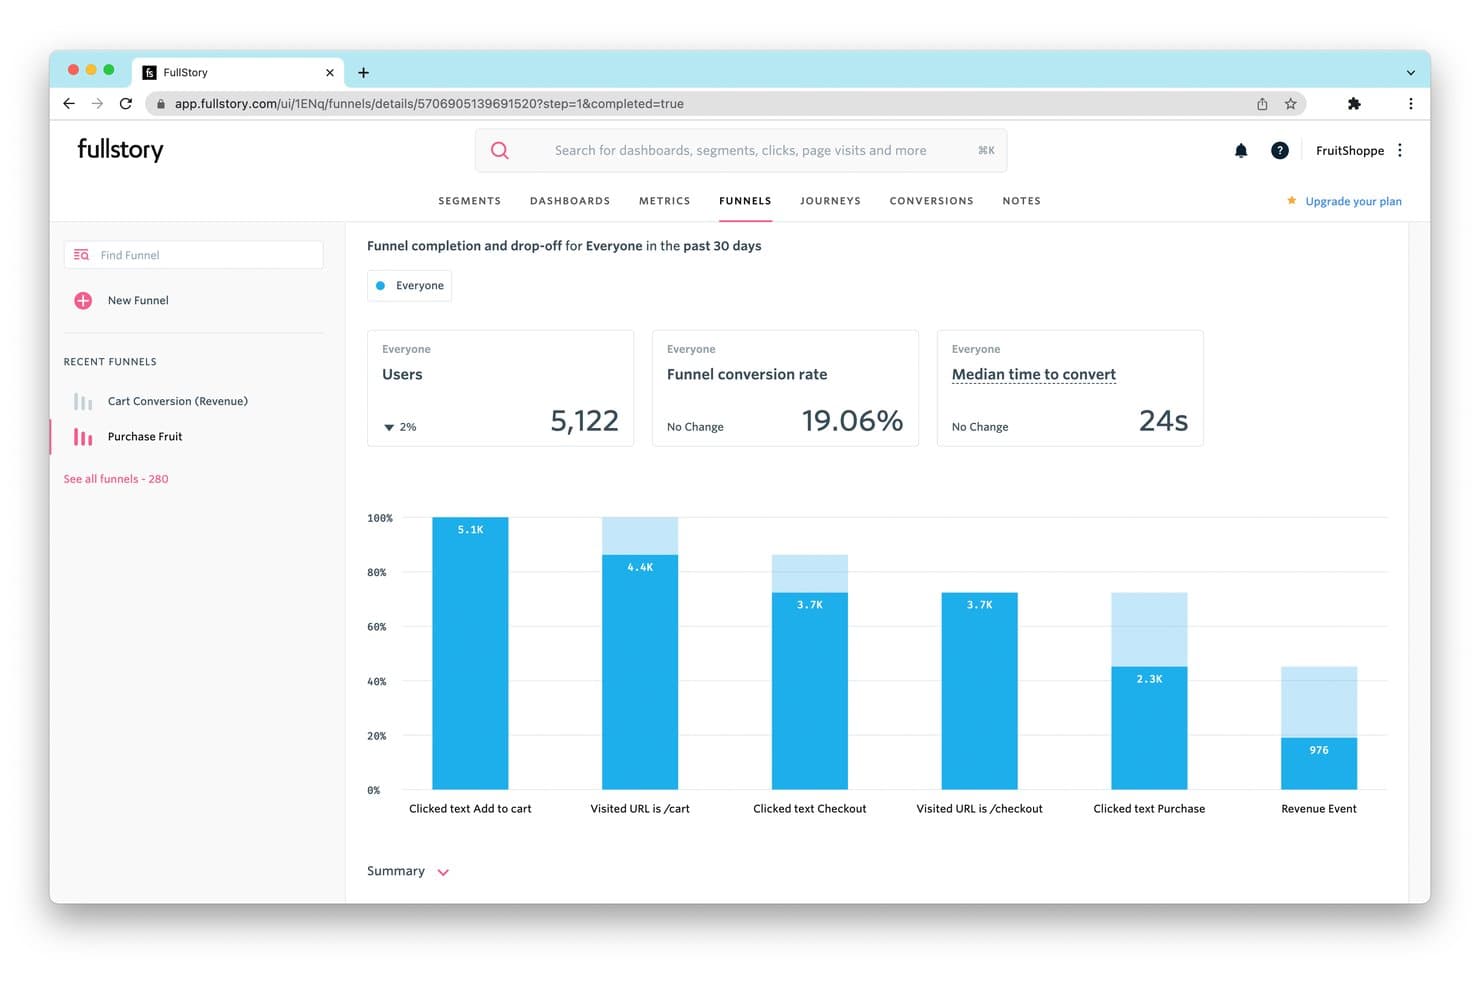
FullStory tracks funnel drop-off rates to reveal where users abandon purchases. Fullstory is a digital experience analytics platform that combines autocaptured behavioral data, customizable dashboards, session replay, funnel analysis, and journey mapping to give product teams a connected view of how users interact with their product.
Who Is Fullstory Best For?
Fullstory is a strong fit for product and UX teams at mid-market and enterprise companies that need to connect quantitative dashboard metrics directly to the user sessions behind them.
Why I Picked Fullstory
Fullstory earns its spot on my shortlist because of how directly it connects session replays to dashboard metrics. I love that you can click any data point on a dashboard and immediately watch the actual sessions behind it, so when your retention chart drops, you're not guessing why. Fullstory's Sentiment Signals layer on top, surfacing frustration patterns like rage clicks tied to those same moments. That combination of quantitative and qualitative in one place is what makes it genuinely useful for product teams.
Fullstory Key Features
- Fullcapture™ autocapture: Automatically records web and mobile user behavior in a single data stream with no manual event tagging required.
- Funnel and conversion analysis: Tracks drop-off across user flows with Funnels, Conversion Maps, and Page Flow to pinpoint where users disengage.
- Sentiment Signals: Detects frustration patterns like rage clicks and tied them to specific moments in the user journey.
- StoryAI summaries: Generates AI-powered session summaries so you can quickly understand what happened in a session without watching it in full.
Fullstory Integrations
Fullstory’s documented integrations include Segment, Adobe Analytics, and Google Tag Manager through Data Layer Capture. It also offers an open API for custom events and Anywhere: Warehouse for sending behavioral data to a warehouse or cloud storage.
Pros and Cons
Pros:
- Frustration signals expose product journey friction
- Autocapture reduces upfront event instrumentation
- Dashboard metrics connect directly to session replays
Cons:
- Feature flagging isn’t built in
- Retention analysis requires higher-tier access
Learn more about Fullstory: Product analytics tool with a resource wiki builder
- Free plan + 30-day free trial + free demo available
- Pricing upon request
Visit WebsiteCustomer Rating:4.4/5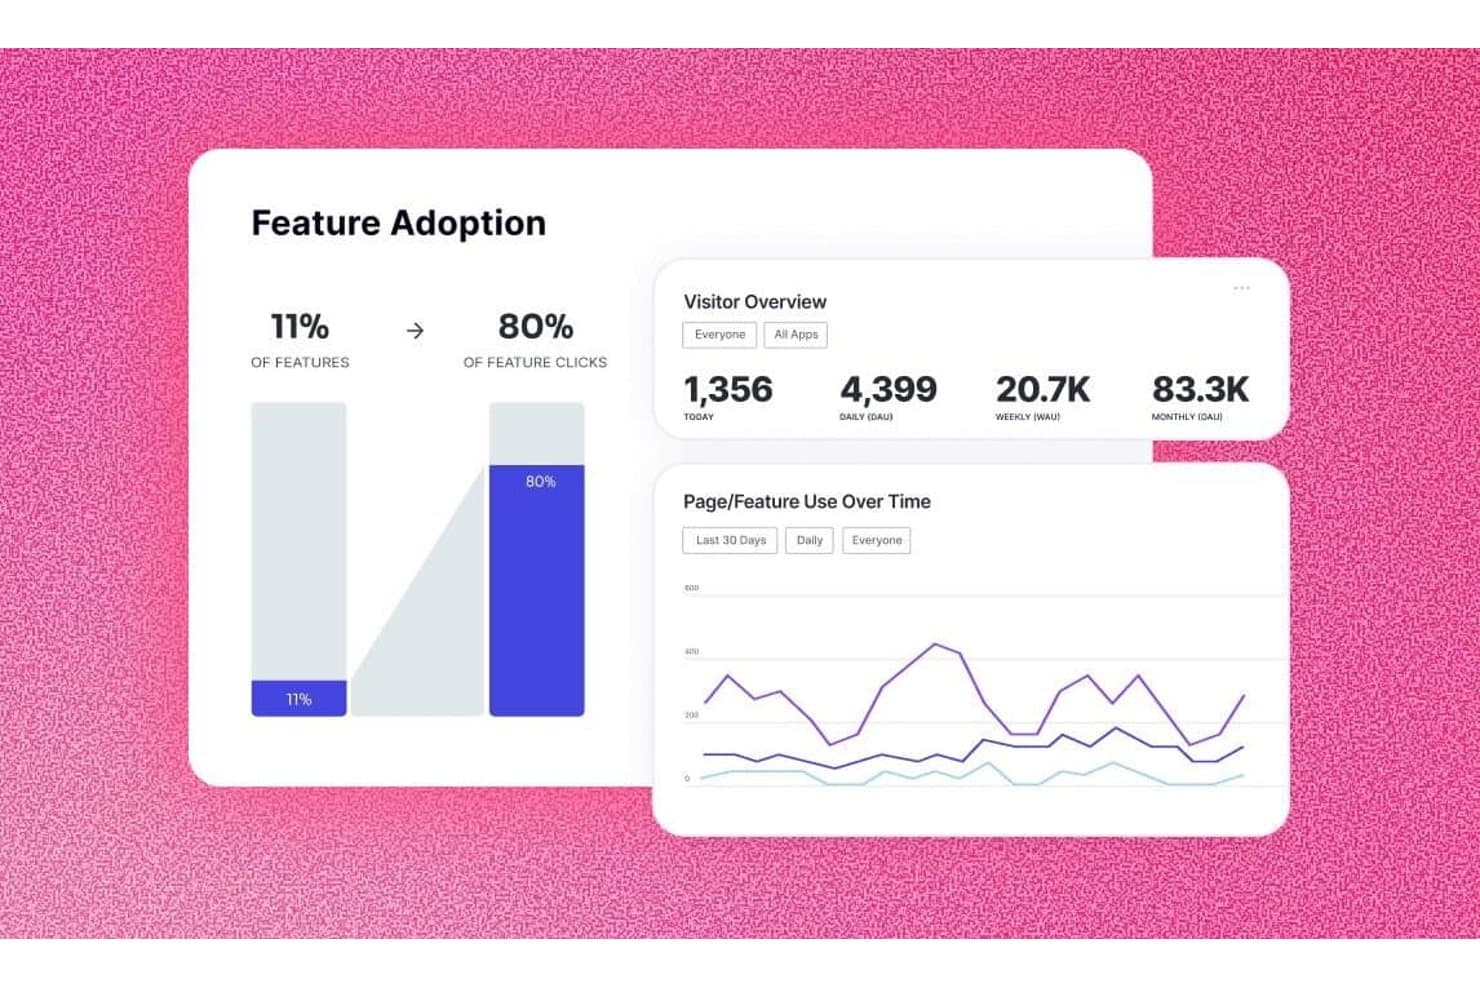
Pendo tracks feature adoption and visitor trends in one dashboard. Pendo is a product analytics platform that combines auto-capture behavioral tracking, customizable dashboards, funnel and retention analysis, session replay, and in-app feedback and guidance tools.
Who Is Pendo Best For?
Pendo is a strong fit for product managers who want analytics, in-app guidance, and user feedback in one platform without heavy engineering overhead.
Why I Picked Pendo
Pendo earns its spot on my shortlist because it's the only product analytics tool I've found that pairs deep behavioral tracking with a built-in Resource Center wiki, letting you act on what the data tells you without leaving the platform. Auto-capture with retroactive tagging means I can tag features after the fact and pull historical data immediately, which is a real advantage when stakeholders want answers fast. I also rely on Pendo's Session Replay and funnel reports together to pinpoint exactly where users drop off during onboarding.
Pendo Key Features
- Product Engagement Score (PES): A single metric that combines adoption, stickiness, and growth to give you a quick read on overall product health.
- In-app guides: Contextual messages and walkthroughs you can trigger directly inside your product based on user behavior or segment.
- Behavioral segmentation: Slice your user base by actions, metadata, or account attributes to compare usage patterns across groups.
- Data Sync: Exports behavioral data to Snowflake, Amazon S3, Azure, or Google Cloud Storage for deeper analysis in your BI tools.
Pendo Integrations
Pendo lists 51 integrations, including Salesforce, Jira, Figma, Snowflake, Tableau, Looker, Segment, Zendesk, Intercom, and Slack. It also supports Data Sync to Snowflake, Amazon S3, Azure, and Google Cloud Storage, plus Zapier and webhooks.
Pros and Cons
Pros:
- Resource wiki turns insights into guidance
- Replay connects drop-offs with behavior
- Retroactive capture speeds historical analysis
Cons:
- Reviewers report tedious tagging workflows
- Dashboard filters exclude paths and funnels
Learn more about Pendo: Best for AI-driven session replay and friction analysis
- Free demo available
- Pricing upon request
Visit WebsiteCustomer Rating:4.7/5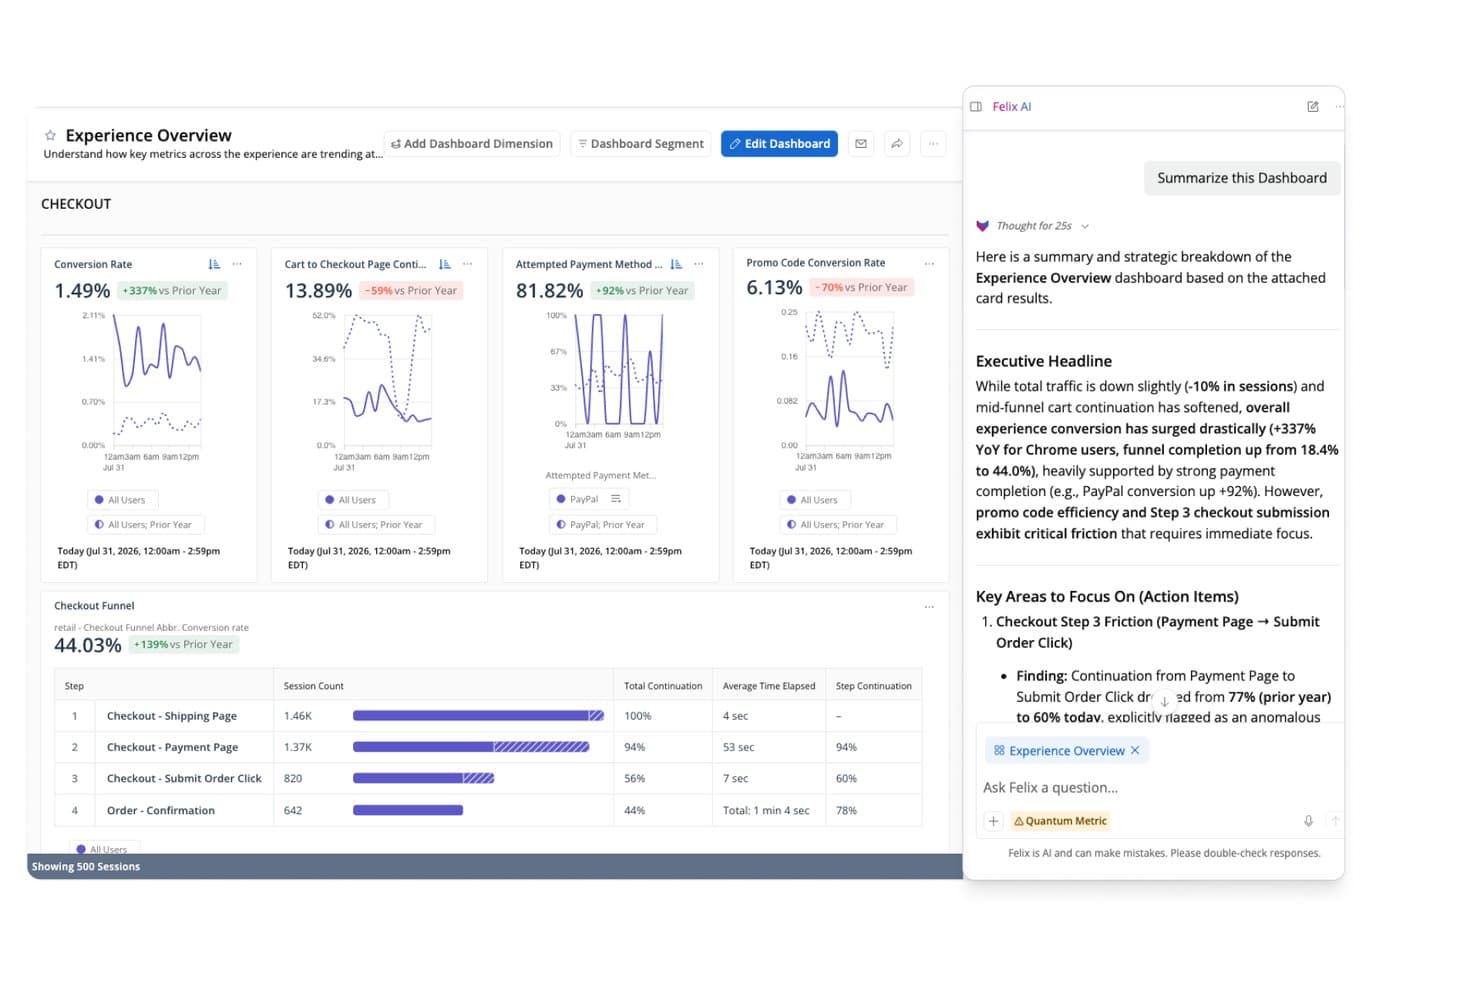
Quantum Metric surfaces AI-generated checkout funnel insights for PMs. Quantum Metric is a digital experience analytics platform that combines autocapture behavioral tracking, customizable dashboards, AI-driven session replay, segmentation, and journey analysis across web and mobile products.
Who Is Quantum Metric Best For?
Quantum Metric is a strong fit for enterprise product and UX teams at B2C companies—think retail, finance, and travel—who need to connect behavioral data to real revenue impact.
Why I Picked Quantum Metric
I picked Quantum Metric as one of the best because its AI-driven session replay goes well beyond basic playback. Felix AI Summarization writes plain-language summaries of individual sessions, so I can understand what went wrong in a checkout flow without scrubbing through hours of recordings. Opportunity Analysis automatically surfaces friction points and quantifies their revenue impact, which means my team can walk into a roadmap meeting with data-backed prioritization instead of gut instinct.
Quantum Metric Key Features
- Autocapture behavioral tracking: Records clicks, taps, scrolls, and interactions automatically across 300+ built-in metrics with no manual tagging or code changes.
- Segment Builder: Creates complex audience segments using AND, OR, THEN, and WHERE logic, including sequential step-by-step filters usable across the entire platform.
- Copilot for Dashboards: An AI assistant built into dashboards that answers plain-language questions about live data on screen.
- Data Streaming: A paid add-on that exports your behavioral and business data directly to warehouses like Snowflake, BigQuery, and Redshift.
Quantum Metric Integrations
Quantum Metric supports data streaming to Snowflake, BigQuery, Redshift, Databricks, Amazon S3, and Oracle. Partner integrations include Salesforce, Optimizely, and Split.
Pros and Cons
Pros:
- Sequential segments support roadmap prioritization
- Autocapture reduces instrumentation work
- AI summaries accelerate session diagnosis
Cons:
- Session playback sometimes loads slowly
- Segment search can feel awkward
Learn more about Quantum Metric: Best for behavioral analytics with real-time alerts
- Free plan available
- From $120/month (billed annually)
Visit WebsiteCustomer Rating:4.5/5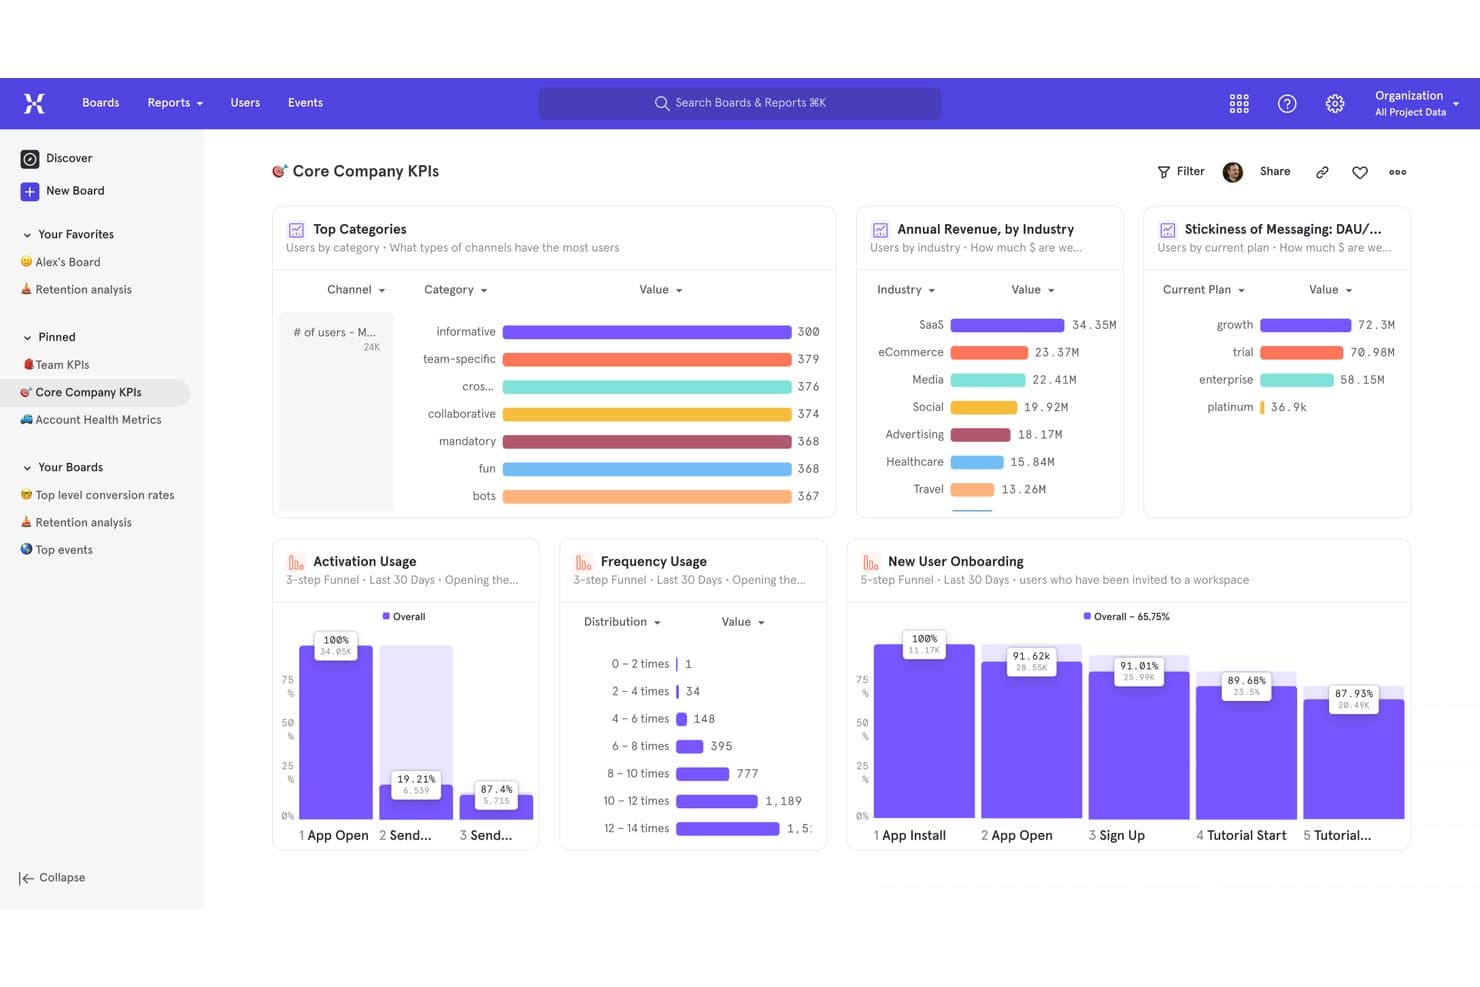
Mixpanel centralizes key product KPIs in one analytics dashboard. Mixpanel is an event-based product analytics platform that combines behavioral tracking, funnel and retention analysis, user segmentation, session replay, and built-in feature flags and experiments into a single dashboard-driven workspace.
Who Is Mixpanel Best For?
Mixpanel is a strong fit for product managers and data analysts at growth-stage companies who need to go beyond pageview metrics and understand exactly how users behave inside a product.
Why I Picked Mixpanel
Mixpanel earns its spot on my shortlist because its real-time alerting and anomaly detection give product teams an early warning system that most analytics dashboards lack. I particularly like that you can set threshold-based alerts on any metric, so if a funnel conversion rate drops unexpectedly after a release, your team knows immediately. Pair that with behavioral cohort analysis and funnel drop-off reports, and you can move from detecting a problem to diagnosing its source without leaving the platform.
Mixpanel Key Features
- Behavioral cohorts: Group users by actions they've taken inside your product and reuse those cohorts to filter reports, target feature flags, or set up experiments.
- Session replay: Watch real user sessions with rage-click and dead-click detection, console logs, and AI-generated summaries to pinpoint exactly where users struggle.
- Built-in feature flags and experiments: Run A/B tests with multiple variants, bias testing, and diagnostic analysis, then roll out changes to specific cohorts using percentage-based targeting.
- Warehouse connectors: Sync data directly from Snowflake, BigQuery, Databricks, and Redshift to run analytics on your existing data without duplicating your pipeline.
Mixpanel Integrations
Mixpanel offers documented integrations with Segment, mParticle, Snowflake, BigQuery, Databricks, and Redshift. Ingestion, export, and query APIs support custom data flows.
Pros and Cons
Pros:
- Feature flags connect insights to rollouts
- Session replays reveal journey friction
- Real-time alerts surface metric changes
Cons:
- No native surveys for direct feedback
- Advanced reports require substantial setup
 Best for warehouse-native behavioral analytics
- Free plan + free demo available
- Pricing upon request
Visit WebsiteCustomer Rating:4.5/5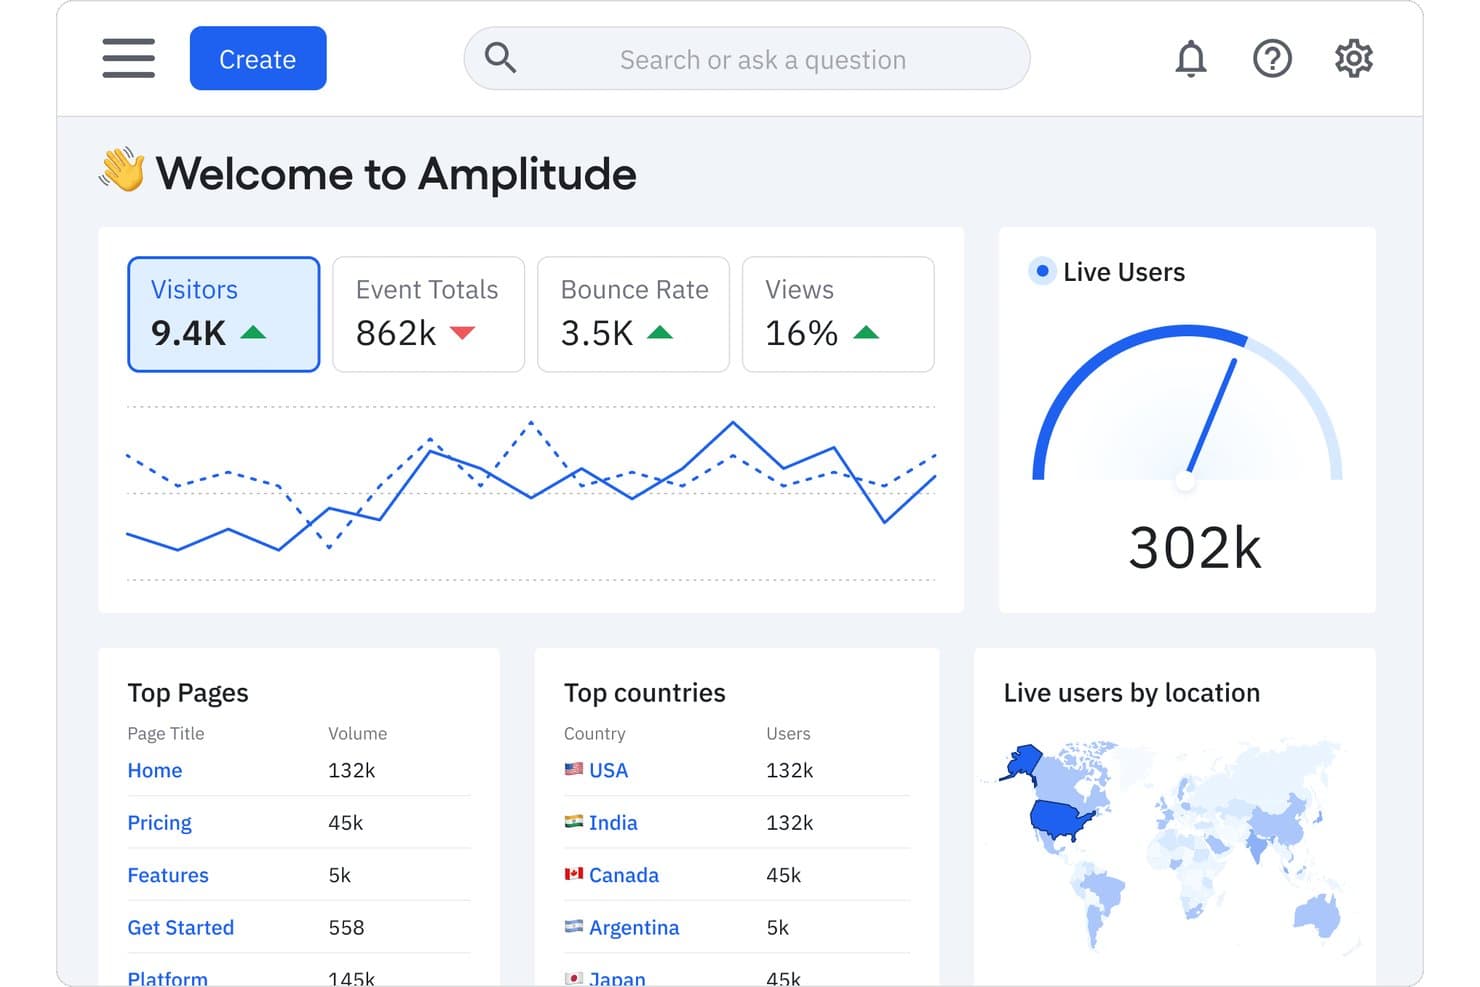
Amplitude centralizes key product metrics in one analytics dashboard. Amplitude is a product analytics platform that combines event-based behavioral tracking, funnel and retention analysis, customizable dashboards, session replay, and built-in experimentation tools.
Who Is Amplitude Best For?
Amplitude is a strong fit for product and growth teams that need to connect behavioral analytics directly to their data warehouse without duplicating data pipelines.
Why I Picked Amplitude
Amplitude earns its spot on my shortlist because of how it handles warehouse-native behavioral analytics, letting your team query event data directly in Snowflake without duplicating pipelines. I particularly like the Journeys and Pathfinder charts, which map exactly where users drop off across a flow, so you're not guessing why onboarding stalls. Pair that with funnel analysis that surfaces conversion drivers by segment, and you get a dashboard setup that feeds real roadmap decisions.
Amplitude Key Features
- Session replay: Watch recorded user sessions to see exactly how people interact with your product, including clicks, scrolls, and navigation paths.
- In-app surveys and AI feedback: Collect user feedback directly inside your product and surface themes using AI-assisted analysis across up to 2,000 records per month.
- Feature flags and experimentation: Run A/B tests and control feature rollouts with built-in experimentation tools, including multi-armed bandits on Growth and Enterprise plans.
- Tracking plan and schema validation: Define and enforce your event taxonomy in one place to keep data consistent across teams and instrumentation sources.
Amplitude Integrations
Amplitude integrates with Segment, mParticle, Snowflake, BigQuery, Redshift, Databricks, Braze, HubSpot, Salesforce, and Iterable. It also offers SDKs, an HTTP API, and webhooks for custom integrations.
Pros and Cons
Pros:
- Funnels reveal conversion drivers by segment
- Journeys expose onboarding friction points
- Warehouse-native behavioral analytics
Cons:
- Qualitative research stops short of dedicated tooling
- Complex reports can overwhelm first-time analysts
Learn more about Amplitude: Best for open-source, warehouse-native analytics
- Free plan available
- Pricing upon request
Visit WebsiteCustomer Rating:4.5/5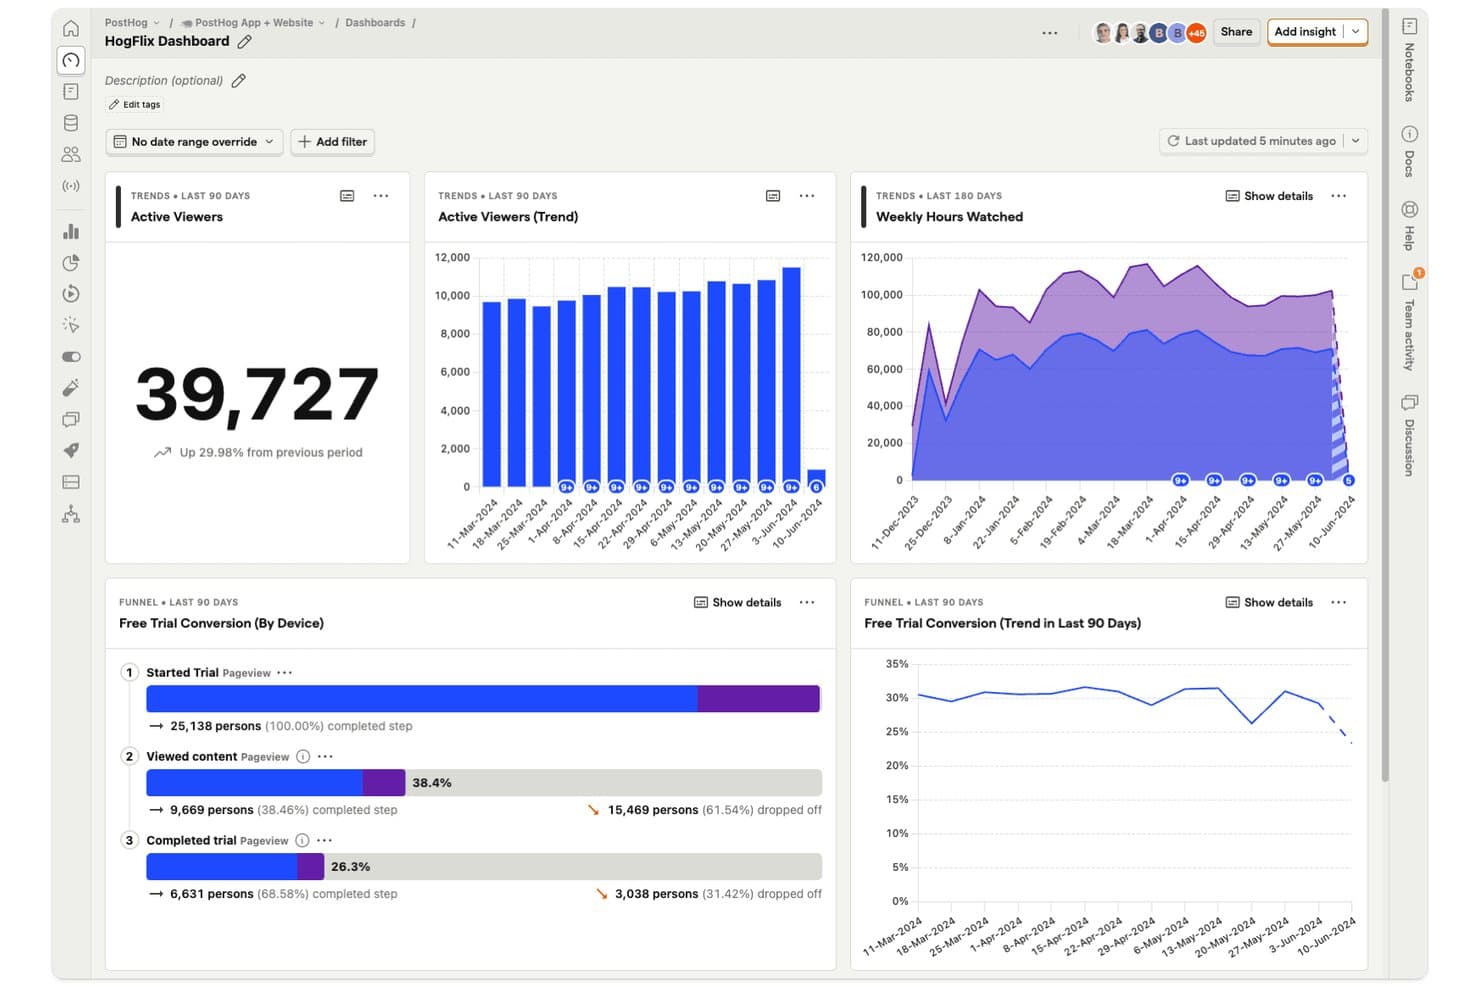
PostHog dashboards let product managers track viewer trends and funnel conversions in one view. PostHog is an open-source product analytics platform that combines event tracking, customizable dashboards, funnel and retention analysis, session replay, feature flags, in-app surveys, and a built-in data warehouse and SQL editor.
Who Is PostHog Best For?
PostHog is a strong fit for product and engineering teams that want analytics, session replay, feature flags, and a built-in data warehouse in one platform—without paying per seat.
Why I Picked PostHog
PostHog earns its spot on my shortlist because it's the only analytics platform I've found that lets product teams query raw event data, warehouse-synced sources like Stripe or Salesforce, and session replays from one place using plain SQL. I love that funnels link directly to session recordings, so when I see a drop-off in an onboarding flow, I can jump straight to the matching replays without switching tools. The built-in data warehouse and HogQL editor mean my team isn't waiting on a data team to answer product questions.
PostHog Key Features
- Autocapture: Records pageviews, clicks, and form submissions automatically, with no extra code required.
- Correlation analysis: Automatically surfaces the person and event properties most associated with conversion or drop-off in a funnel.
- In-app surveys: Collects user feedback directly inside your product, with up to 1,500 free responses per month.
- Feature flags: Controls feature rollouts per user or group, with flag status visible on each session replay.
PostHog Integrations
PostHog offers data warehouse integrations with Stripe, Postgres, Salesforce, HubSpot, and dozens of other sources. Its data pipelines connect hundreds of tools, including Slack and Intercom, with webhooks, Hog custom functions, APIs, and MCP access.
Pros and Cons
Pros:
- Autocapture speeds initial tracking setup
- SQL queries raw and warehouse data
- Funnels link directly to session replays
Cons:
- Usage costs can rise with replay volume
- Dashboard interface can confuse beginners
Learn more about PostHog: Best for quantitative and qualitative data in one view
- Free plan + free demo + 15-day free trial available
- From $39/month (billed annually)
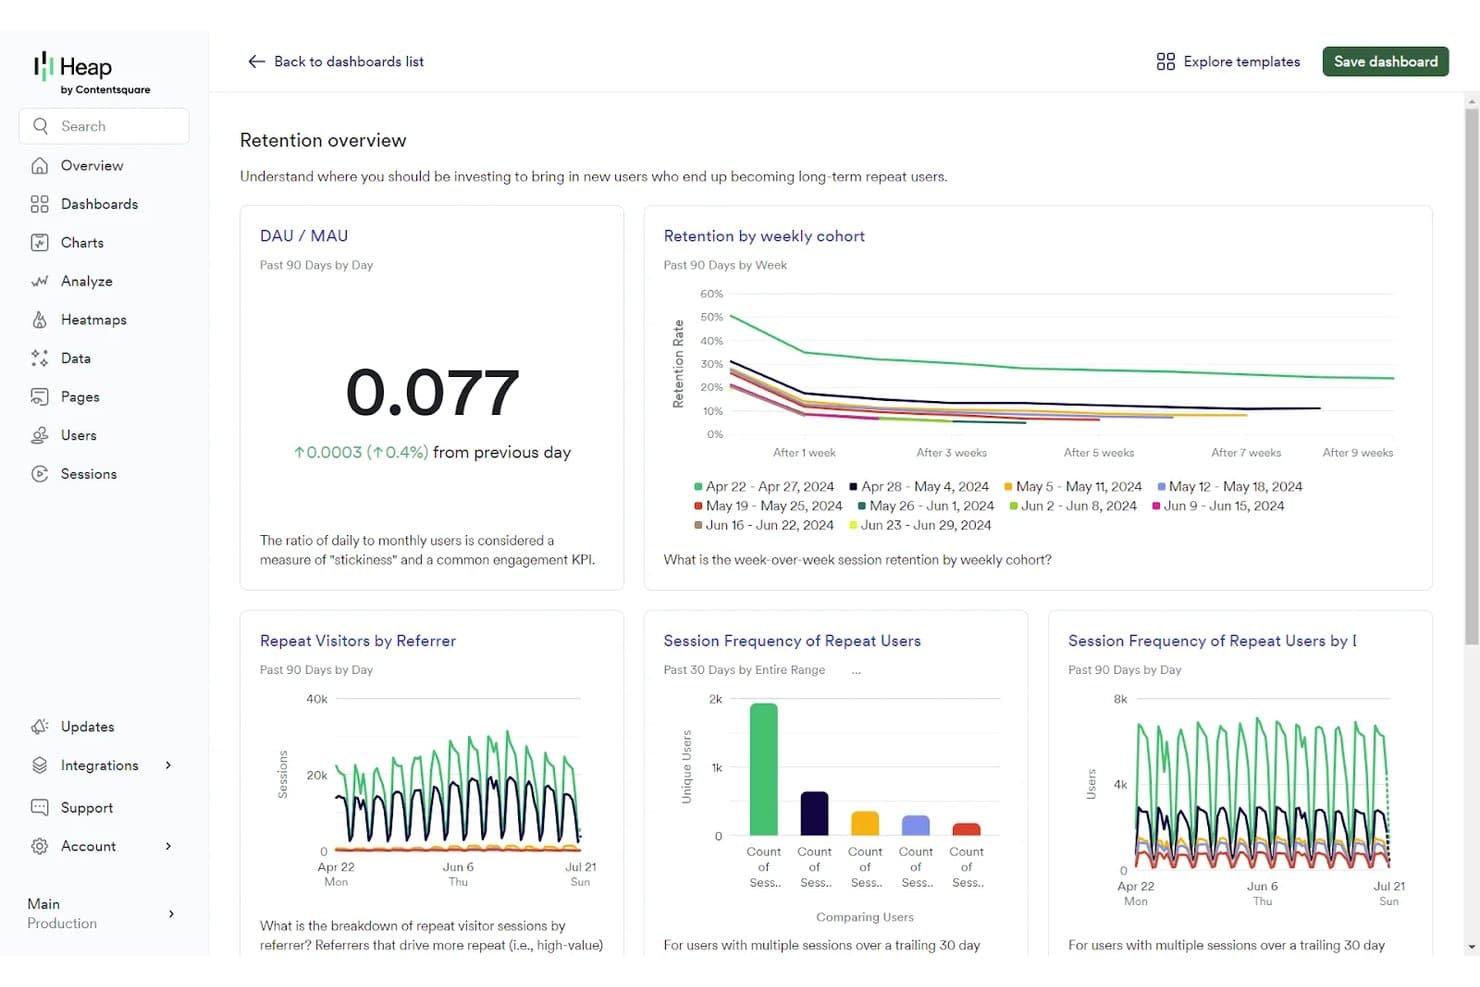
Contentsquare tracks user retention and engagement via analytics dashboards. Contentsquare is a product analytics platform that unifies behavioral tracking, session replay, heatmaps, funnel analysis, retention reporting, and Voice of Customer surveys into a single dashboard environment.
Who Is Contentsquare Best For?
Contentsquare is a strong fit for cross-functional product teams that need behavioral analytics and qualitative insight—like session replay and heatmaps—in a single platform.
Why I Picked Contentsquare
I picked Contentsquare because it's one of the few platforms where behavioral numbers and qualitative insight genuinely share the same roof. When I'm investigating a funnel drop-off, I can move from the retention chart directly into session replays filtered to that exact segment, without switching tools. Sense AI then flags the friction, estimates its revenue impact, and tells me what to fix, which cuts the time between noticing a problem and acting on it.
Contentsquare Key Features
- Smart Capture: Automatically records every user interaction from day one, with no manual tagging, enabling retroactive analysis across web and mobile.
- Enhanced Experimentation: Lets you set up A/B tests with no configuration and compare variants using ready-made dashboards and real-time alerts.
- Voice of Customer surveys: Collects in-product user feedback and displays it alongside behavioral data in the same platform environment.
- Data Connect: A managed pipeline that exports Contentsquare data directly to your data warehouse, including Snowflake and AWS.
Contentsquare Integrations
Contentsquare supports 100+ integrations and open APIs, including Shopify, AWS, Microsoft Azure, and Snowflake. Data Connect exports data to your warehouse through a managed pipeline, helping product teams combine behavioral data with broader analytics.
Pros and Cons
Pros:
- Behavioral and qualitative insights share context
- Session replays explain dashboard drop-offs quickly
- Automatic capture supports retroactive product analysis
Cons:
- Session limits can interrupt data collection
- Plan boundaries complicate cross-product reporting
Learn more about Contentsquare:
Outros painéis de análise de produtos
Eis algumas opções adicionais de painéis de análise de produtos que não entraram na minha lista restrita, mas que ainda assim vale a pena consultar:
- 11Adobe AnalyticsBest for cross-Adobe ecosystem product insights
- 12StatsigBest for analytics tied to feature flag rollouts
- 13TableauBest for BI-driven product dashboard reporting
- 14UXCamBest for mobile tap heatmaps and funnel drop-offs
- 15Zoho AnalyticsBest for blending product data with business data
- 16CleverTapBest for analytics-to-engagement in one platform
- 17LogRocketBest for AI-driven funnel and session insights
- 18Gainsight PXBest for CRM-linked product usage analytics
- 19KubitBest for AI agent and user behavior analytics
- 20Datadog Product AnalyticsBest for observability-backed user behavior dashboards
How I Evaluate Product Analytics Dashboards
I split my evaluation into three parts, starting with core functionality—specifically, whether a tool can capture discrete user events and let you build custom dashboards around them, since these carry the most weight. Next, I look for standout features like session replay or AI-generated insights. Finally, I consider onboarding ease and pricing transparency.
Core Functionality (Table Stakes for This List)
When I'm selecting tools for my list, I score each one on a scale from 0 (does not offer the functionality) to 5 (excels in this area) for each core functionality listed below. I then convert the total into a percentage to help assess each tool's overall fit, with extra weight on any functionalities I've deemed essential.
- Event-Based Tracking (Essential): I check whether each tool captures user actions as named events with custom properties, not just page views or session counts.
- Dashboard Customization (Essential): Each tool should let you build, arrange, and save your own charts and widgets rather than locking you into preset report templates.
- User Segmentation: I look for multi-condition filters that combine behavioral and demographic attributes so you can compare cohorts like trial users vs. paying accounts.
- Funnel and Retention Analysis: Drop-off diagnostics and time-to-convert metrics matter here, especially for spotting where users abandon onboarding or activation flows.
- Data Export and Sharing: I evaluate whether dashboards can be shared via links, scheduled emails, or embedded views that stakeholders actually open without needing a login.
- Third-Party Integration: Tools should sync with your data warehouse, CRM, or CDP so product data doesn't live in a silo separate from revenue or support context.
Once I have a list of tools that meet the criteria, I consider what sets each platform apart.
Differentiating Factors (What Sets Vendors Apart)
Here's how I compare and contrast different vendors:
Standout Features
Session replay is the first thing I check because it bridges the gap between what your dashboards say and what actually happened. I look for tools that let you jump from a funnel drop-off chart directly into a recording of a user who churned at that step. AI-generated insights also matter—I evaluate whether a tool surfaces anomalies automatically or just waits for you to ask the right question. Feature flag integration rounds this out by tying experiment rollouts directly to usage data, so you can measure impact without stitching tools together manually.
Beyond Features
I evaluate how quickly a team can go from SDK install to a working dashboard without filing engineering tickets. Tools with auto-capture or no-code event tracking—like those offered by Heap and PostHog—shrink that gap considerably. Pricing models matter too, since event-based or MTU-based tiers can quietly balloon costs as your product scales. I also check data privacy controls, especially data residency options and PII handling, which become non-negotiable when your user base spans multiple regions subject to GDPR or CCPA.
Como escolher um painel de análise de produtos
É fácil perder-se em listas extensas de funcionalidades e estruturas de preços complexas. Para o ajudar a manter o foco enquanto analisa o seu processo específico de seleção de software, eis uma lista de verificação dos fatores a ter em conta:
| Fator | O que considerar |
|---|---|
| FatorEscalabilidade | O que considerarA ferramenta pode crescer com a sua empresa? Verifique se consegue lidar com volumes de dados e números de utilizadores maiores sem problemas de desempenho. Considere os planos de crescimento futuro. |
| FatorIntegrações | O que considerarIntegra-se com as ferramentas que já utiliza? Certifique-se de que estabelece uma ligação fluida com o seu CRM, plataformas de marketing e outras aplicações essenciais. |
| FatorPersonalização | O que considerarPode adaptá-la aos seus fluxos de trabalho? Procure opções de personalização que lhe permitam adaptar os painéis e relatórios às necessidades da sua equipa. |
| FatorFacilidade de utilização | O que considerarA interface é intuitiva? Avalie se os membros da equipa conseguem aprender a utilizá-la rapidamente. Uma ferramenta complexa pode dificultar a adoção. |
| FatorImplementação e integração inicial | O que considerarQuanto tempo demora a configuração? Avalie os recursos necessários para a integração inicial e se existe suporte para o orientar durante o processo. |
| FatorCusto | O que considerarEnquadra-se no seu orçamento? Compare os planos de preços e procure custos ocultos. Considere o valor oferecido pelo preço. |
| FatorMedidas de segurança | O que considerarOs seus dados estão protegidos? Verifique a conformidade com as normas de segurança e a encriptação de dados para garantir que as informações sensíveis estão seguras. |
| FatorDisponibilidade do suporte | O que considerarExiste ajuda quando é necessária? Procure opções de suporte 24 horas por dia, 7 dias por semana, e avalie a capacidade de resposta e a utilidade da equipa de suporte. |
O que são painéis de análise de produtos?
Os painéis de análise de produtos são ferramentas que mostram como as pessoas utilizam o seu produto, dividindo as suas ações em gráficos e diagramas fáceis de ler. Os gestores de produto, designers de UX e profissionais de marketing utilizam estes painéis para identificar tendências, descobrir onde os utilizadores ficam bloqueados e tomar melhores decisões sobre o que devem melhorar a seguir. Pode ver aspetos como os locais onde as pessoas clicam, as funcionalidades mais apreciadas e os momentos em que os utilizadores abandonam o produto — para saber exatamente onde se deve concentrar para melhorar o seu produto.
Funcionalidades
Ao selecionar um painel de análise de produtos, procure as seguintes funcionalidades principais:
- Reprodução de sessões: Permite ver sessões de utilizadores gravadas para compreender os percursos dos utilizadores e identificar pontos de fricção.
- Mapas de calor: Apresentam visualmente as interações dos utilizadores com o seu produto, destacando as áreas de interesse e de negligência.
- Análise de funil: Acompanha os percursos de conversão dos utilizadores para identificar em que ponto abandonam o processo.
- Painéis personalizáveis: Permitem adaptar o painel para se concentrar nas métricas e nos KPI mais importantes para a sua equipa.
- Alertas em tempo real: Fornecem notificações instantâneas sobre alterações significativas no comportamento dos utilizadores ou nos KPI.
- Segmentação de utilizadores: Analisa o comportamento dos utilizadores com base em critérios específicos, permitindo obter informações direcionadas.
- Integrações: Estabelecem ligação de forma integrada com outras ferramentas e plataformas essenciais utilizadas pela sua equipa.
- Análise preditiva: Utiliza dados para prever tendências futuras e o comportamento dos utilizadores, ajudando na tomada de decisões proativa.
- Segurança dos dados: Garante a proteção dos dados sensíveis dos utilizadores e a conformidade com as normas do setor.
- Tours interativos do produto: Oferecem percursos guiados para ajudar os utilizadores a compreender e utilizar rapidamente a ferramenta de forma eficaz.
Benefícios
A implementação de um painel de análise de produtos proporciona vários benefícios à sua equipa e à sua empresa. Eis alguns dos benefícios que pode esperar:
- Melhoria da tomada de decisões: O acesso a dados detalhados e a informações relevantes ajuda a sua equipa a tomar decisões informadas sobre o produto.
- Experiência do utilizador melhorada: Funcionalidades como a reprodução de sessões e os mapas de calor identificam os pontos problemáticos para os utilizadores, permitindo realizar melhorias direcionadas.
- Aumento das conversões: A análise de funil identifica em que ponto os utilizadores abandonam o processo, permitindo otimizar os percursos de conversão.
- Afetação eficiente de recursos: Os painéis personalizáveis centram-se nas métricas principais, ajudando a dar prioridade aos esforços e recursos da equipa.
- Resolução proativa de problemas: Os alertas em tempo real e a análise preditiva permitem resolver os problemas antes de estes afetarem os utilizadores.
- Maior envolvimento dos utilizadores: A segmentação de utilizadores fornece informações sobre diferentes grupos de utilizadores, permitindo criar estratégias de envolvimento personalizadas.
Custos e preços
A seleção de um painel de análise de produtos exige uma compreensão dos vários modelos de preços e planos disponíveis. Os custos variam consoante as funcionalidades, o tamanho da equipa, os complementos e outros fatores. A tabela abaixo resume os planos comuns, os seus preços médios e as funcionalidades normalmente incluídas nas soluções de painéis de análise de produtos:
Tabela de comparação de planos para painéis de análise de produtos
| Tipo de plano | Preço médio | Funcionalidades comuns |
|---|---|---|
| Tipo de planoPlano gratuito | Preço médio$0 | Funcionalidades comunsAnálise básica, armazenamento de dados limitado e apoio essencial. |
| Tipo de planoPlano pessoal | Preço médio$10-$30/user/month | Funcionalidades comunsAnálise avançada, painéis personalizados e apoio por e-mail. |
| Tipo de planoPlano empresarial | Preço médio$40-$80/user/month | Funcionalidades comunsFerramentas de colaboração em equipa, acesso à API e apoio prioritário. |
| Tipo de planoPlano empresarial avançado | Preço médio$100-$200/user/month | Funcionalidades comunsIntegrações personalizadas, gestão de conta dedicada e funcionalidades de segurança de nível empresarial. |
Perguntas frequentes sobre painéis de análise de produtos
Eis algumas respostas a perguntas comuns sobre painéis de análise de produtos:
Como posso garantir a segurança dos dados com um painel de análise de produtos?
Para garantir a segurança dos dados com um painel de análise de produtos, verifique se a plataforma cumpre as normas do setor. Procure funcionalidades como encriptação de dados, controlos de acesso e auditorias de segurança regulares. Pergunte ao fornecedor sobre as respetivas políticas de proteção de dados e se disponibiliza apoio em matéria de conformidade com regulamentos como o RGPD ou a CCPA. É crucial escolher um painel que dê prioridade à segurança dos dados para proteger informações sensíveis dos utilizadores e manter a confiança dos seus clientes.
É necessário receber formação para utilizar eficazmente um painel de análise de produtos?
Sim, poderá ser necessária alguma formação para utilizar eficazmente um painel de análise de produtos. Embora muitas plataformas disponibilizem interfaces intuitivas, compreender todas as suas funcionalidades pode levar algum tempo. Procure fornecedores que disponibilizem recursos de formação, como seminários online, tutoriais e guias do utilizador. Estes recursos podem ajudar a sua equipa a familiarizar-se rapidamente com a ferramenta e a tirar o máximo partido das suas funcionalidades. Investir em formação pode conduzir a uma interpretação mais precisa dos dados e a uma melhor tomada de decisões.
Como posso medir o impacto de uma nova funcionalidade utilizando um painel de análise de produtos?
Pode configurar o acompanhamento de eventos para a funcionalidade no seu painel e criar relatórios de conversão ou de funil para ver quantos utilizadores a adotam efetivamente. Compare o comportamento antes e depois do lançamento entre segmentos (por exemplo, tipos de planos e regiões) para detetar alterações na utilização ou desistências. Utilize estas informações para decidir se vale a pena expandir a funcionalidade ou se esta precisa de ser iterada.
Quais são os pontos de desistência mais comuns que devo monitorizar num painel de análise de produtos?
Os pontos de desistência mais comuns incluem o processo de integração inicial, a conversão de avaliação para cliente pagante, a ativação de novos utilizadores e os percursos de descoberta de funcionalidades. O seu painel deve mostrar onde os utilizadores abandonam o processo, quanto tempo demoram a concluir as etapas principais e quais as etapas que causam dificuldades. Isto ajuda a dar prioridade às correções, em vez de tentar adivinhar onde podem estar os problemas.
Como posso alinhar as métricas do painel com os resultados do negócio, em vez de me limitar às estatísticas de utilização?
Vá além dos KPI superficiais, como os utilizadores ativos diários, definindo métricas que estabeleçam uma ligação com o valor para o negócio — como o tempo até obter valor (a rapidez com que os utilizadores percebem o benefício), a taxa de retenção de utilizadores de elevado valor ou a taxa de conversão para planos superiores. Associe essas métricas no seu painel para acompanhar como as ações dos utilizadores se refletem na receita, na perda de clientes ou na expansão. Esse alinhamento torna a sua análise mais útil para a tomada de decisões.
O que devo ter em conta ao partilhar painéis de análise de produtos entre várias equipas?
Certifique-se de que o seu painel é compreensível para as partes interessadas não técnicas: inclua etiquetas claras, evite jargão e adapte as vistas às diferentes funções (por exemplo, operações de produto e direção). Defina limites de alerta para que as equipas recebam notificações quando as métricas se desviarem. Certifique-se também de que os controlos de acesso estão corretamente configurados, para que as pessoas vejam apenas os dados relevantes e as suas equipas se mantenham alinhadas quanto à terminologia e às definições.