

Le 10 migliori alternative a Tableau recensite nel 2026

Migliori alternative a Tableau: la shortlist


Orientarsi nelle complessità della visualizzazione dei dati può essere scoraggiante. Se Tableau non soddisfa le tue esigenze, non sei solo. Molti product manager cercano alternative per una maggiore personalizzazione, facilità d’uso o funzionalità specifiche adatte alle sfide uniche del proprio team.
Secondo la mia esperienza, lo strumento giusto può trasformare il modo in cui interpreti i dati, rendendoli accessibili e utili per il tuo team. Ho testato e recensito autonomamente diversi software per trovare le migliori alternative a Tableau che rispondono a esigenze differenti.
In questo articolo ti guiderò tra le mie scelte principali, concentrandomi su come ogni opzione possa rispondere alle tue problematiche specifiche. Troviamo insieme la soluzione più adatta al percorso data-driven del tuo team.
Cos’è Tableau?
Tableau è un software di business intelligence e visualizzazione dati che aiuta te e il tuo team a comprendere dati complessi. È comunemente utilizzato da analisti, professionisti della business intelligence e product manager che hanno bisogno di avere chiare informazioni dai propri dati. La funzionalità drag-and-drop, le analisi in tempo reale e le dashboard interattive aiutano a trasformare dati grezzi in informazioni operative. In generale, Tableau offre al tuo team un modo efficace per visualizzare i dati, favorendo decisioni informate.
Riepilogo delle migliori alternative a Tableau
Questa tabella riepilogativa mostra i prezzi delle migliori alternative a Tableau per aiutarti a trovare quella più adatta al tuo budget e alle esigenze aziendali.
| Tool | Best For | Trial Info | Price | ||
|---|---|---|---|---|---|
| 1 | Ideale per l'analisi basata sull'intelligenza artificiale | Prova gratuita di 30 giorni + demo gratuita disponibile | Da $300/mese (fatturato annualmente) | Website | |
| 2 | Ideale per l'analisi integrata | Prova gratuita di 30 giorni + demo gratuita disponibile | Prezzi su richiesta | Website | |
| 3 | Ideale per l'osservabilità dei dati | Piano gratuito + prova gratuita disponibile | A partire da $19/mese + utilizzo | Website | |
| 4 | Ideale per l'utilizzo nell'ecosistema Google | Piano gratuito disponibile | Da $9/utente/progetto/mese | Website | |
| 5 | Ideale per l'integrazione con Microsoft | Piano gratuito disponibile | A partire da $14/utente/mese (con fatturazione annuale) | Website | |
| 6 | Ideale per l'analisi open source | Piano gratuito disponibile | A partire da $90/mese (con fatturazione annuale) | Website | |
| 7 | Ideale per soluzioni personalizzabili | Prova gratuita di 7 giorni + demo gratuita disponibile | Prezzi su richiesta | Website | |
| 8 | Ideale per informazioni in tempo reale | Prova gratuita di 14 giorni + dimostrazione gratuita disponibile | A partire da $25/user/month (con fatturazione annuale) | Website | |
| 9 | Ideale per le query SQL | Non disponibile | Prezzi su richiesta | Website | |
| 10 | Ideale per un'interfaccia a foglio di calcolo | Prova gratuita + demo gratuita disponibili | Prezzi su richiesta | Website |
Perché Fidarsi delle Nostre Recensioni Software
Testiamo e recensiamo software per il product management dal 2020. Come product manager sappiamo quanto sia fondamentale e difficile fare la scelta giusta in termini di software. Investiamo in una ricerca approfondita per aiutare il nostro pubblico a prendere decisioni migliori sugli acquisti di software. Abbiamo testato oltre 2.000 strumenti per diversi casi d’uso e scritto più di 1.000 recensioni approfondite.Scopri come assicuriamo la trasparenza & la nostra metodologia di recensione software.
Recensioni delle migliori alternative a Tableau
Qui sotto trovi i miei riassunti dettagliati delle alternative a Tableau che hanno superato la shortlist. Le mie recensioni offrono una panoramica approfondita delle funzionalità principali, dei pro e contro, delle integrazioni e dei casi d’uso ideali di ogni strumento, per aiutarti a trovare quello più adatto alle tue esigenze.

Qlik
Ideale per l'analisi basata sull'intelligenza artificiale
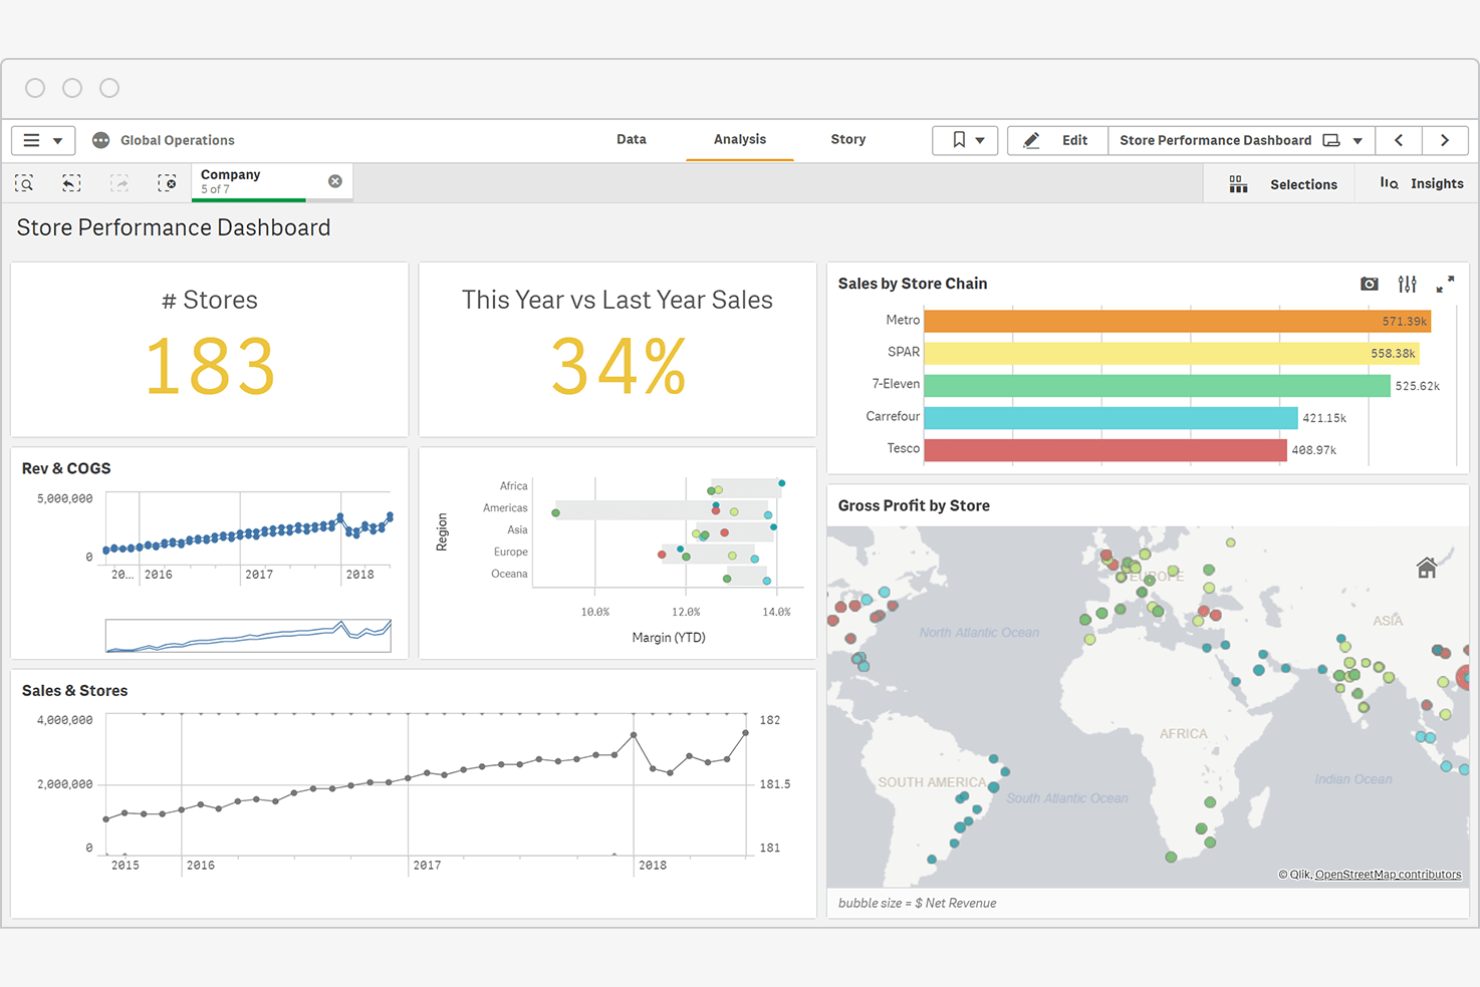
Qlik è una piattaforma di business intelligence che offre strumenti di analisi basati sull'intelligenza artificiale, integrazione dei dati e visualizzazione. Viene utilizzata in settori come quello finanziario, sanitario e della vendita al dettaglio per facilitare il processo decisionale basato sui dati.
Perché Qlik è una buona alternativa a Tableau: le analisi basate sull'intelligenza artificiale di Qlik offrono informazioni predittive che possono aiutare il tuo team a individuare schemi nascosti nei dati. L'integrazione dei dati in tempo reale della piattaforma garantisce informazioni aggiornate per prendere decisioni migliori. I suoi strumenti di BI supportano sia la distribuzione basata sul cloud sia quella locale.
Funzionalità e integrazioni principali:
Le funzionalità includono un motore di dati associativo che consente di esplorare connessioni che gli strumenti tradizionali potrebbero non rilevare. Tu e il tuo team potete trarre vantaggio dall'attenzione dedicata all'alfabetizzazione dei dati, che offre risorse per migliorare la comprensione e l'utilizzo dei dati da parte dei dipendenti.
Le integrazioni includono AWS, Google Cloud, Microsoft Azure, SAP e altro ancora.
Pros and Cons
Pros:
- Rilevamento automatico delle tendenze predittive
- Attenzione dedicata all'alfabetizzazione dei dati
- Indicizzazione dei dati tramite motore associativo
Cons:
- Prezzo di partenza più elevato
- Conoscenze specialistiche dello scripting proprietario

Domo
Ideale per l'analisi integrata

Domo è una piattaforma di business intelligence basata sul cloud che aiuta te e il tuo team a visualizzare e analizzare i dati in tempo reale. Fornisce ai responsabili delle decisioni di diversi settori le informazioni necessarie per favorire la crescita aziendale.
Perché Domo è una buona alternativa a Tableau: Domo eccelle nell'analisi integrata, consentendo di integrare gli strumenti di analisi dei dati nelle applicazioni esistenti. Le sue funzionalità per i dati in tempo reale garantiscono al tuo team l'accesso alle informazioni più aggiornate. Il design della piattaforma, pensato innanzitutto per i dispositivi mobili, consente di accedere ai dati ovunque ti trovi.
Funzionalità e integrazioni distintive:
Le funzionalità includono un'interfaccia con trascinamento che semplifica la creazione di dashboard personalizzate. Puoi automatizzare i flussi di lavoro dei dati per velocizzare le attività che richiedono più tempo. La funzionalità di analisi predittiva della piattaforma ti aiuta a prevedere le tendenze e a prendere decisioni informate.
Le integrazioni includono Salesforce, Google Analytics, Amazon Redshift, Microsoft Azure, Dropbox, Box, Slack, HubSpot, Zendesk, Mailchimp e altro ancora.
Pros and Cons
Pros:
- Acquisizione di dati nelle pipeline ad alta frequenza
- Trasformazioni ETL Magic flessibili
- Supporto per l'analisi integrata
Cons:
- L'implementazione in più reparti richiede tempo
- Richiede competenze tecniche

Grafana
Ideale per l'osservabilità dei dati
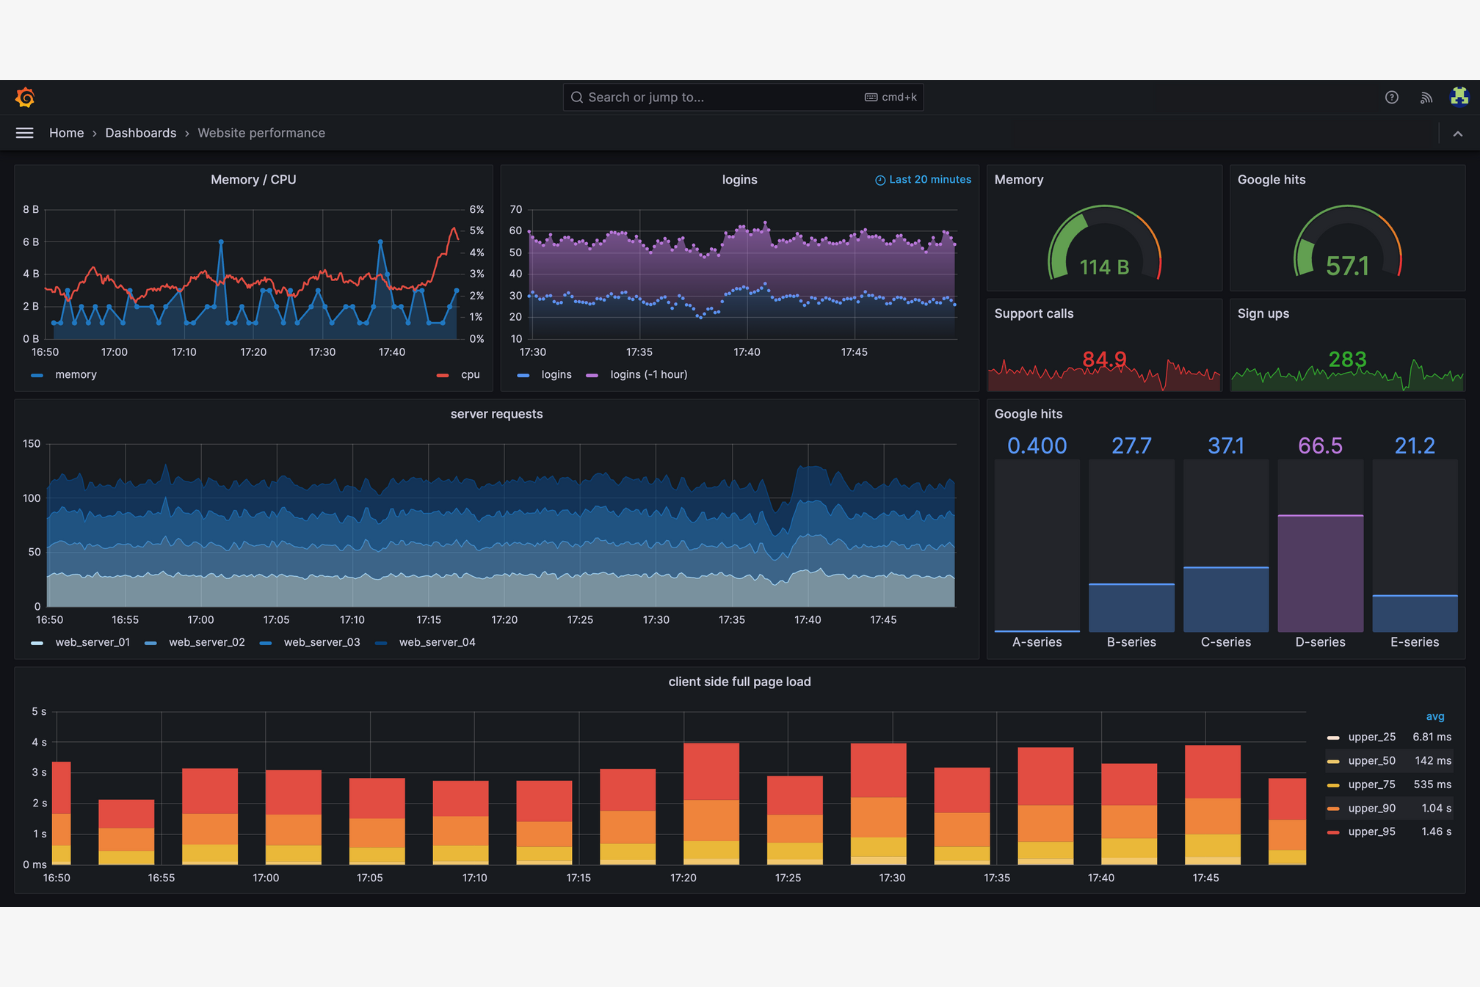
Grafana è una piattaforma open source per il monitoraggio e l'osservabilità, utilizzata principalmente dai team IT e DevOps. Consente di visualizzare metriche e log e di eseguire il tracciamento su più origini dati, fornendo una visione completa dello stato del sistema.
Perché Grafana è una buona alternativa a Tableau: Grafana eccelle nell'osservabilità dei dati, consentendo al team di monitorare le prestazioni del sistema in tempo reale. La natura open source della piattaforma permette un'ampia personalizzazione e miglioramenti guidati dalla community.
Funzionalità e integrazioni principali:
Le funzionalità includono un ricco insieme di opzioni di visualizzazione che consentono di creare dashboard dettagliate. È possibile utilizzare la funzione di avviso per configurare notifiche basate su soglie specifiche. La piattaforma supporta i plugin, consentendo di estenderne le funzionalità secondo necessità.
Le integrazioni includono Microsoft IIS, Istio, Kafka, Linux Server, MongoDB, MySQL, PostgreSQL, SNMP, Windows e altro.
Pros and Cons
Pros:
- Ampia osservabilità dei dati
- Monitoraggio delle prestazioni in tempo reale
- Sistema di avvisi flessibile
Cons:
- Requisiti di configurazione orientati a DevOps
- Rendering nel browser che richiede molte risorse

Ideale per l'utilizzo nell'ecosistema Google
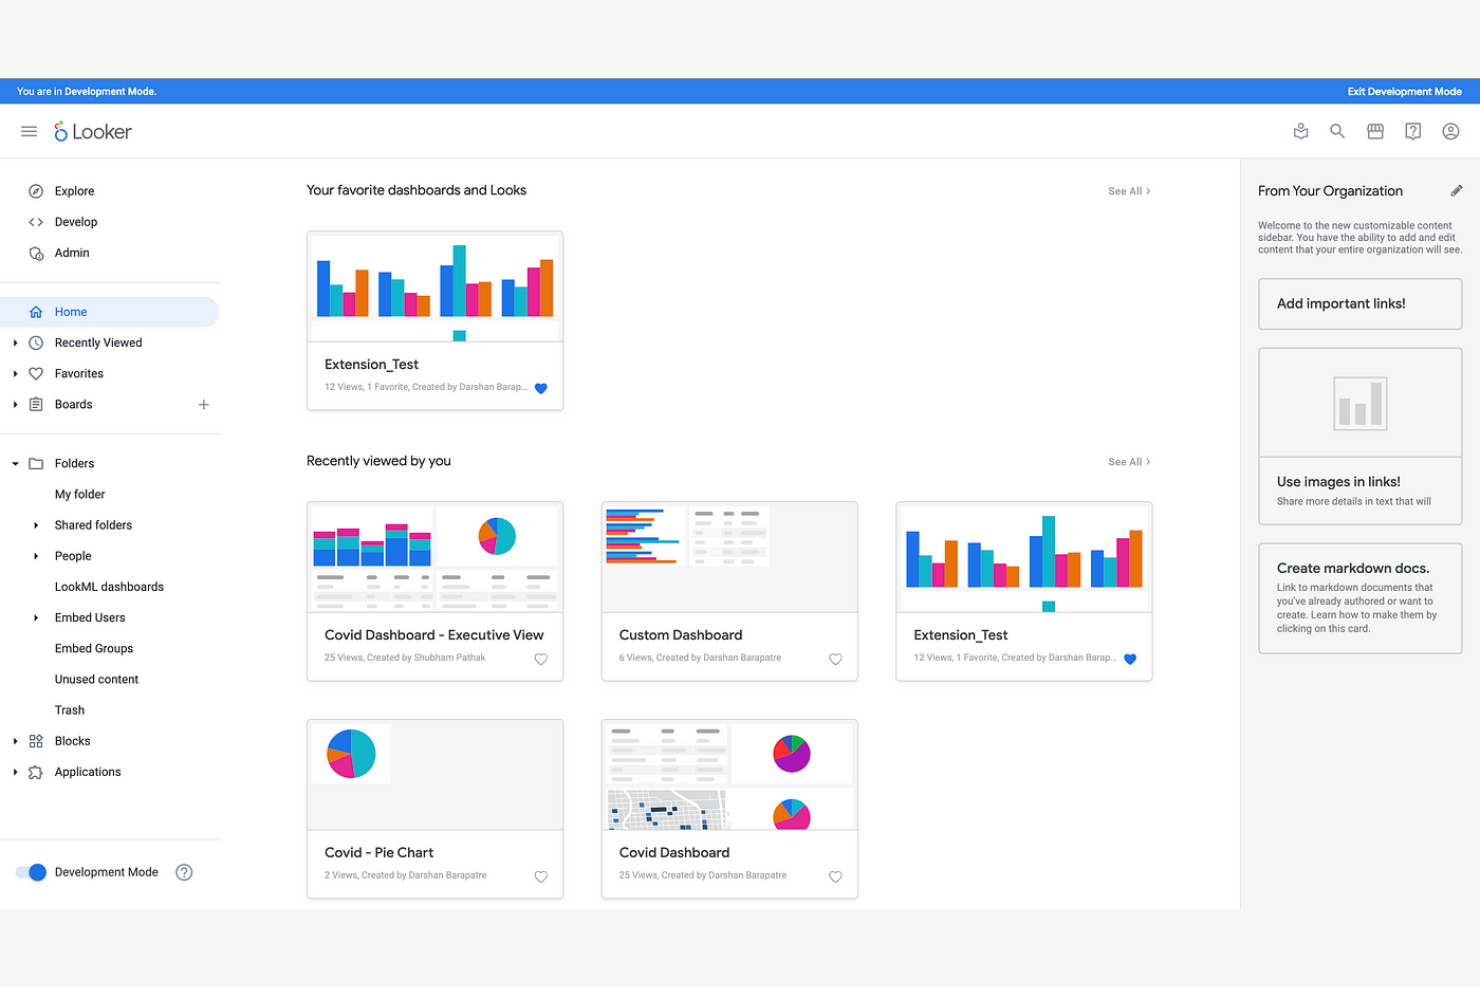
Looker Studio, la nuova versione di Google Data Studio, è una piattaforma di analisi e visualizzazione dei dati progettata per gli utenti aziendali che desiderano creare report e pannelli di controllo significativi.
Perché Looker Studio è una buona alternativa a Tableau: Looker Studio si integra con i prodotti Google, il che lo rende ideale se il tuo team si affida all'ecosistema Google. Offre funzionalità di modellazione dei dati che consentono di esplorare i dati senza dover conoscere approfonditamente SQL. Puoi condividere facilmente le informazioni tra i tuoi spazi di lavoro grazie alle sue funzionalità intuitive e collaborative.
Funzionalità e integrazioni principali:
Le funzionalità includono un'interfaccia con trascinamento che semplifica la creazione dei report. Puoi utilizzare visualizzazioni personalizzate per rappresentare meglio i tuoi dati. La possibilità di programmare i report ti aiuta a mantenere il team aggiornato sulle informazioni più recenti.
Le integrazioni includono Google Analytics, Google Ads, BigQuery, Google Sheets, Google Cloud, YouTube Analytics, MySQL, PostgreSQL, Amazon Redshift e altro ancora.
Pros and Cons
Pros:
- Collegamento nativo a BigQuery e Workspace
- Modellazione dei dati senza SQL avanzato
- Interfaccia con trascinamento
Cons:
- Ecosistema limitato di connettori di terze parti
- Minore flessibilità con dati non Google

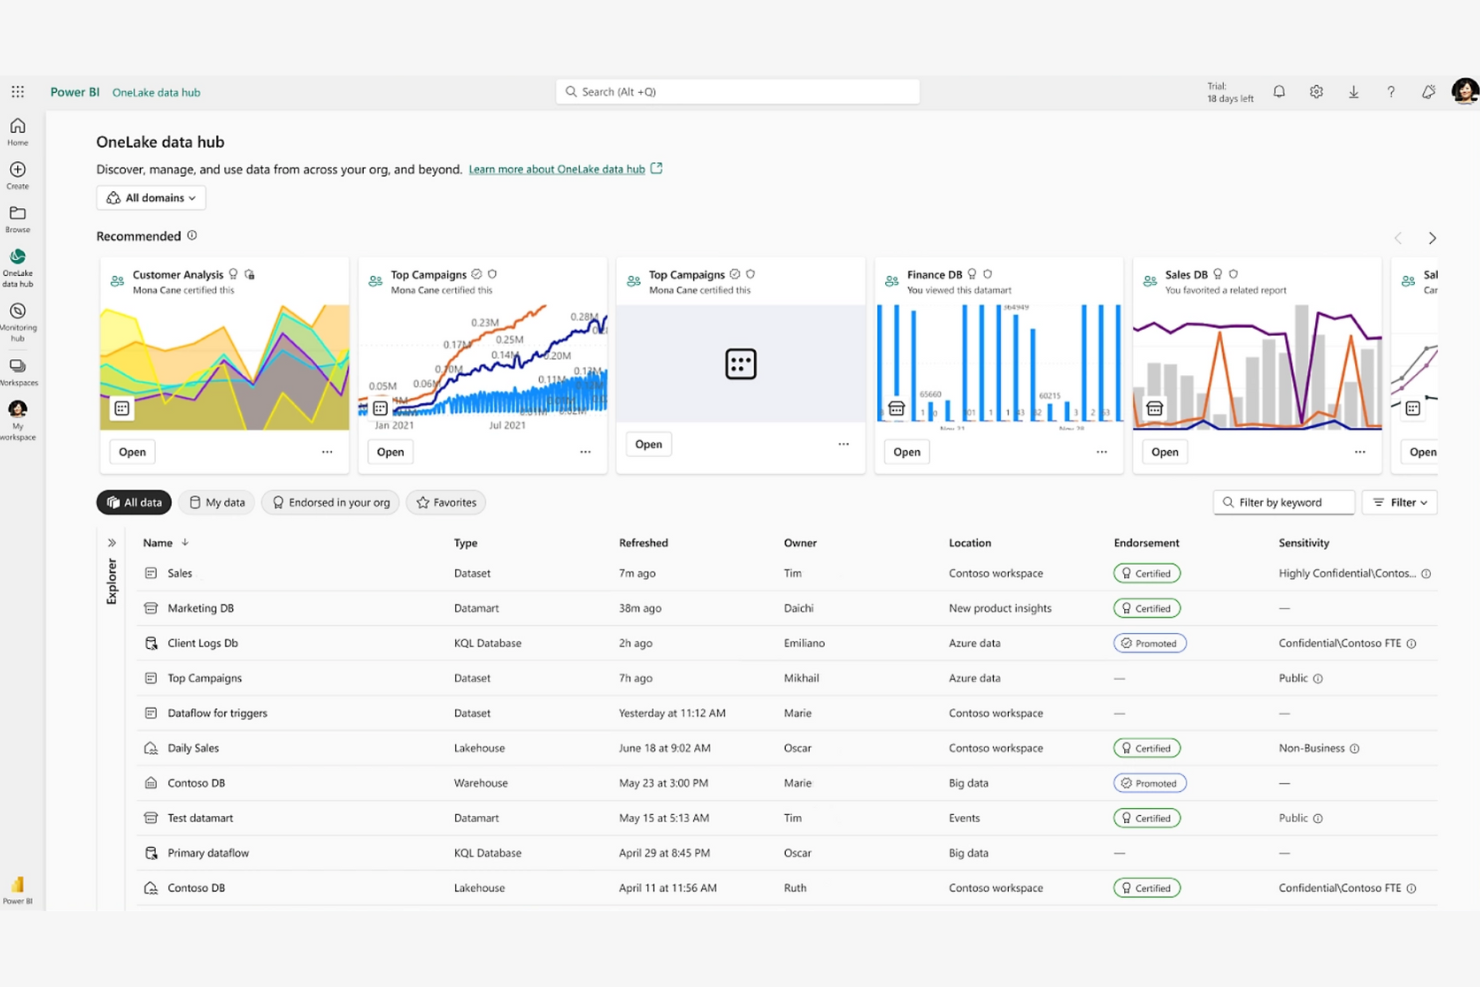
Power BI è uno strumento di intelligenza aziendale e visualizzazione dei dati utilizzato dagli analisti dei dati e dai professionisti aziendali per visualizzare e condividere informazioni. Questa piattaforma di BI aiuta te e il tuo team a creare facilmente report e pannelli di controllo interattivi.
Perché Power BI è una buona alternativa a Tableau: Si integra con i prodotti Microsoft, risultando ideale se utilizzi già l'ecosistema Microsoft. La sua interfaccia con funzionalità di trascinamento, gli aggiornamenti dei dati in tempo reale e le informazioni basate sull'intelligenza artificiale offrono un modo intuitivo per analizzare i dati. Apprezzerai la funzionalità di query in linguaggio naturale, che ti consente di porre domande sui tuoi dati in inglese semplice. È una buona scelta se cerchi uno strumento che si integri bene con le applicazioni Microsoft Office.
Funzionalità e integrazioni principali:
Le funzionalità includono capacità di modellazione dei dati che consentono di creare modelli di dati complessi senza conoscenze tecniche avanzate. Puoi condividere informazioni tramite strumenti di collaborazione basati sul cloud, rendendo il lavoro di squadra più efficiente. Il supporto per l'app mobile garantisce l'accesso alle informazioni sui dati anche in mobilità.
Le integrazioni includono Microsoft Excel, Salesforce Analytics, Zendesk e altro ancora.
Pros and Cons
Pros:
- Interoperabilità nativa con Office 365
- Supporto per set di dati in streaming automatizzato
- Query in linguaggio naturale
Cons:
- Integrazioni non Microsoft limitate
- Requisiti di sintassi DAX complessi

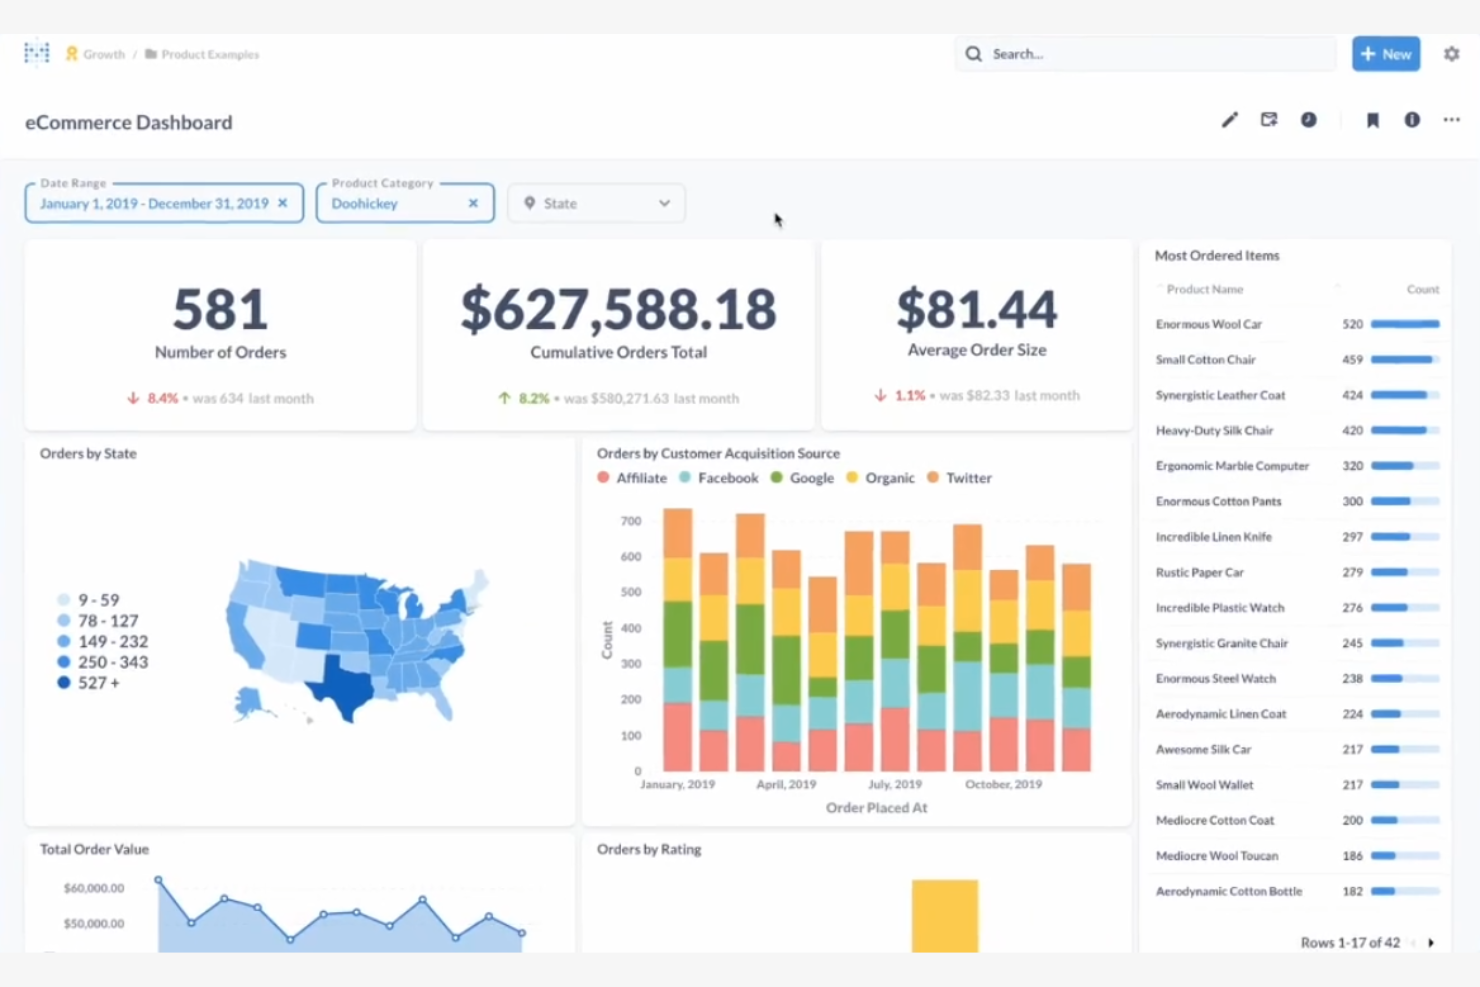
Metabase è uno strumento open source di intelligenza aziendale che semplifica l'analisi dei dati per gli utenti non tecnici. È ideale per i gruppi di lavoro che desiderano esplorare i dati attraverso visualizzazioni intuitive e pannelli di controllo facili da usare.
Perché Metabase è una buona alternativa a Tableau: Metabase offre analisi open source, garantendo al gruppo di lavoro la flessibilità necessaria per personalizzare ed estendere la piattaforma secondo le proprie esigenze. È possibile creare visualizzazioni senza scrivere interrogazioni SQL, rendendo la preparazione dei dati accessibile a tutti i membri del gruppo di lavoro. L'attenzione della piattaforma alla facilità d'uso consente di configurarla rapidamente e iniziare subito ad analizzare i dati. Lo sviluppo guidato dalla community fa sì che la piattaforma venga continuamente migliorata e aggiornata.
Funzionalità e integrazioni principali:
Le funzionalità includono un'interfaccia intuitiva che consente di porre domande e ottenere risposte senza conoscenze tecniche. La piattaforma supporta interrogazioni ad hoc, permettendo di esplorare i dati al momento. È inoltre possibile programmare i rapporti per mantenere il gruppo di lavoro aggiornato sulle informazioni più recenti.
Le integrazioni includono Amazon Redshift, Google Sheets, BigQuery, caricamenti CSV, Databricks e altro.
Pros and Cons
Pros:
- Autonomia nella distribuzione con hosting autonomo
- Nessun SQL necessario per le visualizzazioni
- Supporta interrogazioni ad hoc
Cons:
- Profondità limitata nella modellazione statistica
- Dipendenza dal supporto della community

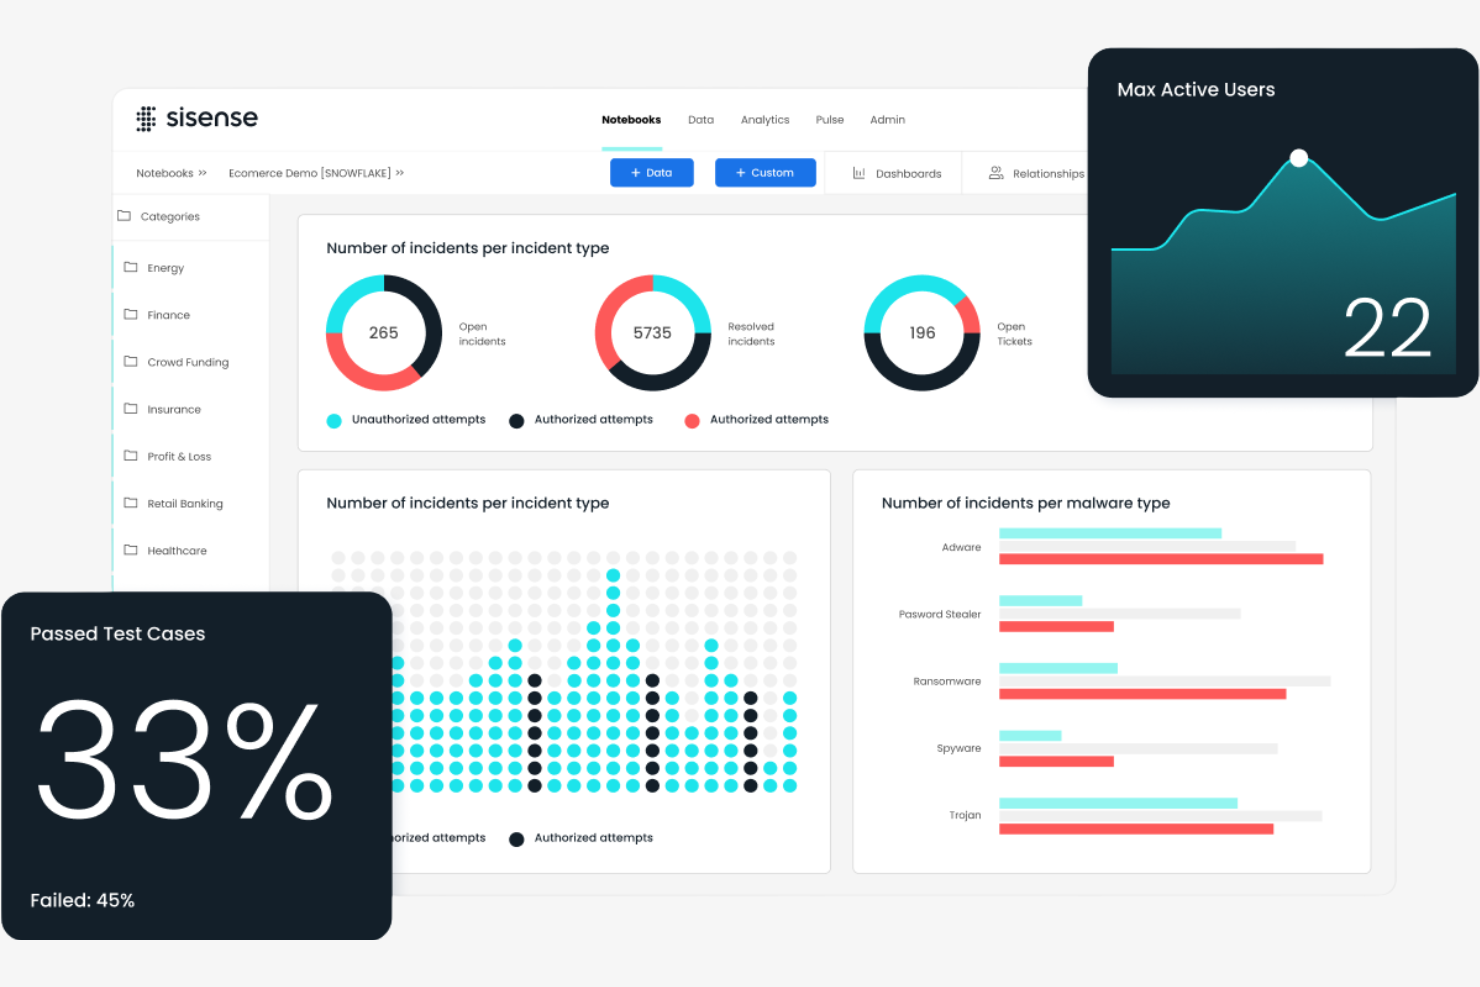
Sisense è una piattaforma di business intelligence e analisi progettata per i professionisti dei dati e gli utenti aziendali. Aiuta te e il tuo team ad analizzare dati complessi e a creare dashboard interattive per prendere decisioni informate.
Perché Sisense è una valida alternativa a Tableau: Sisense offre soluzioni personalizzabili, consentendoti di adattare la piattaforma alle tue esigenze. La sua tecnologia integrata nel chip accelera l'elaborazione dei dati, permettendo al tuo team di eseguire analisi più rapide. Puoi integrare le analisi direttamente nelle tue applicazioni, fornendo informazioni dove sono più necessarie. La piattaforma offre inoltre opzioni di personalizzazione del marchio, consentendoti di presentare la soluzione come tua.
Funzionalità e integrazioni distintive:
Le funzionalità includono un'architettura a stack singolo che semplifica l'analisi dei dati. Puoi utilizzare la funzionalità ElastiCube per archiviare e recuperare i dati in modo efficiente. La piattaforma offre anche funzionalità di apprendimento automatico, aiutandoti a fare nuove scoperte sui tuoi dati.
Le integrazioni includono Salesforce, Google BigQuery, Amazon Redshift, Snowflake, HubSpot e altro.
Pros and Cons
Pros:
- Elaborazione ad alta velocità con tecnologia integrata nel chip
- Opzioni di personalizzazione del marchio
- Funzionalità di apprendimento automatico
Cons:
- Configurazione di ElastiCube ad alta intensità di risorse
- Sono necessari aggiornamenti frequenti

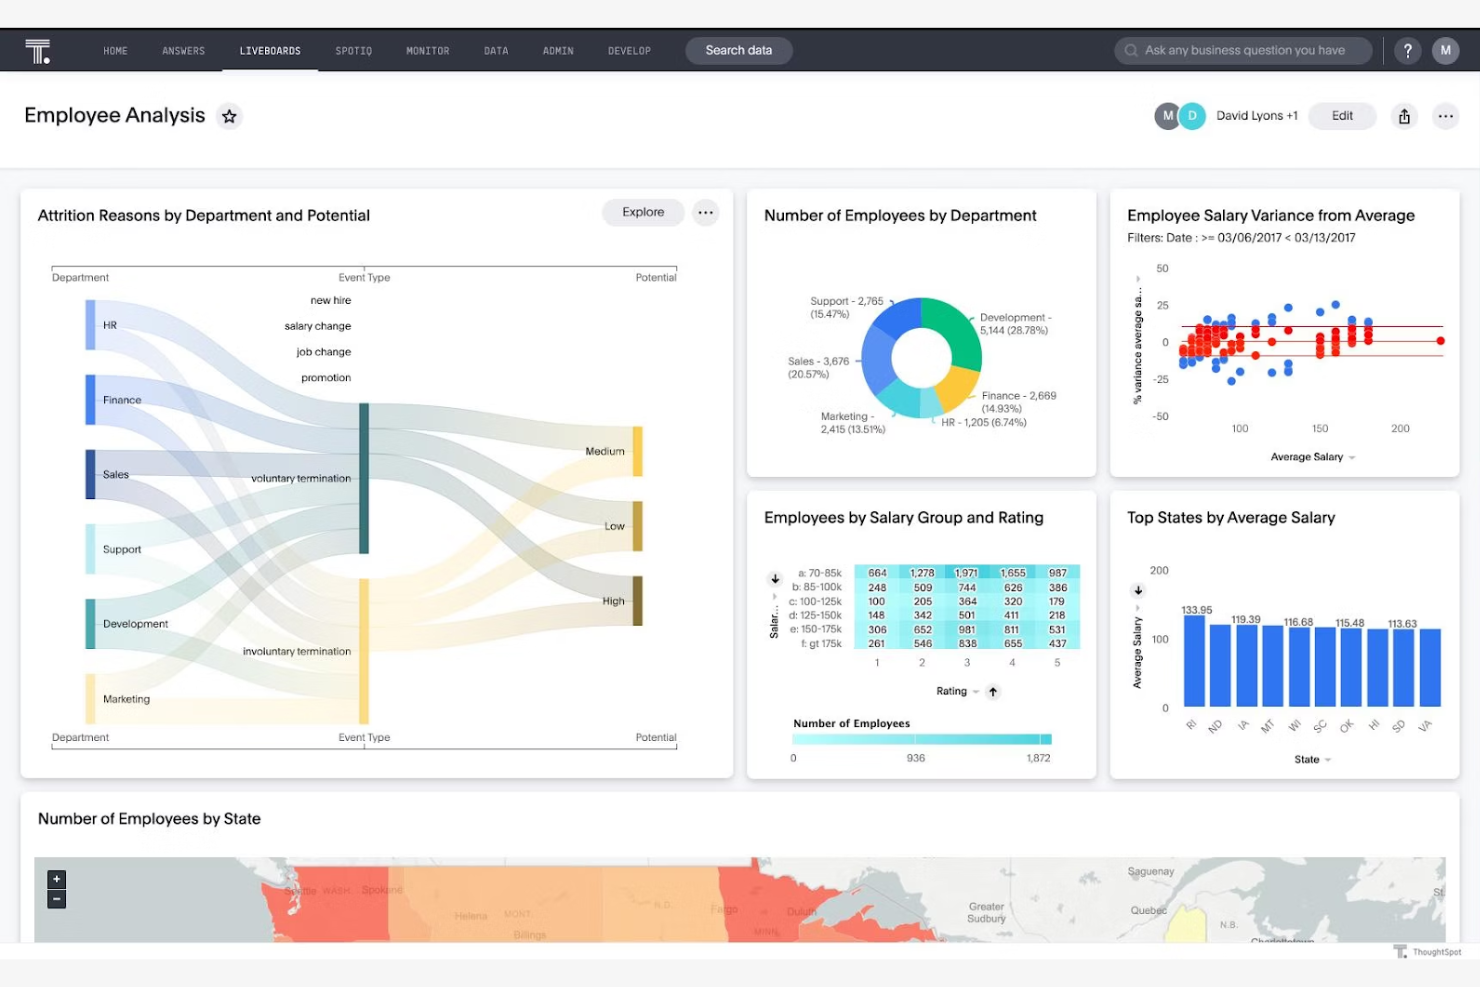
ThoughtSpot è una piattaforma di analisi che consente agli utenti aziendali di cercare e valutare i dati dell'azienda. È progettata per i team che necessitano di informazioni rapide e visualizzazione dei dati per supportare il processo decisionale.
Perché ThoughtSpot è una valida alternativa a Tableau: Le informazioni in tempo reale di ThoughtSpot mantengono il tuo team aggiornato, garantendo che le decisioni siano basate sui dati più recenti. Puoi creare cruscotti interattivi che si aggiornano istantaneamente quando arrivano nuovi dati.
Funzionalità e integrazioni principali:
Le funzionalità includono un motore di elaborazione del linguaggio naturale che ti consente di interagire con i tuoi dati utilizzando il linguaggio quotidiano. Puoi sfruttare le informazioni basate sull'intelligenza artificiale per individuare le tendenze senza una conoscenza tecnica approfondita. Il motore di calcolo in memoria garantisce un'elaborazione rapida dei dati per analisi tempestive.
Le integrazioni includono Google Sheets, GitHub, Salesforce e altro.
Pros and Cons
Pros:
- Connettività agli archivi di dati nel cloud tramite query in tempo reale
- Prestazioni del motore di calcolo in memoria
- Accessibilità per utenti non tecnici
Cons:
- Modellazione dei dati obbligatoria in anticipo
- Elevate esigenze di elaborazione dei dati

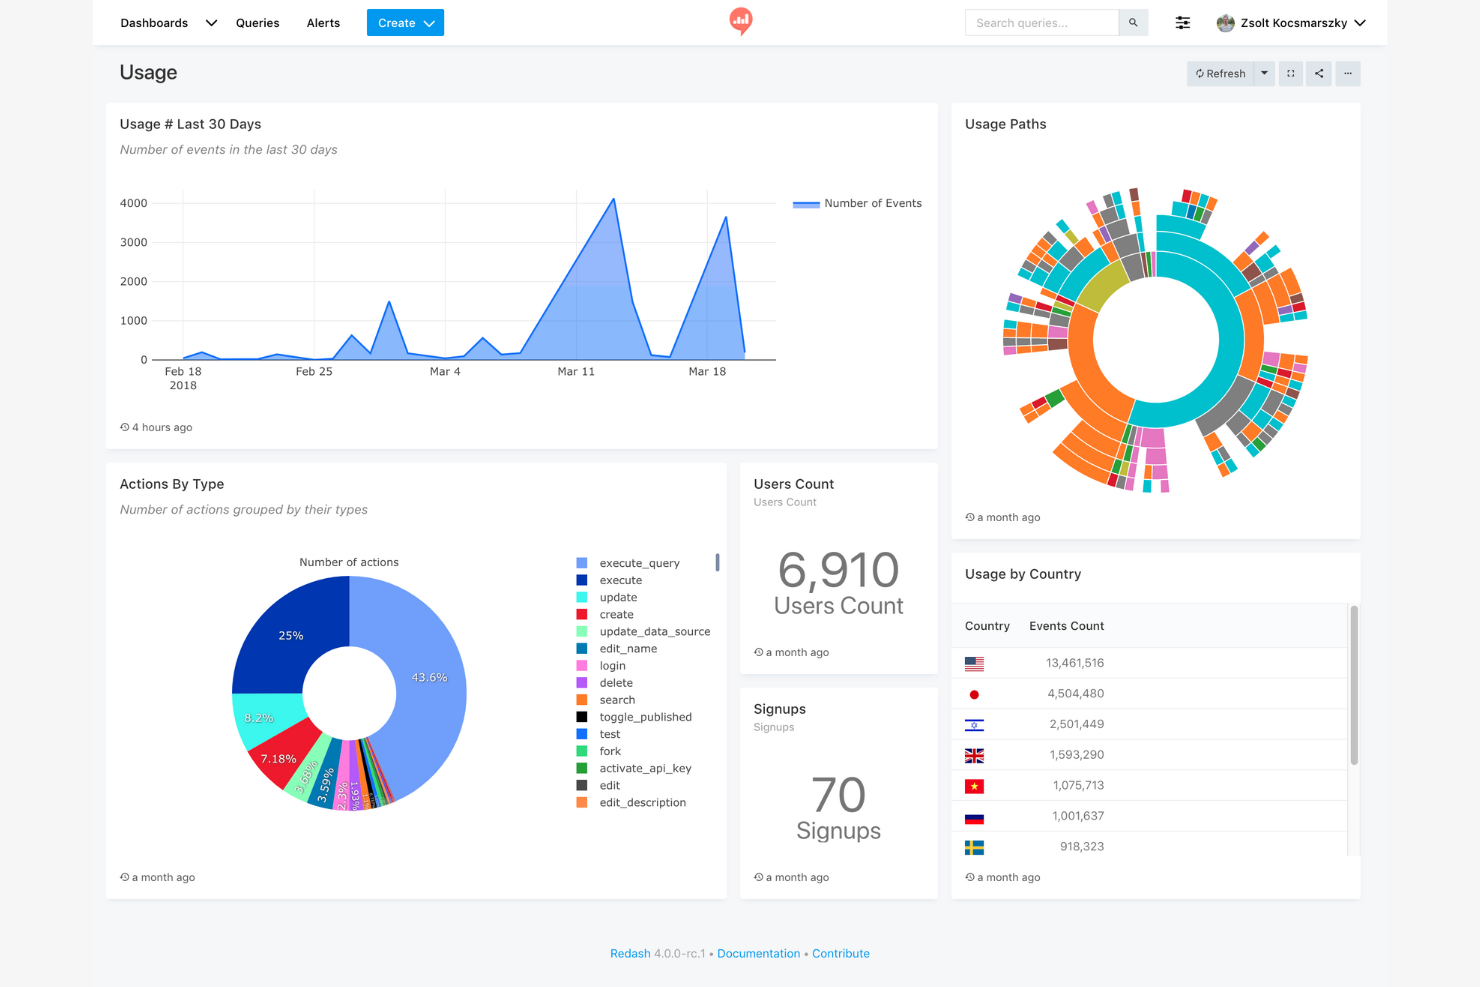
Redash è uno strumento open source per la visualizzazione dei dati e la creazione di dashboard, progettato per i team che devono interrogare i propri dati utilizzando SQL. È ideale per analisti dei dati e sviluppatori che desiderano creare dashboard interattive e condividere informazioni.
Perché Redash è una valida alternativa a Tableau: la sua semplicità e l'attenzione rivolta a SQL lo rendono accessibile agli utenti tecnici che desiderano un controllo diretto sui propri dati. La sua natura open source consente la personalizzazione e miglioramenti guidati dalla community.
Funzionalità e integrazioni principali:
Le funzionalità includono un editor di query che supporta più origini dati e consente di scrivere direttamente query SQL. Le funzioni collaborative della piattaforma favoriscono il lavoro di squadra ed è possibile pianificare gli aggiornamenti delle query per mantenere aggiornate le dashboard.
Integrazioni includono Google Analytics, Google Spreadsheets, JSON, Python, Salesforce, Yandex AppMetrica, Yandex Metrica e altro ancora.
Pros and Cons
Pros:
- Esplorazione diretta dello schema SQL
- Ambiente di scripting estensibile basato su Python
- Connessione diretta all'origine dati
Cons:
- Funzionalità di analisi avanzata limitate
- Opzioni di visualizzazione di base

Sigma
Ideale per un'interfaccia a foglio di calcolo
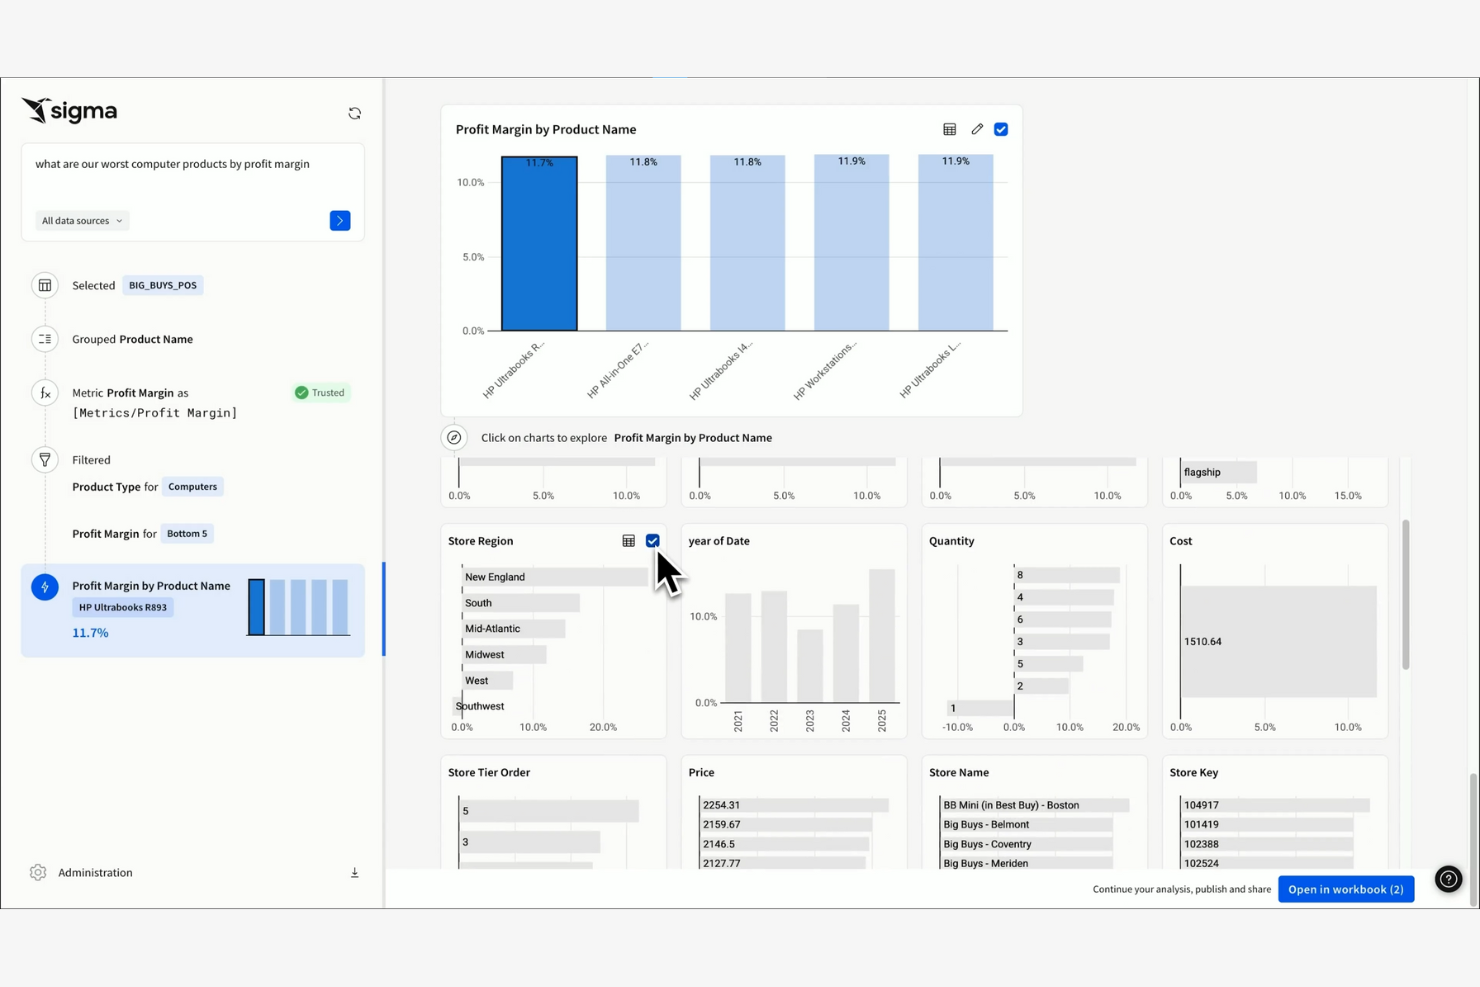
Sigma è uno strumento di business intelligence basato sul cloud, progettato per gli utenti aziendali che hanno familiarità con i fogli di calcolo. Consente di analizzare e visualizzare i dati attraverso un'interfaccia intuitiva simile a quella di un foglio di calcolo.
Perché Sigma è una buona alternativa a Tableau: Sigma offre un'interfaccia in stile foglio di calcolo, facilitando il passaggio del team dai fogli di calcolo tradizionali a una piattaforma di analisi più potente. La sua natura basata sul cloud garantisce la possibilità di accedere ai dati da qualsiasi luogo.
Funzionalità distintive e integrazioni:
Le funzionalità includono la funzione di trascinamento, che semplifica la manipolazione e la visualizzazione dei dati. È possibile utilizzare gli strumenti di esplorazione dei dati per analizzare in profondità grandi set di dati senza query complesse. La piattaforma offre inoltre funzionalità di collaborazione in tempo reale per promuovere il lavoro di squadra.
Le integrazioni includono Alation, AlloyDB, Atlan, Castor, Census, Databricks, Monte Carlo e altre.
Pros and Cons
Pros:
- Interfaccia simile a un foglio di calcolo
- Non è richiesto SQL
- Accesso basato sul cloud
Cons:
- Dipendenza da origini dati esclusivamente cloud
- Connessione diretta al data warehouse onerosa
Altre alternative a Tableau
Ecco alcune ulteriori alternative a Tableau che non sono entrate nella mia shortlist ma che meritano comunque di essere considerate:
- Strategy One
Ideale per dashboard di esecuzione della strategia
- Amazon Quick Sight
Ideale per informazioni basate sull'intelligenza artificiale
- BlazeSQL
Ideale per l'analisi basata su SQL


Come Valuto le Alternative a Tableau
Che tu stia monitorando l'adozione delle funzionalità dopo il lancio o creando dashboard di KPI per la dirigenza, valuto le alternative a Tableau su due livelli: il requisito di base che devono soddisfare e ciò che le distingue.
Funzionalità Principali (Requisiti Fondamentali per Questa Lista)
Quando seleziono gli strumenti per la mia lista, valuto ognuno su una scala da 0 (non offre la funzionalità) a 5 (eccelle in questa area) per ogni funzionalità principale elencata di seguito. Poi, calcolo il punteggio totale dello strumento in percentuale. Ogni strumento deve raggiungere un punteggio minimo totale del 75% per essere preso in considerazione per l'inclusione.
- Visualizzazione Interattiva dei Dati: Valuto l'ampiezza delle tipologie di grafici e dei controlli di formattazione, dai semplici grafici a barre alle mappe geospaziali e alla colorazione condizionale per l'analisi dei gruppi di utenti.
- Dashboard Interattive: I team di prodotto lavorano quotidianamente nelle dashboard, quindi cerco funzionalità come cross-filtering, percorsi di esplorazione dettagliata e parametri dinamici che permettono agli utenti di segmentare i dati in autonomia.
- Connessione a Molteplici Sorgenti Dati: Controllo la copertura delle librerie di connettori nativi per data warehouse cloud come Snowflake e BigQuery, oltre ad app SaaS come Salesforce e Mixpanel.
- Esplorazione Self-Service dei Dati: Un PM che monitora l'adozione delle funzionalità non dovrebbe aver bisogno di SQL. Cerco possibilità di query drag-and-drop, filtri ad hoc e ricerca in linguaggio naturale.
- Modellazione e Trasformazione dei Dati: È importante poter unire i dati di utilizzo del prodotto con quelli di fatturato o CRM all'interno della piattaforma. Valuto la logica di unione, i campi calcolati e i layer semantici.
- Condivisione, Collaborazione e Incorporamento: Considero come ogni strumento gestisce la condivisione basata sui ruoli, i report programmati per gli stakeholder, i commenti e la possibilità di incorporare dashboard nei portali interni.
Una volta che ho una lista di strumenti che soddisfano questi criteri, considero cosa distingue ciascuna piattaforma.
Fattori Differenzianti (Cosa Distingue i Fornitori)
Ecco come confronto e metto a confronto i diversi fornitori:
Funzionalità Distintive
Le funzionalità di insight basati sull'intelligenza artificiale sono importanti quando i PM devono individuare cali di adozione tra migliaia di sessioni utente, senza coinvolgere un data scientist. La ricerca in linguaggio naturale è un ottimo complemento. Cerco strumenti in cui un PM possa scrivere "utenti attivi settimanali per fascia di abbonamento" e ottenere una visualizzazione. Le integrazioni di analytics di prodotto sono un altro aspetto che valuto attentamente. I connettori nativi verso strumenti come Amplitude o Mixpanel permettono ai team di combinare i dati di utilizzo con i dati di business senza dover costruire pipeline personalizzate. L'elaborazione dei dati in tempo reale completa il quadro per monitorare in diretta il lancio delle funzionalità.
Oltre le Funzionalità
La struttura dei prezzi è un fattore importante. Valuto se uno strumento offre licenze solo per la visualizzazione o piani gratuiti, poiché i PM spesso condividono le dashboard con decine di stakeholder che non dovrebbero aver bisogno di una licenza a pagamento ciascuno. Anche l'integrazione con lo stack di prodotto è rilevante. Controllo la presenza di connessioni native con strumenti come Jira, Slack e Salesforce, così che gli insight raggiungano i flussi di lavoro dove vengono prese le decisioni. Un altro elemento che considero è il time-to-value: una piattaforma con template pre-costruiti e onboarding guidato consente a un PM di realizzare dashboard in pochi giorni, evitando settimane di configurazione.
Perché cercare un’alternativa a Tableau?
Sebbene Tableau sia una buona scelta come software di business intelligence e visualizzazione dati, ci sono diverse ragioni per cui alcuni utenti cercano soluzioni alternative. Potresti essere alla ricerca di un’alternativa a Tableau perché…
- Hai bisogno di opzioni di prezzo più convenienti
- Il tuo team necessita di migliori capacità di integrazione
- Vuoi un’interfaccia utente più semplice per i non tecnici
- La tua azienda richiede una migliore accessibilità da dispositivi mobili
- Hai bisogno di funzionalità pensate per settori specifici
- Ritieni che Tableau abbia dei limiti nella scalabilità
Se ti rivedi in una di queste situazioni, sei nel posto giusto. La mia lista include diverse soluzioni di business intelligence e visualizzazione dei dati più adatte ai team che vivono queste difficoltà con Tableau e cercano un’alternativa. Tuttavia, in base alle conoscenze generali, ecco alcune funzionalità comunemente riconosciute di Tableau:
Caratteristiche principali di Tableau
Ecco alcune delle caratteristiche chiave di Tableau, per aiutarti a confrontare e comparare ciò che offrono le soluzioni alternative:
- Visualizzazione dei dati: Crea una vasta gamma di dashboard interattive e condivisibili.
- Analisi in tempo reale: Analizza i dati appena vengono acquisiti, mantenendo sempre aggiornate le tue intuizioni.
- Unione dei dati: Combina dati provenienti da fonti diverse in una vista unificata.
- Interfaccia drag-and-drop: Crea report senza bisogno di competenze tecniche.
- Analisi geospaziale: Visualizza dati geografici utilizzando le funzionalità di mappatura.
- Condivisione e collaborazione: Condividi dashboard e collabora sulle analisi all'interno del tuo team.
- Supporto mobile: Accedi a dashboard e report da dispositivi mobili.
- Dashboard personalizzabili: Adatta le dashboard alle esigenze specifiche della tua azienda.
- Calcoli avanzati: Utilizza strumenti per effettuare analisi complesse e calcoli sui dati.
- Connettori di dati: Integra con diverse fonti di dati per agevolare l'accesso alle informazioni.
E ora?
Se sei nella fase di ricerca di software di business intelligence e visualizzazione dei dati, contatta un consulente SoftwareSelect per raccomandazioni gratuite.
Ti basta compilare un modulo e fare una breve chiacchierata durante la quale verranno approfondite le tue esigenze specifiche. Riceverai poi una lista ristretta di software da valutare. I consulenti ti supporteranno anche durante l’intero processo d’acquisto, incluse le negoziazioni sui prezzi.