

Bir ürün yöneticisi olarak kullanıcı davranışını anlama ve ürününüzü geliştirmek için verilere dayalı kararlar alma zorluğuyla karşı karşıyasınız.
Deneyimlerime göre UX analitiği araçları, kullanıcı etkileşimi ile eyleme dönüştürülebilir içgörüler arasındaki boşluğu kapatmaya yardımcı olur. Bilinçli kararlar almanız ve kullanıcı memnuniyetini artırmanız için gereken verileri sağlarlar.
Bu liste yazısında UX analitiği araçları için en iyi seçimlerimi paylaşacağım. Her birini tarafsız bir şekilde inceleyerek ekibinizin özel ihtiyaçlarını nasıl karşılayabileceklerine odaklanacağım. Ayrıntılara birlikte göz atalım ve ürününüzün kullanıcı deneyimini geliştirmek için en iyi çözümleri keşfedelim.
Why Trust Our Software Recommendations
6,700+
Reviews
20
Industry experts
16+
Evaluation factors
14
Years
Our team has been testing and reviewing software since 2012. As product managers ourselves, we know how difficult—and important—it is to choose the right software.
For this guide, we evaluated tools using hands-on testing and independent research, scoring tools using our selection criteria.
Our reviews reflect our human editorial judgment, not a sales pitch.
Expert reviewers:
- Andrew LumbySenior TPM
- Cristiano ValimSenior UI/UX Lead


Karşılaştırma Tablosu: UX Analitiği Araçları
Bu karşılaştırma tablosu, UX analitiği araçları için en iyi seçimlerimin fiyatlandırma ayrıntılarını özetlemektedir.
Score legend (out of 5)
- Excellent4.5–5
- Good4–4.4
- Average3–3.9
- Below average2–2.9
- Poor1–1.9
Sorted by: Default
| Tool | Starting Price | Website | |||||||
|---|---|---|---|---|---|---|---|---|---|
Best for closing analytics and in-app fixes in one loop | 4.2 out of 5 | 5 | 5 | 5 | 1 | 5 | 4 | $299/month 14-day free trial | Website |
Best for user behavior tracking | 4.5 out of 5 | 5 | 5 | 5 | 4 | 3 | 5 | $120/month Free plan available | Website |
Best for AI-driven behavioral analysis | 4.7 out of 5 | 5 | 5 | 5 | 4 | 4 | 5 | Pricing upon request Free plan + free demo available | Website |
Best for mobile app analytics | 4.7 out of 5 | 5 | 4 | 5 | 5 | 5 | 4 | Pricing upon request Free demo + 14-day free trial available | Website |
Best for enterprise friction scoring and VoC | 4.7 out of 5 | 5 | 5 | 5 | 4 | 5 | 4 | Pricing upon request Free demo available | Website |
Best for continuous product discovery at scale | 4.8 out of 5 | 5 | 5 | 5 | 5 | 5 | 4 | Pricing upon request Free demo available | Website |
Best for session replay | 4.7 out of 5 | 5 | 5 | 5 | 4 | 5 | 4 | Pricing upon request Free plan available | Website |
Best for automatic event tracking | 4.8 out of 5 | 5 | 5 | 5 | 4 | 5 | 5 | Pricing upon request Free plan available | Website |
Best for digital experience analytics | 5.0 out of 5 | 5 | 5 | 5 | 5 | 5 | 5 | $39/month Free plan + free demo + 15-day free trial available | Website |
Best for cross-functional UX and engineering triage | 4.8 out of 5 | 5 | 5 | 5 | 5 | 5 | 4 | $176/month 14-day free trial + free plan available | Website |


En İyi UX Analitiği Araçlarının İncelemeleri
Aşağıda, kısa listeme giren en iyi UX analitiği araçlarının ayrıntılı özetlerini bulabilirsiniz. İncelemelerimde, size en uygun aracı bulmanıza yardımcı olmak için her aracın temel özelliklerine, avantajlarına ve dezavantajlarına, entegrasyonlarına ve ideal kullanım alanlarına ayrıntılı bir şekilde yer veriyorum.
 Best for closing analytics and in-app fixes in one loop
- 14-day free trial
- From $299/month
Visit WebsiteCustomer Rating:4.7/5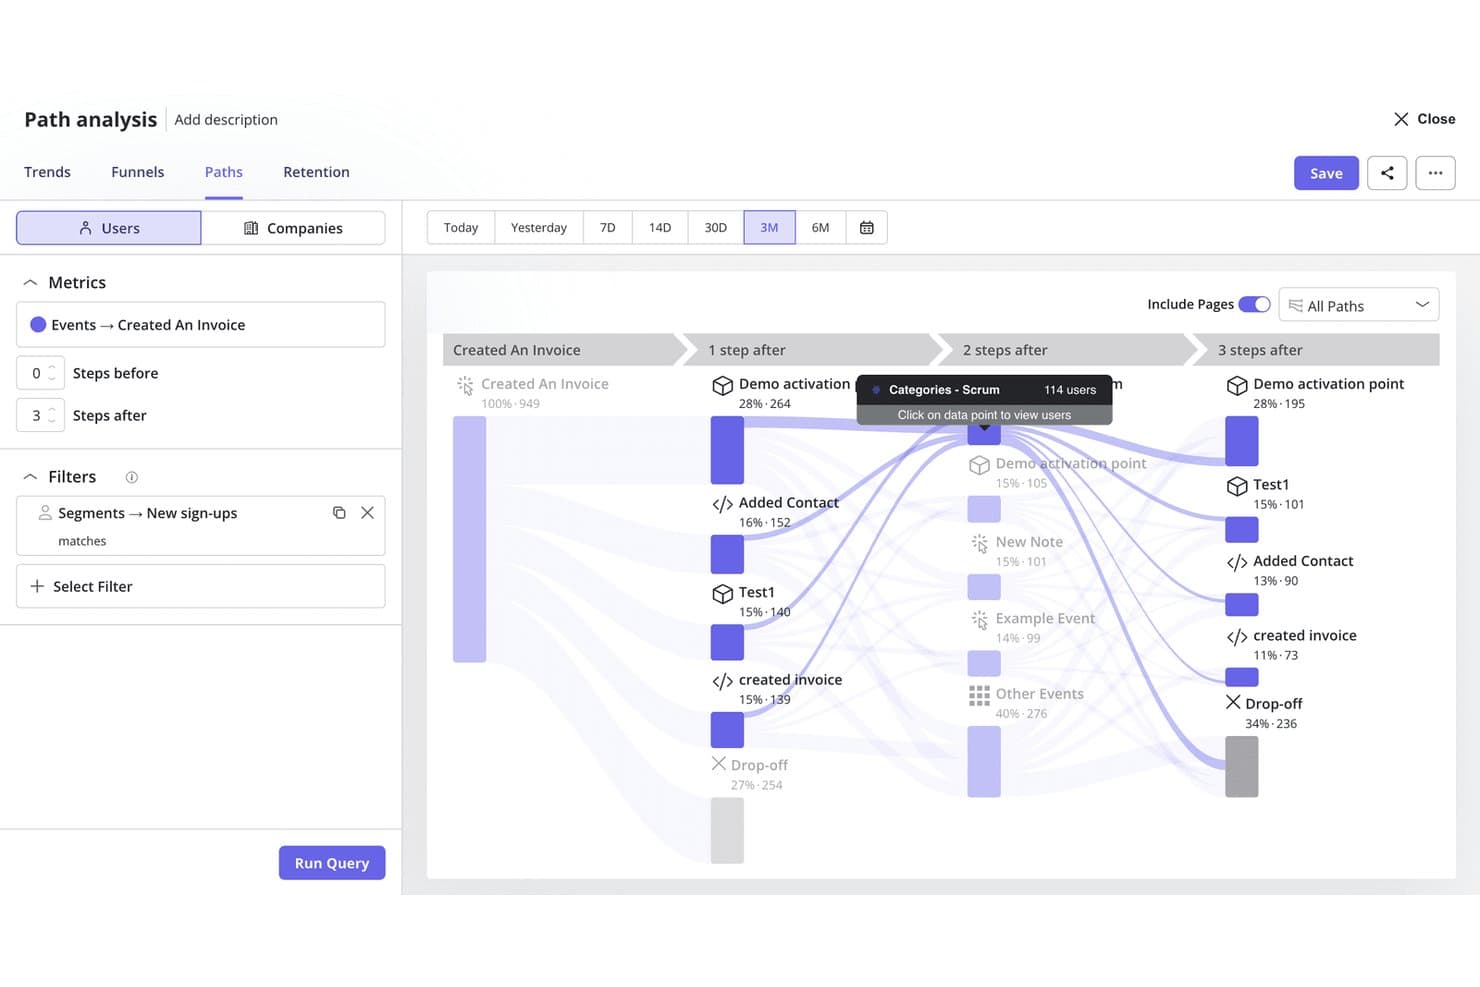
Userpilot's path analysis maps user journeys after key product events. Userpilot is a product analytics and in-app engagement platform that combines session replay, funnel and path analysis, event tracking, frustration signal detection, and native survey tools with built-in in-app flow and guidance building.
Who Is Userpilot Best For?
Userpilot is a strong fit for product teams that want to move from spotting friction to fixing it without bouncing between tools.
Why I Picked Userpilot
Userpilot earns its spot on my shortlist because it's the only tool I've used where spotting a drop-off and deploying a fix happen inside the same platform. I can click from a funnel report directly into the session replays behind that exact drop-off, then launch an in-app flow or tooltip to address the friction without touching another tool. The AI-powered correlation analysis also automatically flags which frustration signals, like rage clicks or u-turns, are driving that drop-off.
Userpilot Key Features
- Retroactive event autocapture: Define new events against historical interaction data already captured, so you can run analysis without re-instrumenting your product.
- AI-powered correlation analysis: Automatically surfaces which user attributes, events, and frustration signals correlate with funnel conversion or drop-off across your reports.
- Native NPS, CSAT, and CES surveys: Trigger behavioral surveys based on specific in-app events, then tie responses directly to retention and engagement data in the same platform.
- MCP Server: Connects your Userpilot product data to external AI tools like Claude, ChatGPT, and Microsoft Copilot so you can query behavioral insights without leaving those environments.
Userpilot Integrations
Userpilot offers native integrations with Segment, Amplitude, Mixpanel, Heap, Google Analytics, Google Tag Manager, Intercom, Slack, HubSpot, and Salesforce. It also supports APIs, webhooks, and Enterprise Data Warehouse Sync.
Pros and Cons
Pros:
- Launch in-app fixes from analytics reports
- Detects frustration signals like rage, dead clicks
- Funnels connect directly to session replays
Cons:
- Most advanced analytics features gated by plan
- No heatmaps for aggregate click visualization
Learn more about Userpilot: Best for user behavior tracking
- Free plan available
- From $120/month (billed annually)
Visit WebsiteCustomer Rating:4.5/5
Mixpanel visualizes conversion rates across browsers with detailed funnel analysis. Mixpanel is an analytics tool tailored for businesses aiming to track user behavior and interactions with their products. Its main users include product managers and data analysts who need to understand user journeys and engagement.
Why I picked Mixpanel: It specializes in user behavior tracking, allowing you to analyze how users interact with your product in real-time. You can create detailed funnels to track conversion paths and identify drop-off points. Mixpanel also offers cohort analysis, helping you segment users based on their actions over time. This combination of features makes it ideal for understanding user engagement deeply.
Standout features & integrations:
Features include A/B testing to optimize user experiences, push notifications that engage users directly, and retention reports that help you understand user loyalty. These features are designed to give you actionable insights into user behavior.
Integrations include Segment, Zapier, Salesforce, HubSpot, Google Ads, Marketo, Amplitude, Optimizely, Slack, and Intercom.
Pros and Cons
Pros:
- Supports A/B testing
- Customizable dashboards
- Detailed cohort analysis
Cons:
- Advanced features require coding skills
- Slight learning curve
 Best for AI-driven behavioral analysis
- Free plan + free demo available
- Pricing upon request
Visit WebsiteCustomer Rating:4.5/5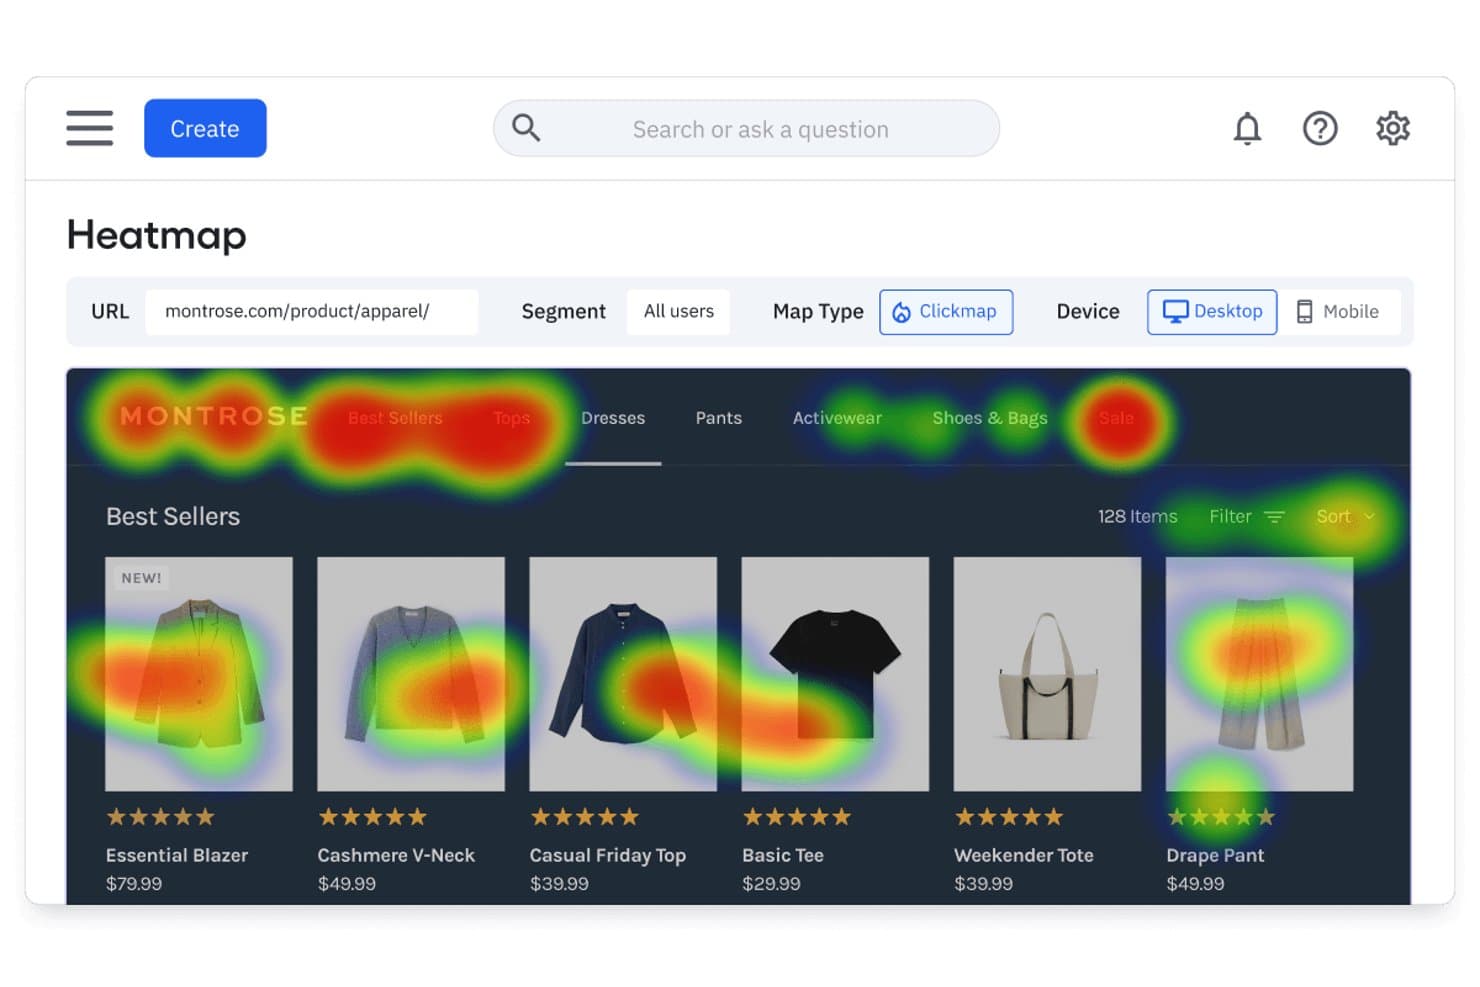
Amplitude's heatmap reveals where users click on product pages. Amplitude is a product analytics platform that combines session replay, heatmaps, funnel analysis, behavioral cohorts, and built-in experimentation with AI-powered agents that surface insights across all of your data.
Who Is Amplitude Best For?
Amplitude is a strong fit for product and growth teams that need behavioral analytics, experimentation, and session replay in a single platform rather than stitched-together point solutions.
Why I Picked Amplitude
Amplitude earns its spot on my shortlist because its AI-driven behavioral analysis goes beyond passive dashboards in ways I haven't seen matched. The Session Replay Agent automatically summarizes sessions and surfaces friction points without manual review, while the Global Agent answers natural language questions like "why are new users dropping before setup?" by synthesizing data across your entire product. I also love that retroactive funnel analysis lets you apply newly defined events to historical data instantly, no re-instrumentation required.
Amplitude Key Features
- Behavioral cohorts: Save groups of users defined by specific in-product actions and reuse them across charts, session replays, experiments, and surveys.
- Web and mobile experimentation: Run A/B tests and feature flag experiments natively, with session replays attached directly to variant results for qualitative validation.
- Guides and surveys: Deploy in-app onboarding guides, NPS prompts, and feedback widgets with session replay linked to moments of feedback collection.
- Visual labeling: Tag UI elements and define named events directly from the Amplitude interface without writing any code.
Amplitude Integrations
Amplitude offers 60+ native integrations, including Twilio Segment, Snowflake, Google BigQuery, Salesforce, HubSpot, Zendesk, Intercom, Braze, and Google Analytics 4. It also provides HTTP, Batch, export, and DSAR APIs for custom data workflows.
Pros and Cons
Pros:
- Retroactive funnel analysis on historical product data
- Behavioral cohorts reusable across analytics and experiments
- AI-powered session replay summarizes friction automatically
Cons:
- No native mobile app heatmaps yet available
- Heatmaps require top-tier plan with add-on
Learn more about Amplitude: Best for mobile app analytics
- Free demo + 14-day free trial available
- Pricing upon request
Visit WebsiteCustomer Rating:4.6/5
UXCam visualizes user journeys with funnel analysis to optimize app onboarding. UXCam is a mobile app analytics tool designed to help businesses understand user behavior on their mobile applications. Its main users are app developers and product managers who need insights into app performance and user interactions.
Why I picked UXCam: It excels in mobile app analytics, offering features like session replay to visualize user actions. You can analyze heatmaps to see where users tap and scroll within your app. UXCam also provides crash analytics, helping you identify and resolve issues quickly. These capabilities make it a comprehensive choice for improving your app's user experience.
Standout features & integrations:
Features include funnel analytics that track user journeys through your app, gesture detection that identifies user actions like swipes and pinches, and screen flow analysis that maps out how users navigate through your app. These features provide deep insights into user behavior.
Integrations include Google Analytics, Segment, Mixpanel, Amplitude, Firebase, Adjust, AppsFlyer, Kochava, Airship, and Braze.
Pros and Cons
Pros:
- Offers screen flow mapping and gesture detection
- Provides funnel analytics
- Detailed session replays
Cons:
- Requires technical setup
- High pricing for small teams
Learn more about UXCam: Best for enterprise friction scoring and VoC
- Free demo available
- Pricing upon request
Visit WebsiteCustomer Rating:4.7/5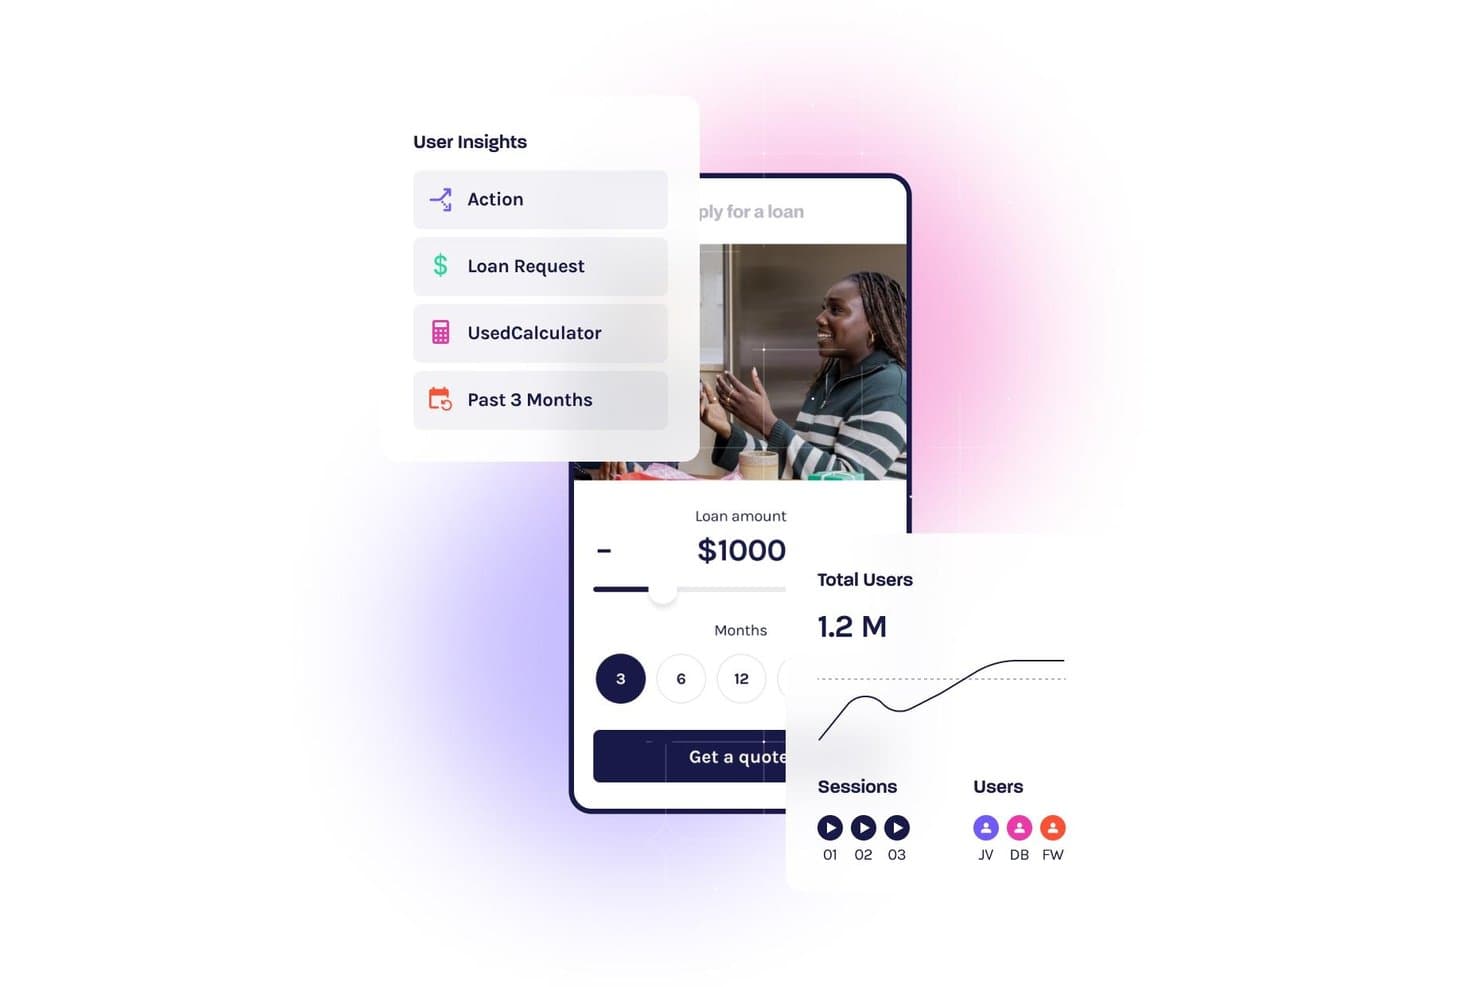
Glassbox tracks user behavior with session replays and analytics dashboards. Glassbox is an enterprise UX analytics platform that combines session replay, tagless autocapture, interaction maps, funnel analysis, friction scoring, and native VoC tools across web and mobile.
Who Is Glassbox Best For?
Glassbox is a strong fit for enterprise product and CX teams in regulated industries—like financial services, healthcare, and retail—who need deep behavioral data without the overhead of manual instrumentation.
Why I Picked Glassbox
Glassbox earns its spot on my shortlist because of its proprietary Struggle Score, which quantifies friction across 30+ behavioral signals—rage clicks, u-turns, error clicks—and ties each directly to revenue impact. I love that this isn't just flagging annoyances; it lets product and CX teams rank UX problems by business cost and act on the highest-priority issues first. The Voice of the Silent feature extends that picture further by using AI to apply VoC sentiment from survey respondents to the 95%+ of users who never fill one out.
Glassbox Key Features
- Tagless autocapture: Glassbox automatically records every click, scroll, form input, and server-side event without any manual tagging or engineering instrumentation.
- Augmented Journey Map: A single cross-channel visualization maps the full customer journey from acquisition to conversion across web and mobile in one view.
- GIA (Glassbox Insights Assistant): A generative AI assistant lets you query session data, generate session summaries, and surface behavioral insights using natural language.
- Mobile app analytics: Dedicated SDKs for iOS, Android, React Native, Flutter, and five other frameworks deliver session replay, interaction maps, and crash analytics for native mobile apps.
Glassbox Integrations
Glassbox offers native integrations with Adobe Analytics, Google Analytics 4, Qualtrics, Medallia, Optimizely, VWO, Jira, and Slack. An open API supports custom integrations.
Pros and Cons
Pros:
- AI surfaces hidden session insights instantly
- Tagless autocapture eliminates manual event tagging
- Quantifies friction using proprietary Struggle Score
Cons:
- Can overwhelm teams with session data volume
- Requires sales demo to access platform
Learn more about Glassbox: Best for continuous product discovery at scale
- Free demo available
- Pricing upon request
Visit WebsiteCustomer Rating:4.7/5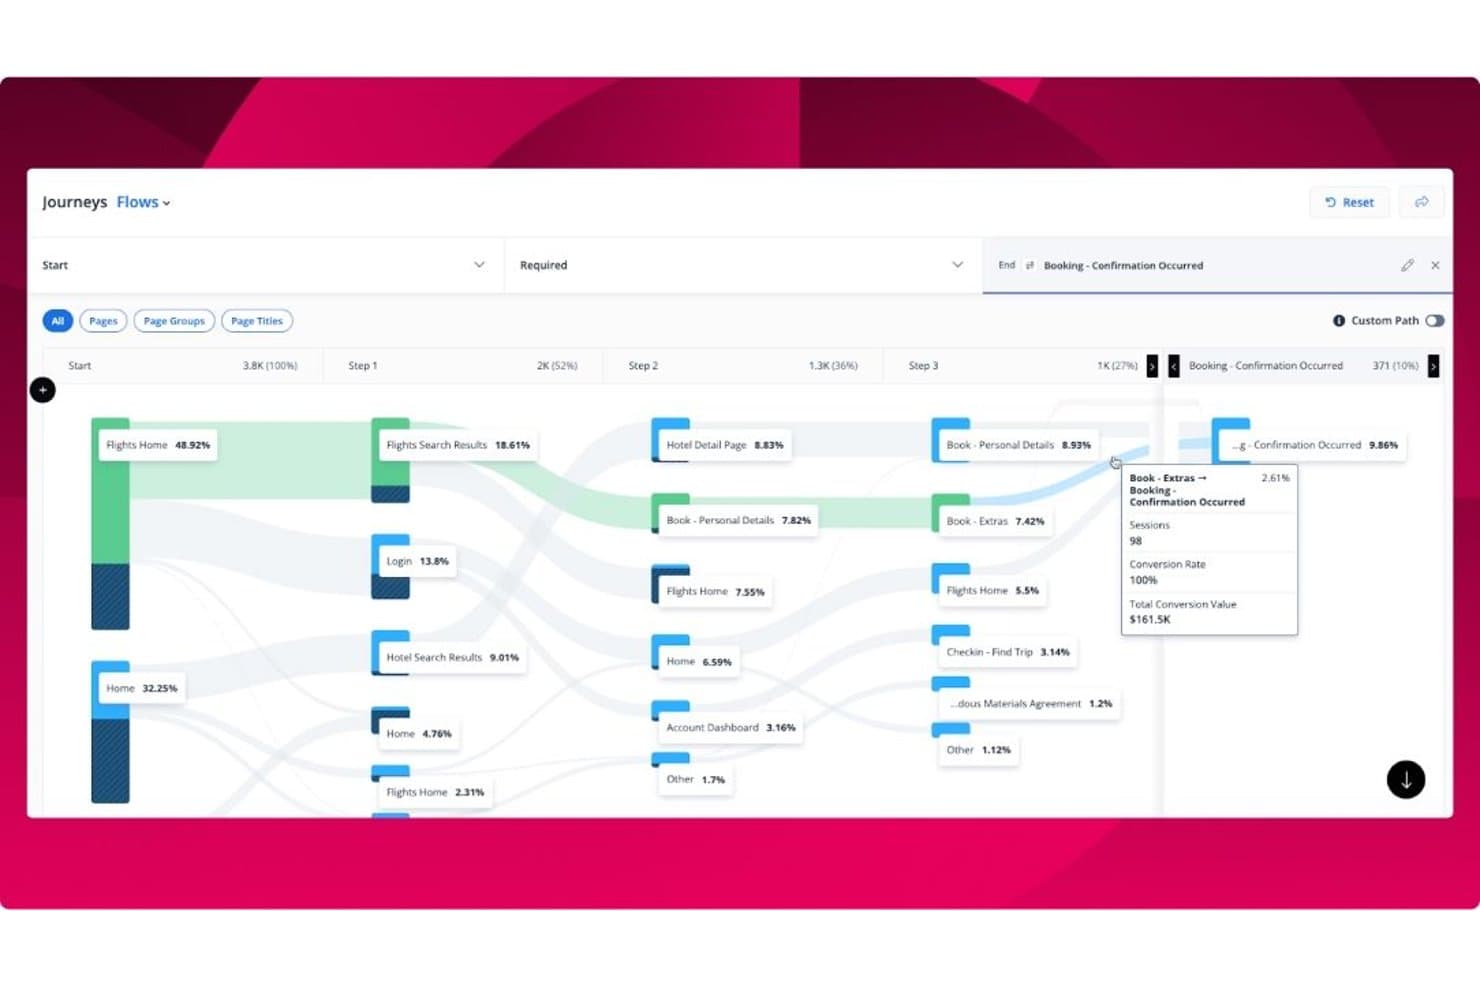
Quantum Metric visualizes user journey flows with conversion rates and session data. Quantum Metric is an enterprise UX analytics platform that combines 100% unsampled session replay, interaction heatmaps, funnel and journey analysis, AI-powered insight surfacing via Felix AI Agentic, and voice of customer integration across web and native mobile apps.
Who Is Quantum Metric Best For?
Quantum Metric is a strong fit for enterprise product and digital teams that need to connect behavioral data to business impact across web and native mobile at high traffic volumes.
Why I Picked Quantum Metric
Quantum Metric earns its spot on my shortlist because no other platform I've evaluated makes continuous product discovery feel as automatic at enterprise scale. Felix AI Agentic runs autonomously in the background, monitoring your KPIs and surfacing revenue-impacting friction before you think to look for it. Pair that with Opportunity Analysis, which quantifies the business impact of specific drop-offs across web and native mobile journeys, and your team spends less time hunting for problems and more time fixing the right ones.
Quantum Metric Key Features
- Felix AI Chat: A natural language interface that lets you ask plain-English questions about your behavioral data and get direct answers without writing queries.
- Server-side data capture: Sends critical events like transactions and sign-ups directly from your servers, appending them to live session replays even when client-side capture fails.
- AutoPII scanning: Continuously scans for unintended personally identifiable information capture and enforces privacy masking by default across all session data.
- Data streaming: Exports your behavioral data to destinations like Snowflake, Azure, and Databricks for integration with your existing BI and data infrastructure.
Quantum Metric Integrations
Quantum Metric integrates with Qualtrics, Optimizely, Split, UserTesting, Snowflake, Azure, Databricks, Looker, Tealium, and Slack, with data streaming to 20+ destinations. APIs, webhooks, and tag manager integrations support custom connectivity.
Pros and Cons
Pros:
- Enables funnel creation directly from session replays
- Offers 100% unsampled session replay data
- Detects revenue-impacting friction with Felix AI
Cons:
- Data sometimes mismatches other analytics tools
- Advanced segmentation can be confusing for teams
Learn more about Quantum Metric:

Fullstory provides clear funnel analysis and conversion insights to optimize user journeys. Fullstory is a digital experience analytics platform that helps businesses understand user interactions through session replay. Its main users are UX designers and product teams who need detailed insights into user behavior on websites and apps.
Why I picked Fullstory: It excels in session replay, allowing you to view complete user sessions to identify pain points. You can use heatmaps to visualize user engagement across your site. Fullstory also offers event funnels that help track user paths and analyze conversions. These tools provide a comprehensive view of user experiences, making it easier to optimize your digital presence.
Standout features & integrations:
Features include conversion analysis that tracks the success of user journeys, error detection that alerts you to issues impacting user experience, and custom event tracking that allows you to monitor specific user actions. These features work together to enhance your understanding of user interactions.
Integrations include Slack, Segment, Google Analytics, Optimizely, Mixpanel, HubSpot, Salesforce, Jira, Trello, and Zendesk.
Pros and Cons
Pros:
- Custom event tracking
- Effective error detection
- High-quality session replays
Cons:
- Advanced features need training
- High resource usage
Learn more about Fullstory: Best for automatic event tracking
- Free plan available
- Pricing upon request
Visit WebsiteCustomer Rating:4.3/5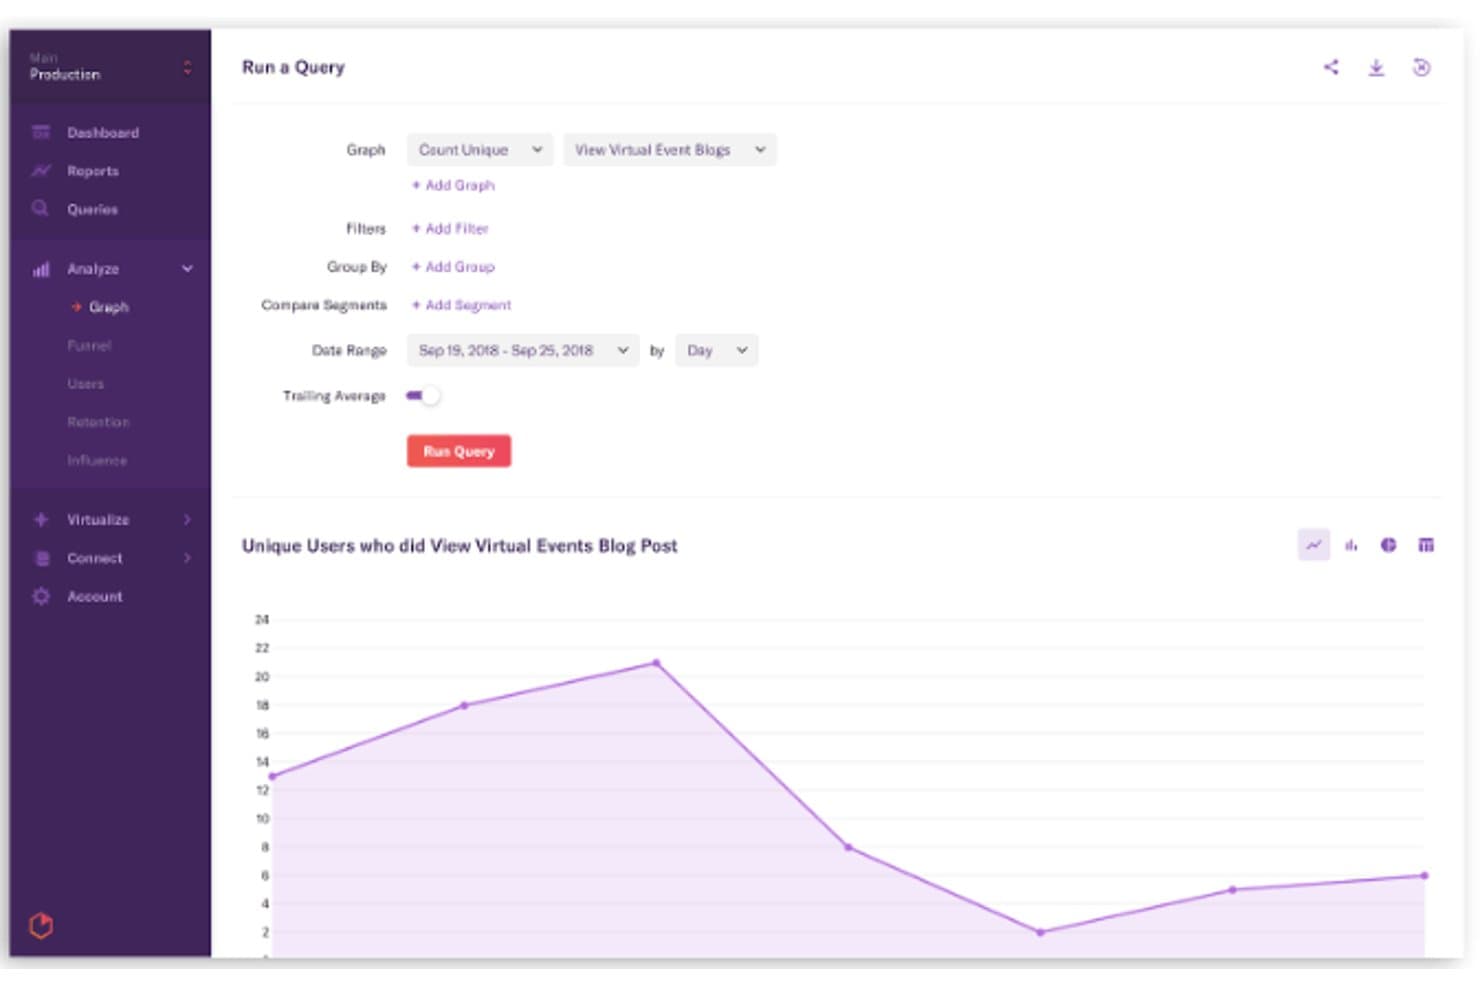
Heap lets users query and visualize user behavior trends over time. Heap is a UX analytics platform that automatically captures every user interaction—clicks, taps, pageviews, and form fills—across web and mobile, and pairs that behavioral data with funnel analysis, journey mapping, session replay, and AI-powered insight surfacing.
Who Is Heap Best For?
Heap works best for product teams that need immediate behavioral insights without waiting on engineering to instrument every event.
Why I Picked Heap
Heap earns its spot on my shortlist because its autocapture approach genuinely changes what's possible in product analytics. From the moment you drop in a single code snippet, Heap records every click, tap, pageview, and form fill automatically, with no manual event tagging required. What I find most valuable is that you can define new events and build funnels retroactively against historical data, so a question you didn't think to ask six months ago can still be answered today.
Heap Key Features
- Sense Chat: A generative AI assistant that lets any team member ask plain-language questions about user behavior and automatically generates charts from the response.
- Heap Illuminate: A data science layer that proactively surfaces top events, high-impact user segments, and friction patterns without any manual configuration.
- Session Replay Summaries: AI-generated summaries of individual session recordings that highlight key moments, reducing the need to watch full replays.
- Heap Connect: A managed ETL solution that syncs behavioral data to Snowflake or BigQuery for enrichment and analysis alongside external data sources.
Heap Integrations
Heap offers 100+ integrations, including Snowflake, BigQuery, Salesforce, HubSpot, Intercom, Segment, RudderStack, Shopify, and WalkMe. Client-side and server-side APIs support custom integrations and data enrichment.
Pros and Cons
Pros:
- Automatic capture of all user interactions
- AI-powered insight surfacing and chat assistant
- Retroactive event definition on historical data
Cons:
- No built-in A/B testing or surveys
- Session replay requires a paid add-on
Learn more about Heap (by Contentsquare): Best for digital experience analytics
- Free plan + free demo + 15-day free trial available
- From $39/month (billed annually)

Contentsquare captures user interactions with detailed session replays and behavior analytics. Contentsquare is a digital experience analytics platform designed to help businesses understand and improve user interactions on their websites and apps. Its primary users are digital marketers and UX designers who need insights into user behavior and engagement.
Why I picked Contentsquare: It specializes in digital experience analytics, offering features like zone-based heatmaps that provide detailed insights into user engagement on different page elements. You can use journey analysis to track user paths and identify drop-off points. Contentsquare also provides session replay, allowing you to visualize user interactions in real-time. These tools help you make data-driven improvements to your digital experiences.
Standout features & integrations:
Features include impact quantification that measures the effect of changes on user behavior, behavioral alerts that notify you of significant user activity changes, and AI-based insights that highlight key user trends. These features work together to enhance your understanding of user interactions.
Integrations include Google Analytics, Adobe Analytics, Salesforce, Tealium, Segment, Optimizely, HubSpot, Shopify, Adobe Commerce, and WordPress.
Pros and Cons
Pros:
- Real-time session replay
- Effective journey analysis
- Detailed zone-based heatmaps
Cons:
- Advanced features need training
- Slight learning curve
Learn more about Contentsquare: Best for cross-functional UX and engineering triage
- 14-day free trial + free plan available
- From $176/month (billed annually)
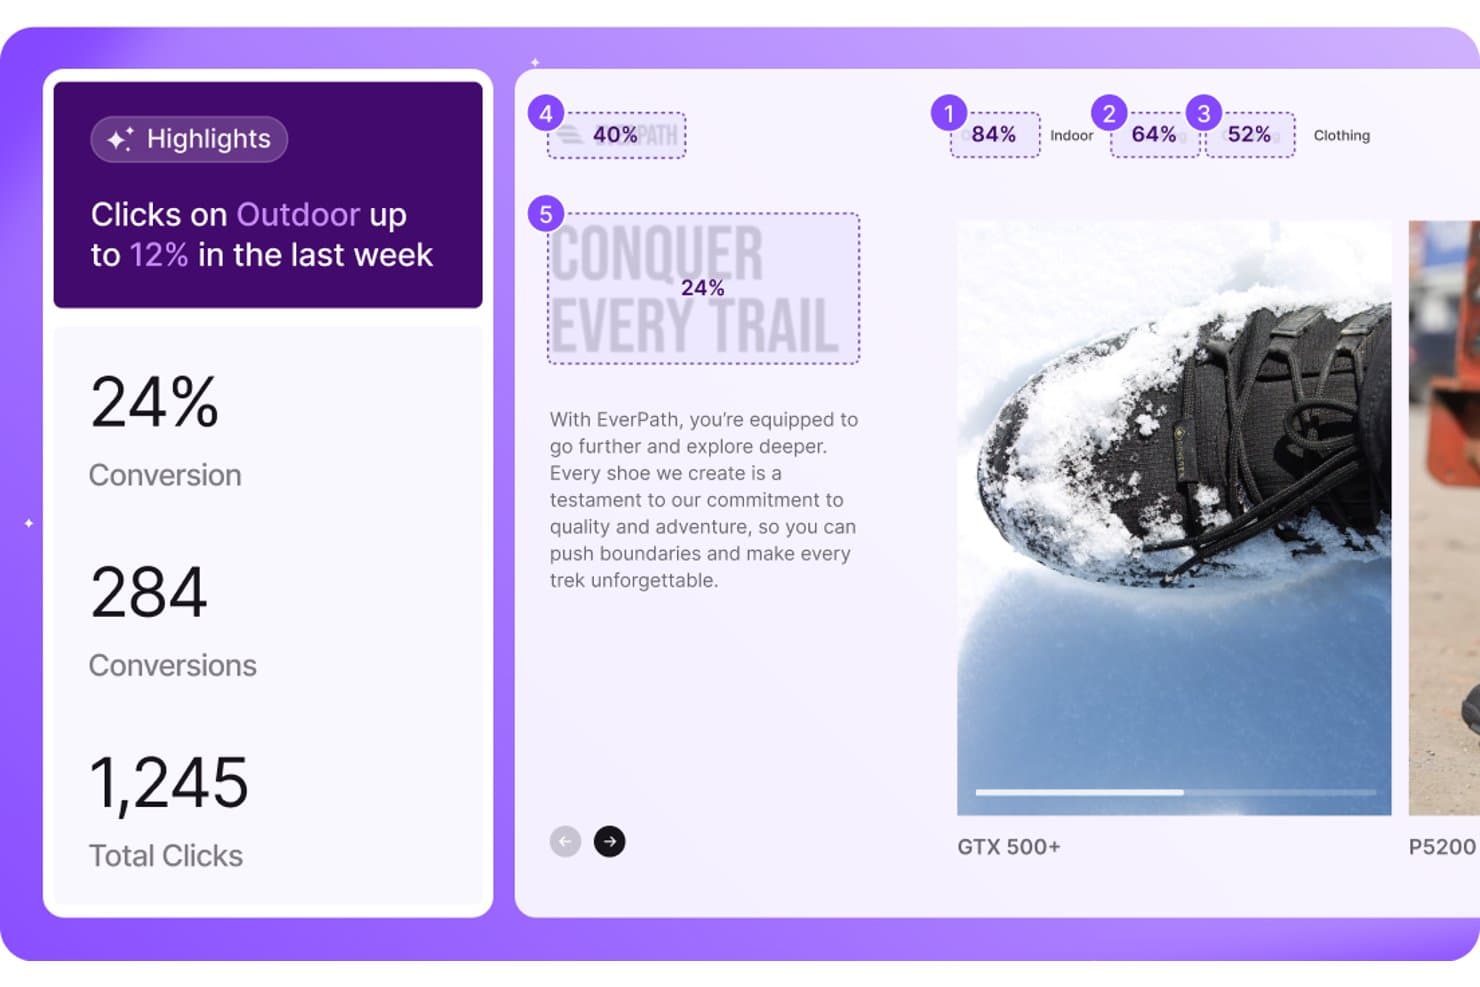
LogRocket surfaces click trends and conversion metrics by content segment. LogRocket is a UX analytics platform that combines session replay, heatmaps, conversion funnels, path analysis, and AI-powered issue detection across web and native mobile apps.
Who Is LogRocket Best For?
LogRocket is a strong fit for product and engineering teams that need a shared tool to diagnose UX problems and reproduce bugs without endless back-and-forth.
Why I Picked LogRocket
LogRocket earns its spot on my shortlist because it's the rare UX analytics tool that product and engineering teams actually share. What makes it click for cross-functional triage is Galileo AI, which auto-detects rage clicks, dead clicks, and error states, scores them by business impact, and pushes reproduction steps directly to Slack or your AI coding environment. Pair that with retroactive Definitions, where you label a UI element today and instantly query all historical sessions for it, and the back-and-forth between product and engineering shrinks fast.
LogRocket Key Features
- Autocapture with retroactive definitions: A single-line script captures every event automatically, and newly created event labels apply instantly to all historical session data.
- Native mobile SDKs: Dedicated SDKs for iOS, Android, React Native, Flutter, Ionic, and Expo deliver pixel-perfect session replay and full UX analytics on mobile.
- Conversion funnels with session drill-down: Multi-step funnel analysis lets you click directly into session replays from any drop-off point for full behavioral context.
- AI feedback analysis: Aggregates user feedback from tools like Zendesk, Qualtrics, and Gong, groups it into themes, and links each theme to correlated session replays.
LogRocket Integrations
LogRocket offers 75+ integrations, including Sentry, Zendesk, Qualtrics, Optimizely, LaunchDarkly, Jira, Snowflake, and BigQuery. It also supports Slack, Microsoft Teams, API access, and MCP connectivity for custom workflows.
Pros and Cons
Pros:
- Galileo AI automates UX issue detection
- Autocapture with retroactive event definitions
- Session replay fidelity is pixel-perfect
Cons:
- Several features unavailable on mobile apps
- Steep pricing for higher session volumes
Learn more about LogRocket:
Diğer UX Analitiği Araçları
İşte kısa listeme girmeyen, ancak yine de incelemeye değer bazı ek UX analitiği aracı seçenekleri:
- 11PendoBest for closing the loop from data to in-app action
- 12PostHogBest for open-source product analytics
- 13Crazy EggBest for A/B testing insights
- 14InspectletBest for real-time user monitoring
- 15SmartlookBest for funnel drop-off replay on web and mobile
- 16Lucky OrangeBest for e-commerce UX and frustration signals
- 17MouseflowBest for friction scoring across all sessions
- 18Microsoft ClarityBest for free, no-cap behavioral analytics
How I Evaluate UX Analytics Tools
I evaluate UX analytics tools in two layers: the baseline capabilities—session replay, heatmaps, funnel analysis—a tool must have, and the differentiators that set the best apart.
Core Functionality (Table Stakes For This List)
When I'm selecting tools for my list, I rank each one on a scale from 0 (does not offer the functionality) to 5 (excels in this area) for each core functionality listed below. Then, I calculate the tool's total score into a percentage. Each tool needs to achieve a minimum total score of 65% to be considered for inclusion.
- Session Replay: I look for playback quality, filtering options, and privacy controls—like whether I can quickly find sessions where a user abandoned a checkout flow or hit a JS error.
- Heatmaps & Click Tracking: Good heatmaps should handle dynamic content and SPAs, not just static pages. I check whether tools support scroll, click, and move maps with segmentation.
- Funnel & Journey Analysis: I evaluate how flexible funnel building is—can I define custom multi-step funnels, see where users drop off, and compare conversion across segments?
- Event & Behavior Tracking: Whether a tool offers autocapture or requires manual instrumentation matters. I look at how easily teams can tag buttons, form fields, and in-app actions.
- Segmentation & Cohort Analysis: Filtering sessions or heatmaps by user attributes like plan type, device, or signup date is essential for understanding behavior across different user groups.
- Frustration & Error Signals: Tools that detect rage clicks, dead clicks, and u-turns help surface usability problems faster than combing through raw session recordings manually.
Once I have a list of tools that meet the criteria, I consider what sets each platform apart.
Differentiating Factors (What Sets Vendors Apart)
Here's how I compare and contrast different vendors:
Standout Features
AI-powered insights save hours of manual analysis by flagging behavioral anomalies automatically—like a sudden spike in rage clicks on a newly shipped feature. Retroactive analysis is another differentiator I value. Applying new event definitions to historical data means your team doesn't wait weeks after re-instrumenting to get results. For teams building mobile products, I also check whether a tool offers native SDKs with gesture tracking and app-specific heatmaps.
Beyond Features
Privacy and compliance matter when session recordings capture real user interactions. I check for PII masking, consent management, and certifications like SOC 2 or GDPR readiness—especially for teams handling sensitive user data. Tech stack fit is equally important. A UX analytics tool should connect to where your team already works, whether that's pushing insights into Jira tickets or piping event data through Segment. I also evaluate pricing transparency, since session-based or MTU-based models can balloon quickly as your product scales.
UX Analitiği Araçları Nasıl Seçilir?
Uzun özellik listeleri ve karmaşık fiyatlandırma yapılarına kendinizi kaptırmanız kolaydır. Benzersiz yazılım seçme sürecinizi yürütürken odaklanmanıza yardımcı olmak için aklınızda bulundurmanız gereken faktörlerin kontrol listesi aşağıda yer alıyor:
| Faktör | Dikkat Edilmesi Gerekenler |
| Ölçeklenebilirlik | Aracın işletmenizle birlikte büyüyebildiğinden emin olun. Kullanıcı tabanınız genişledikçe performanstan ödün vermeden artan veri hacimlerini işleyebilmelidir. |
| Entegrasyonlar | Araçlar arasında kesintisiz veri akışı sağlamak için CRM sistemleri veya pazarlama platformları gibi ekibinizin kullandığı mevcut yazılımlarla uyumluluğunu kontrol edin. |
| Özelleştirilebilirlik | Panoları ve raporları ekibinizin özel ihtiyaçlarına ve iş akışlarına uyarlamanıza olanak tanıyan araçları arayın. |
| Kullanım Kolaylığı | Arayüz sezgisel olmalı ve asgari düzeyde eğitim gerektirmelidir; böylece ekibiniz aracı hızla benimseyip etkili bir şekilde kullanabilir. |
| Bütçe | Hem başlangıç maliyetlerini hem de uzun vadeli fiyatlandırma planlarını göz önünde bulundurun. Aracın bütçenize uygun olduğundan ve sunduğu özellikler karşılığında iyi bir değer sağladığından emin olun. |
| Güvenlik Önlemleri | Kullanıcı verilerinizin güvende olmasını ve düzenlemelere uygunluğunu sağlamak için şifreleme ve erişim denetimleri gibi veri koruma önlemlerini değerlendirin. |
| Destek | Güvenilir müşteri desteği kritik öneme sahiptir. Ekibinizin karşılaşabileceği sorunlarda yardımcı olmak için 7/24 kullanılabilirlik ve birden fazla iletişim seçeneği sunan araçları arayın. |
| Analiz Derinliği | Sunulan analizlerin ayrıntı düzeyini değerlendirin. Araç, kullanıcı davranışına ilişkin derin içgörüler sunarak bilinçli kararlar almanıza yardımcı olmalıdır. |
UX Analitiği Araçlarındaki Trendler
Araştırmam sırasında farklı UX analitiği aracı sağlayıcılarından sayısız ürün güncellemesi, basın bülteni ve sürüm günlüğü derledim. Göz önünde bulundurduğum yeni trendlerden bazıları şunlar:
- Yapay Zekâ Destekli İçgörüler: Yapay zekâ, kullanıcı davranışları hakkında daha derin içgörüler sağlamak için giderek daha fazla kullanılıyor. Araçlar, trendleri tahmin etmek ve veri analizini otomatikleştirmek için makine öğreniminden yararlanarak ekiplerin daha hızlı karar vermesine yardımcı oluyor. Contentsquare gibi sağlayıcılar, kullanıcı trendlerini öne çıkarmak için yapay zekâyı bünyelerine katıyor.
- Kanallar Arası Analitik: İşletmeler, kullanıcı davranışlarını birden fazla kanal genelinde izlemek istiyor. Araçlar; web siteleri, uygulamalar ve diğer dijital temas noktalarındaki kullanıcı etkileşimlerine ilişkin birleşik bir görünüm sunacak şekilde gelişiyor. Bu trend, ekiplerin müşteri yolculuğunun tamamını anlamasına yardımcı oluyor.
- Gizlilik Öncelikli Analitik: Veri gizliliğine ilişkin endişelerin artmasıyla birlikte araçlar, kullanıcı gizliliğinden ödün vermeden analitik sunmaya odaklanıyor. Anonimleştirilmiş veri toplama gibi özellikler daha yaygın hâle geliyor ve GDPR gibi düzenlemelere uyumluluk sağlıyor.
- Gerçek Zamanlı İş Birliği: Uzaktan çalışma devam ederken ekiplerin analitik üzerinde gerçek zamanlı olarak iş birliği yapabilmesi giderek daha fazla önem kazanıyor. Araçlar, ekiplerin içgörüleri paylaşmasına ve veri analizi üzerinde anında birlikte çalışmasına olanak tanıyan özellikleri entegre ediyor.
- Kullanıcı Deneyimine Verilen Önem: Yalnızca verilerin ötesinde, analitik araçlarının kendi içindeki kullanıcı deneyimini geliştirmeye yönelik bir yönelim bulunuyor. Sağlayıcılar, sezgisel arayüzlere ve kullanıcı dostu tasarımlara öncelik vererek ekiplerin analitik verilerle etkileşime geçmesini kolaylaştırıyor.
UX Analitiği Araçları Nedir?
UX analitiği araçları, ekiplerin kullanıcıların dijital ürünlerle nasıl etkileşim kurduğunu anlamasına yardımcı olmak üzere tasarlanmış bir web analitiği aracı türüdür. Genellikle UX tasarımcıları, ürün yöneticileri ve pazarlamacılar tarafından kullanılan bu araçlar, müşteri deneyimini geliştirmek için davranış verilerini nitel içgörülerle birleştirir.
Isı haritaları, oturum tekrarları ve dönüşüm izleme gibi özellikler ekiplerin kullanılabilirlik sorunlarını ortaya çıkarmasına, bireysel kullanıcı davranışlarını izlemesine ve dijital deneyimleri iyileştirmesine olanak tanır. Bu araçlar, hem nicel hem de nitel verileri eyleme geçirilebilir içgörülere dönüştürerek genel kullanıcı memnuniyetini artıran, veriye dayalı tasarım kararlarını destekler.
UX Analitiği Araçlarının Özellikleri
UX analitiği araçlarını seçerken hem nicel izlemeyi hem de nitel kullanıcı araştırmasını destekleyen temel özellikleri arayın:
- Isı haritaları: Kullanıcı etkileşiminin yoğun olduğu noktaları ve sürtünme noktalarını belirlemek için tıklama, kaydırma ve üzerine gelme etkinliklerini görselleştirin.
- Oturum tekrarları: Kullanılabilirlik sorunlarını, öfke tıklamalarını ve terkleri belirlemek için bireysel kullanıcı oturumlarını gözlemleyin.
- Dönüşüm izleme: Dönüşüm hunilerini analiz edin ve kullanıcıların yolculuklarını nerede yarıda bıraktığını bulun.
- Gerçek zamanlı analitik: Ortaya çıkan kalıplara veya sorunlara hızlıca yanıt vermek için canlı davranış verilerine erişin.
- Özelleştirilebilir panolar: Metrikleri ekibinizin hedefleri ve iş akışlarıyla uyumlu olacak şekilde görüntüleyin.
- Davranış uyarıları: Çıkış oranlarındaki ani artışlar veya gezinme döngüleri gibi beklenmedik kalıplar ortaya çıktığında bildirim alın.
- Kohort analizi: Farklı kitleler arasındaki trendleri anlamak için kullanıcıları davranışlarına veya özelliklerine göre segmentlere ayırın.
- Gizlilik öncelikli veri toplama: Anlamlı içgörüler toplamaya devam ederken kullanıcı gizliliğine saygı gösterin.
- Kanallar arası izleme: Mobil uygulamalar, web siteleri ve diğer dijital temas noktaları genelindeki kullanıcı yolculuğunun tamamını izleyin.
- Kullanıcı geri bildirimi entegrasyonu: Kullanıcı deneyiminin daha kapsamlı bir görünümünü elde etmek için doğrudan girdileri davranış izlemeyle birleştirin.
UX Analitiği Araçlarının Faydaları
UX analitiği araçlarını uygulamak ekibiniz ve işletmeniz için çeşitli faydalar sağlar. Yararlanabileceğiniz birkaç fayda şunlardır:
- Geliştirilmiş kullanıcı deneyimi: Isı haritalarını ve oturum tekrarlarını analiz ederek sorunlu noktaları belirleyip düzeltebilir, böylece daha akıcı kullanıcı etkileşimleri sağlayabilirsiniz.
- Veriye dayalı kararlar: Gerçek zamanlı analitik ve dönüşüm izleme, ekibinizin bilinçli seçimler yapmasına yardımcı olan içgörüler sağlar.
- Artan dönüşüm oranları: Dönüşüm izleme aracılığıyla terk noktalarını anlamak, kullanıcı yolculuğunu optimize etmenize ve dönüşümleri artırmanıza olanak tanır.
- Geliştirilmiş müşteri memnuniyeti: Kullanıcı geri bildirimini ve kohort analizini entegre ederek deneyimleri kullanıcı ihtiyaçlarını daha iyi karşılayacak şekilde uyarlayabilirsiniz.
- Sorunların zamanında çözülmesi: Davranış uyarıları, kullanıcı davranışlarındaki önemli değişikliklere hızlıca müdahale etmenizi ve olumlu bir deneyimi korumanızı sağlar.
- Kullanıcı yolculuklarının bütünsel görünümü: Kanallar arası izleme, kullanıcı etkileşimlerinin kapsamlı bir görünümünü sunarak tutarlı stratejiler oluşturmanıza yardımcı olur.
- Düzenlemelere uyumluluk: Gizlilik öncelikli veri toplama, veri uygulamalarınızın düzenlemelerle uyumlu olmasını sağlayarak kullanıcı bilgilerini korur.
UX Analitiği Araçlarının Maliyetleri ve Fiyatlandırması
UX analitiği araçlarını seçmek, mevcut çeşitli fiyatlandırma modellerini ve planları anlamayı gerektirir. Maliyetler özelliklere, ekip büyüklüğüne, eklentilere ve daha fazlasına göre değişir. Aşağıdaki tablo, UX analitiği aracı çözümlerinde yaygın olarak sunulan planları, ortalama fiyatlarını ve genellikle dahil edilen özellikleri özetlemektedir:
UX Analitiği Araçları için Plan Karşılaştırma Tablosu
| Plan Türü | Ortalama Fiyat | Yaygın Özellikler |
| Ücretsiz Plan | $0 | Temel ısı haritaları, sınırlı oturum tekrarları ve standart analitik. |
| Bireysel Plan | $5-$50/kullanıcı/ay | Isı haritaları, oturum tekrarları, temel dönüşüm takibi ve sınırlı özel raporlar. |
| İşletme Planı | $50-$150/ kullanıcı/ay | Gelişmiş dönüşüm takibi, gerçek zamanlı analitik, kullanıcı geri bildirimi entegrasyonu ve özelleştirilebilir panolar. |
| Kurumsal Plan | $150+/kullanıcı/ay | Kanallar arası takip, davranışsal uyarılar, yapay zekâ destekli içgörüler ve özel destek. |
UX Analitiği Araçları Hakkında SSS
UX analitiği araçları hakkında sık sorulan bazı soruların yanıtlarını burada bulabilirsiniz:
UX tasarımcılarının veri analitiğini bilmesi gerekir mi?
Evet, UX tasarımcıları veri analitiğini anlamaktan fayda sağlar çünkü bu, tasarım kararlarını bilgilendirir. Kullanıcı etkileşimlerinden elde edilen verileri nasıl yorumlayacağınızı bilmek, tasarımları optimize etmenize ve kullanıcı deneyimlerini geliştirmenize yardımcı olur. Veri analitiği, iyileştirilmesi gereken alanları vurgulayarak tasarım sürecindeki önemli kararları destekler.
Harici analitik araçları nelerdir?
Harici analitik araçları arasında Google Analytics, Hotjar ve Mixpanel gibi popüler platformlar bulunur. Bu araçlar, kullanıcı davranışları hakkında değerli içgörüler sağlayarak kullanıcıların dijital ürünlerinizle nasıl etkileşim kurduğunu anlamanıza ve optimizasyon yapılabilecek alanları belirlemenize yardımcı olur.
UX analitiği araçları mevcut sistemlerle nasıl entegre olur?
UX analitiği araçları genellikle CRM sistemleri, pazarlama platformları ve diğer işletme araçlarıyla entegre olur. Bu entegrasyonlar kesintisiz veri akışı sağlayarak bilgileri bir araya getirmenize ve farklı kanallardaki kullanıcı etkileşimlerini kapsamlı bir şekilde görmenize yardımcı olur.
UX analitiği araçları dönüşüm oranı optimizasyonuna yardımcı olabilir mi?
Evet, UX analitiği araçları kullanıcı yolculuklarını takip ederek ve kullanıcıların süreci terk ettiği noktaları belirleyerek dönüşüm oranı optimizasyonunda önemli bir rol oynar. Bu verileri analiz ederek kullanıcı akışını iyileştirmek ve dijital platformlarınızdaki dönüşüm oranlarını artırmak için bilinçli değişiklikler yapabilirsiniz.