

Ücretsiz ısı haritası yazılımı; tıklamaları, kaydırma derinliğini ve sayfa üzerindeki etkinliği izlemenizi sağlayarak bütçenizi artırmadan kullanıcı deneyimi sorunlarını ve fırsatlarını belirlemenize yardımcı olur.
Ürün yöneticileri, pazarlamacılar ve kullanıcı deneyimi ekipleri için bu yazılımlar, kullanıcıların sitenizle tam olarak nasıl etkileşime girdiğini anlamanın uygun maliyetli bir yoludur. Böylece göz ardı edilen harekete geçirici mesajları, kafa karıştırıcı gezinme yollarını veya ilgiyi koruyamayan bölümleri belirleyebilirsiniz.
Birden fazla ücretsiz aracı test edip karşılaştırdıktan sonra, gizli maliyetler olmadan güvenilir içgörüler, temel özellikler ve kolay kurulum sunan seçenekleri belirledim. Bu araçlar, harcamalarınızı sıfırda tutarken etkileşimi ve dönüşümü artırmanıza yardımcı olur.
Why Trust Our Software Recommendations
6,700+
Reviews
20
Industry experts
16+
Evaluation factors
14
Years
Our team has been testing and reviewing software since 2012. As product managers ourselves, we know how difficult—and important—it is to choose the right software.
For this guide, we evaluated tools using hands-on testing and independent research, scoring tools using our selection criteria.
Our reviews reflect our human editorial judgment, not a sales pitch.
Expert reviewers:
- Andrew LumbySenior TPM
- Cristiano ValimSenior UI/UX Lead


Ücretsiz Isı Haritası Yazılımları Karşılaştırma Tablosu
\u003cp data-pm-slice=\u00221 1 []\u0022\u003eBu karşılaştırma tablosu, bütçenize uygun bir seçenek bulmanıza yardımcı olmak için ücretsiz ısı haritası yazılımı seçimlerimin fiyatlandırmasını ayrıntılı olarak gösterir.\u003c/p\u003e
Score legend (out of 5)
- Excellent4.5–5
- Good4–4.4
- Average3–3.9
- Below average2–2.9
- Poor1–1.9
Sorted by: Default
| Tool | Starting Price | Website | |||||||
|---|---|---|---|---|---|---|---|---|---|
Best for UX research beyond click tracking | 3.8 out of 5 | 3 | 5 | 4 | 3 | 4 | 4 | $80/month Free plan available | Website |
Best for continuous product design | 4.2 out of 5 | 2 | 5 | 4 | 4 | 5 | 5 | Pricing upon request Free demo available | Website |
Best for real-time user tracking | 3.7 out of 5 | 3 | 4 | 4 | 4 | 4 | 3 | Pricing upon request Free plan available | Website |
Best for user feedback integration | 3.8 out of 5 | 3 | 4 | 3 | 3 | 5 | 5 | $49/month Free plan + 15-day free trial + free demo available | Website |
Best for session replay with advanced funnels | 4.2 out of 5 | 3 | 5 | 4 | 5 | 5 | 3 | Pricing upon request Free plan available | Website |
Best for form analytics | 3.5 out of 5 | 3 | 3 | 4 | 3 | 4 | 4 | $39/month Free plan available | Website |
Best for data privacy compliance | 4.2 out of 5 | 2 | 5 | 5 | 4 | 4 | 5 | €275/month Free plan + free trial available | Website |
Best for debugging capabilities | 4.0 out of 5 | 2 | 4 | 3 | 5 | 5 | 5 | $176/month 14-day free trial + free plan available | Website |
Best for large-scale user behavior analysis | 4.3 out of 5 | 4 | 5 | 5 | 4 | 4 | 4 | Pricing upon request Free plan available | Website |
Best for building real-time collaborative workflows | 3.7 out of 5 | 3 | 4 | 3 | 4 | 4 | 4 | $19.99/month 14-day free trial | Website |



En İyi Ücretsiz Isı Haritası Yazılımları İncelemesi
Aşağıda kısa listeme giren en iyi ücretsiz ısı haritası yazılımlarına ilişkin ayrıntılı özetlerimi bulabilirsiniz. İncelemelerim, sizin için en uygun aracı bulmanıza yardımcı olmak amacıyla her aracın temel özelliklerine, avantajlarına \u0026 dezavantajlarına, entegrasyonlarına ve ideal kullanım alanlarına ayrıntılı bir bakış sunar.
 Best for UX research beyond click tracking
- Free plan available
- From $80/month (billed annually)
Visit WebsiteCustomer Rating:4.8/5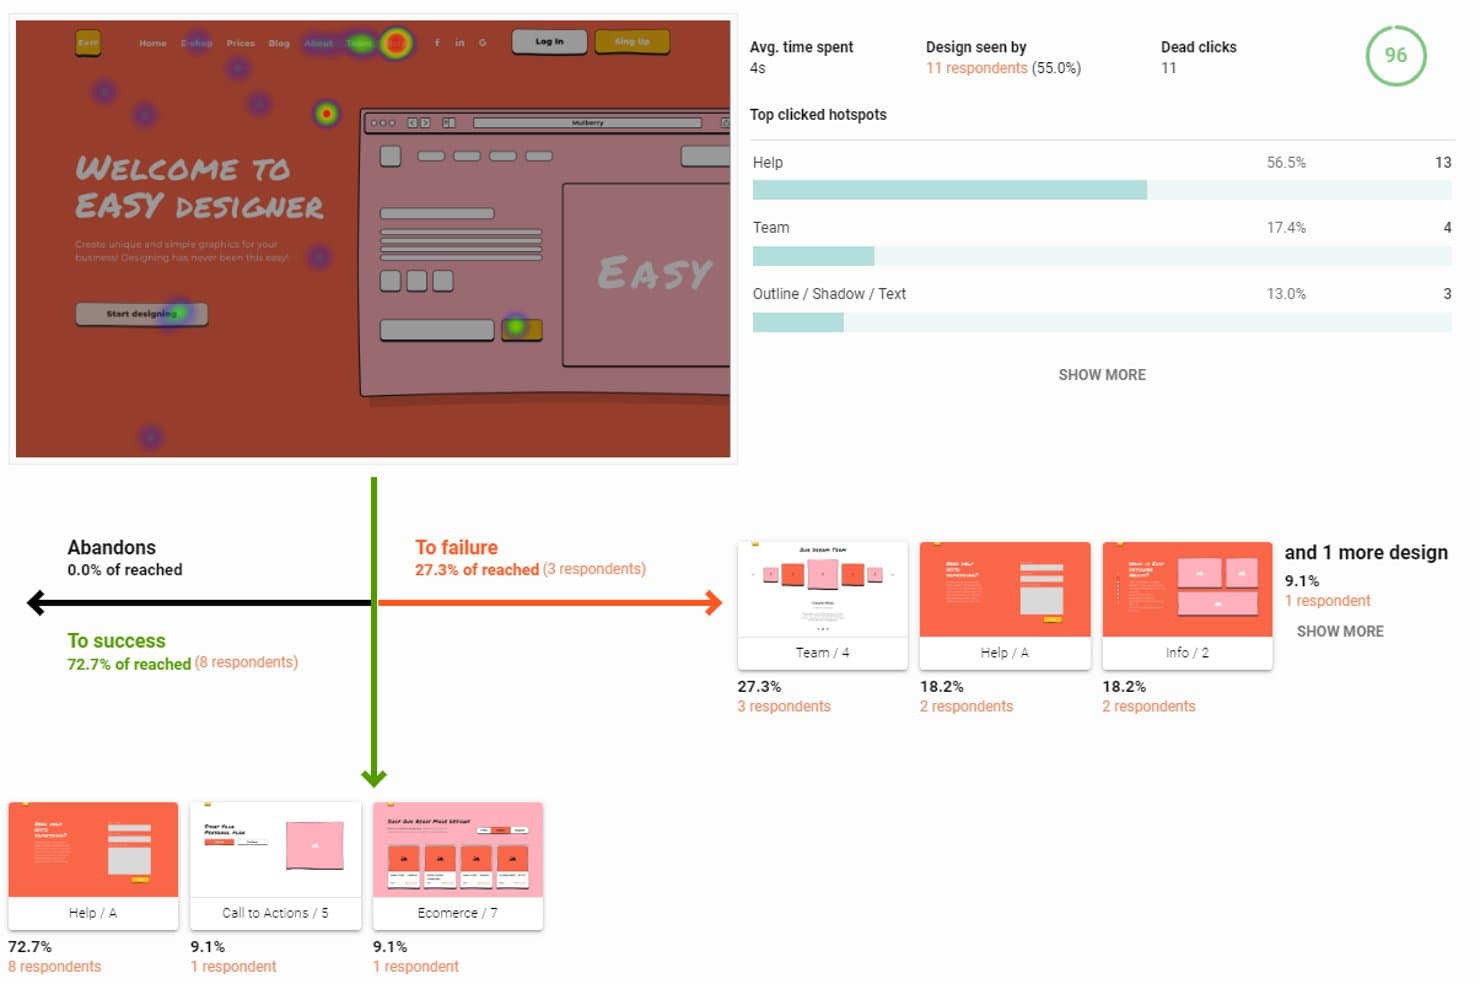
UXtweak tracks click heatmaps, user flow success, and hotspot data. UXtweak is heatmap software with a free-forever plan that combines click, tap, move, and scroll maps with session recordings, URL filters, SmartSearch, and broader UX research tools.
Who Is UXtweak Best For?
UXtweak suits product managers who need heatmaps, session recordings, and broader UX research in one platform.
Why I Picked UXtweak
I picked UXtweak because its heatmaps support UX research beyond click tracking. I can connect click, tap, move, and scroll patterns to recorded sessions through SmartSearch filters, then inspect device, viewport, UTM, and referrer segments. Session replays with network and console logs help my team investigate why users struggle after spotting an engagement pattern.
UXtweak Key Features
- URL matching rules: Target pages with exact, contains, starts-with, ends-with, or regex rules.
- SPA virtual pageviews: Track URL changes without full page reloads.
- Privacy controls: Mask elements and disable IP address or form-input recording.
- Shareable result links: Publish private, public, or password-protected study links.
UXtweak Integrations
UXtweak offers 8 documented integrations, including Google Tag Manager, Figma, Google Drive, Microsoft OneDrive, Notion, Condens, Dovetail, and Marvin. Google Tag Manager supports installation, while the others help with prototype imports, result exports, and research repositories.
What's Free?
UXtweak offers a free-forever plan rather than a time-limited trial. The available plan details don’t specify user, integration, or usage limits, so check current terms before committing to larger research programs.
Pros and Cons
Pros:
- Privacy controls protect sensitive visitor data
- Flexible URL rules support complex page tracking
- Heatmaps link directly to session replays
Cons:
- No rage click or form drop-off analytics
- Free recording limits remain unpublished
Learn more about UXtweak: Best for continuous product design
- Free demo available
- Pricing upon request
Visit WebsiteCustomer Rating:4.7/5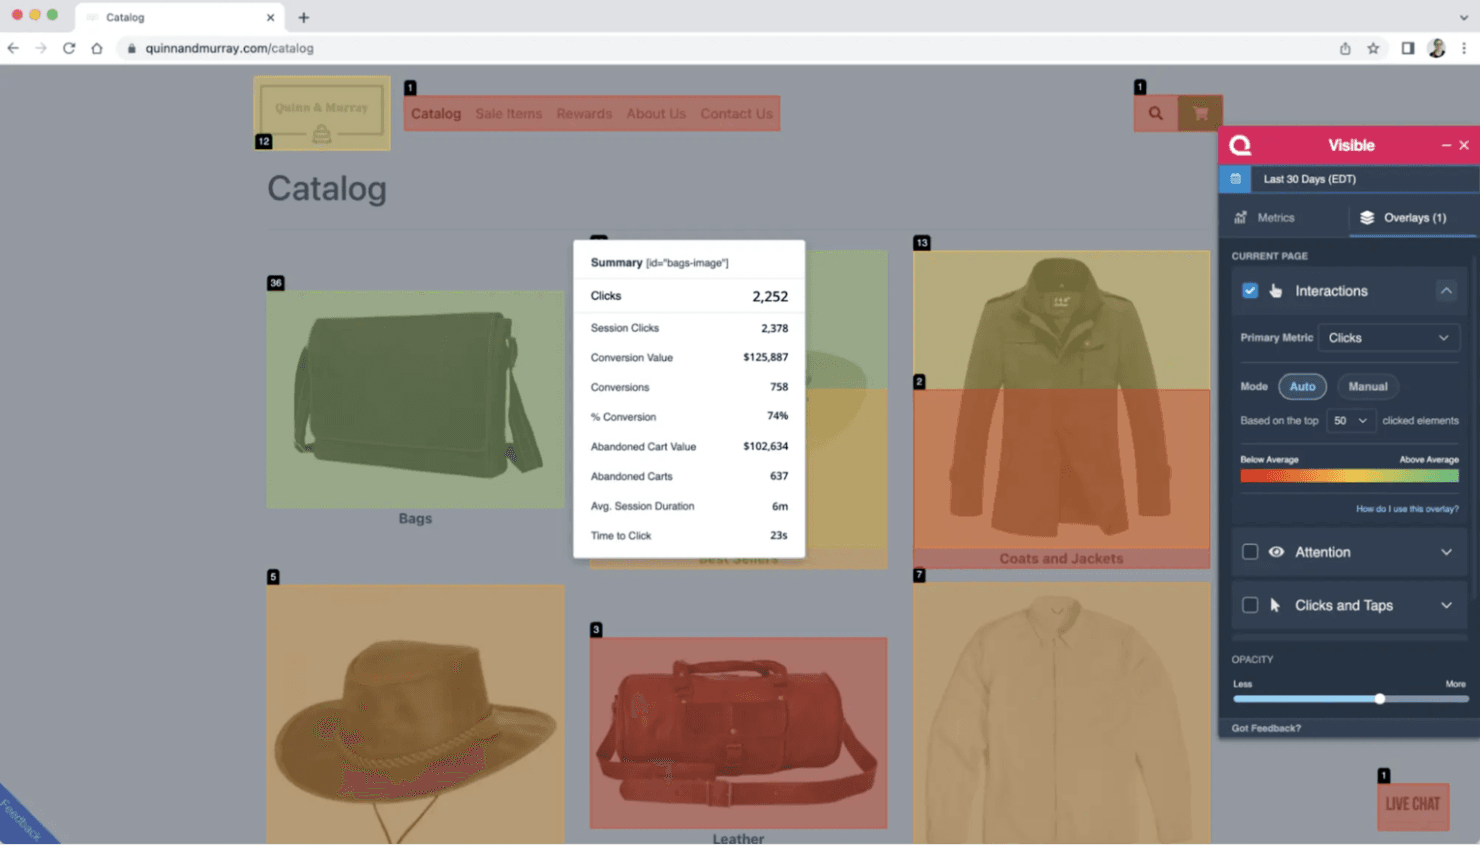
Quantum Metric offers real-time analytics and session replays for enterprises. Quantum Metric is an enterprise digital experience analytics platform—not a free or self-serve heatmap tool—with unsampled click, scroll, attention, and mobile heatmaps connected to session replay, segmentation, and experimentation data.
Who Is Quantum Metric Best For?
Enterprise product and CRO teams that need continuous, cross-platform insight into friction, conversions, and design changes.
Why I Picked Quantum Metric
I picked Quantum Metric for continuous product design because its interaction heatmaps connect clicks, scroll depth, attention, and mobile gestures to session replays. My team can compare converters with non-converters, then review friction before and after a release. It isn’t free, so treat it as an enterprise benchmark rather than a self-serve heatmap option.
Quantum Metric Key Features
- Form analytics: Tracks field errors, skips, hesitation, and completion.
- Visible browser extension: Displays on-page metrics and conversion data.
- Voice of Customer overlays: Adds no-code surveys triggered by user behavior.
- Felix Agentic AI: Summarizes sessions and answers analytics questions.
Quantum Metric Integrations
Quantum Metric offers integrations with Optimizely, AB Tasty, Split, Adobe Analytics, Adobe Customer Journey Analytics, Qualtrics, and Slack. Experimentation integrations support side-by-side variant comparisons, while Adobe connections add heatmap context to existing analytics workflows.
What's Free?
Quantum Metric doesn’t offer a free-forever plan or free trial. Pricing is available upon request, so it’s an enterprise option rather than a free heatmap tool.
Pros and Cons
Pros:
- Converter comparisons reveal revenue-linked friction
- Mobile and web interactions share one view
- Unsampled heatmaps tie clicks to replays
Cons:
- Missing standalone hover and zoned maps
- No free access for quick audits
Learn more about Quantum Metric: Best for real-time user tracking
- Free plan available
- Pricing upon request
Visit WebsiteCustomer Rating:4.6/5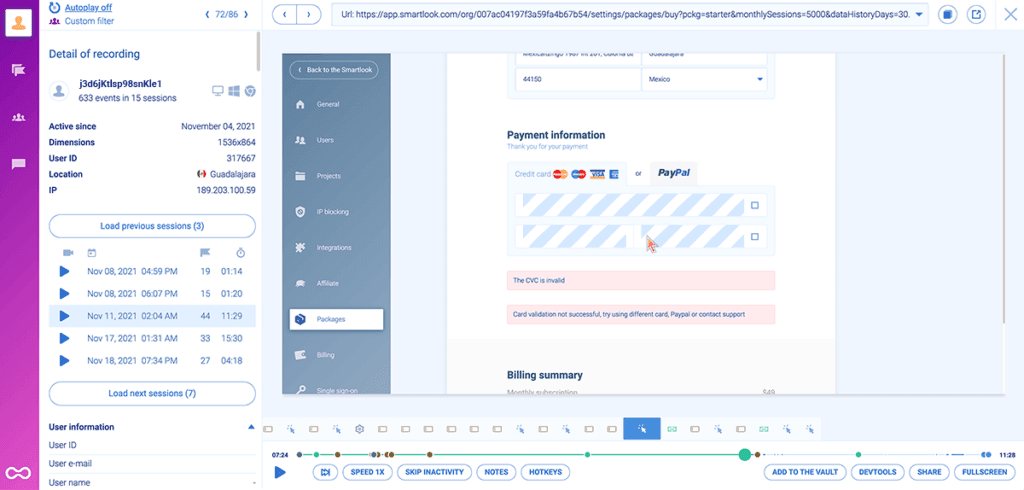
Smartlook is a product analytics tool for web and mobile user insights. Smartlook is free heatmap software for web and mobile apps that combines click, movement, and scroll maps with session recordings, funnels, behavior flows, event analytics, and crash reports.
Who Is Smartlook Best For?
Smartlook suits product and UX teams that need quick web and mobile behavior insights without relying heavily on developers.
Why I Picked Smartlook
I picked Smartlook because it is Best for real-time user tracking, combining click, movement, and scroll heatmaps with session recordings. Funnels, behavior flows, and rage-click filters help me connect live engagement patterns with drop-off points. The free plan remains available, but Cisco’s announced shutdown makes Smartlook suitable for short-term audits rather than long-term adoption.
Smartlook Key Features
- URL matching: Track simple, exact, or substring URL patterns.
- Device views: Switch heatmaps between desktop, mobile, and tablet.
- Crash reports: Review sessions leading up to mobile app crashes.
- Privacy controls: Mask inputs, emails, IP addresses, and page elements.
Smartlook Integrations
Smartlook supports Google Tag Manager, NPM, a REST API, and web and mobile SDKs. Google Analytics, Slack, and Survicate are listed by Capterra, but Smartlook’s current site doesn’t clearly document native integrations.
What’s Free?
Smartlook offers a free plan for tracking web and mobile app behavior with heatmaps, session recordings, and analytics. However, Cisco’s announced shutdown means availability may be limited, so treat the free plan as a short-term option rather than a long-term investment.
Pros and Cons
Pros:
- Historical data speeds initial heatmap creation
- Supports web and mobile app analysis
- Combines heatmaps with session recordings
Cons:
- Scheduled shutdown undermines long-term adoption
- No built-in A/B heatmap comparison
Learn more about Smartlook: Best for user feedback integration
- Free plan + 15-day free trial + free demo available
- From $49/month
Visit WebsiteCustomer Rating:4.5/5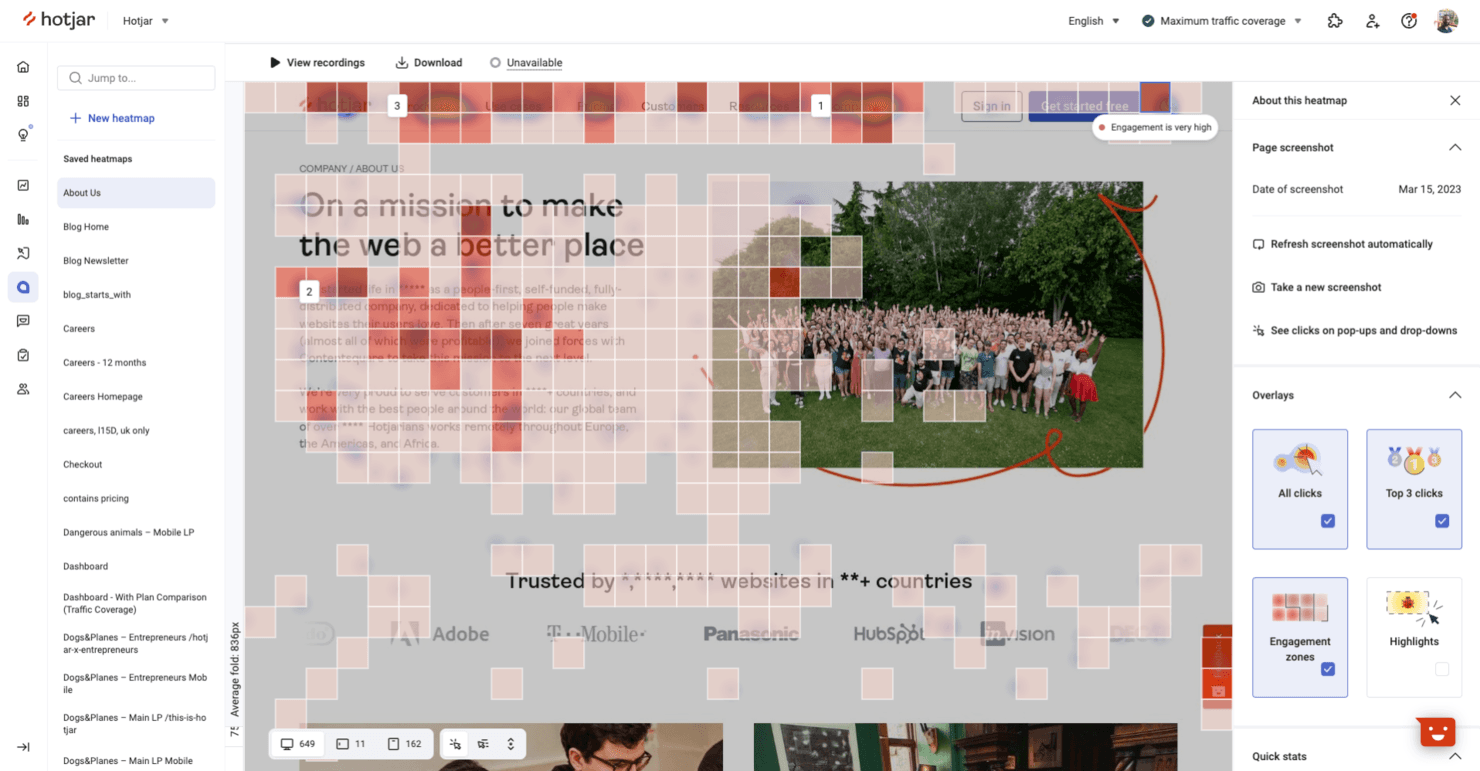
Hotjar helps teams analyze user behavior and gather website feedback. Hotjar (by Contentsquare) is a free heatmap and behavior analytics platform combining click, move, scroll, and attention maps with session replays, funnels, surveys, and feedback widgets.
Who Is Hotjar (by Contentsquare) Best For?
Product teams that connect behavioral data with surveys and feedback widgets will find it useful for research-led prioritization.
Why I Picked Hotjar (by Contentsquare)
I picked Hotjar (by Contentsquare) because its heatmaps connect directly to user feedback. I can pair click, scroll, and attention maps with surveys or feedback widgets, then link responses to replays and segments. That helps me investigate whether a drop-off reflects confusing page behavior or a clearly stated customer concern.
Hotjar (by Contentsquare) Key Features
- Funnels: Build conversion funnels to identify drop-off points.
- URL targeting: Create heatmaps for specific pages or page groups.
- JavaScript error monitoring: Track frontend errors alongside user behavior.
- Performance monitoring: Review page performance signals within the platform.
Hotjar (by Contentsquare) Integrations
Hotjar (by Contentsquare) offers 10+ documented integrations, including Google Analytics, HubSpot, Slack, Jira, Microsoft Teams, Optimizely, Adobe Analytics, Mixpanel, Trello, and Asana. It also supports Zapier.
What's Free?
Hotjar is now part of Contentsquare, where new users can sign up for a free-forever plan with up to 200,000 sessions per month, heatmaps, session replay, surveys, funnels, error monitoring, and 10+ integrations. You’ll also receive a 15-day Growth plan trial with no credit card required, but new Hotjar accounts are no longer available and free-plan features may change.
Pros and Cons
Pros:
- Funnels connect behavior to roadmap decisions
- Unlimited heatmaps support one-off UX audits
- Feedback links replays to customer concerns
Cons:
- Short retention limits longitudinal trend analysis
- Free replays cover only a fraction
Learn more about Hotjar (by Contentsquare): Best for session replay with advanced funnels
- Free plan available
- Pricing upon request
Visit WebsiteCustomer Rating:4.5/5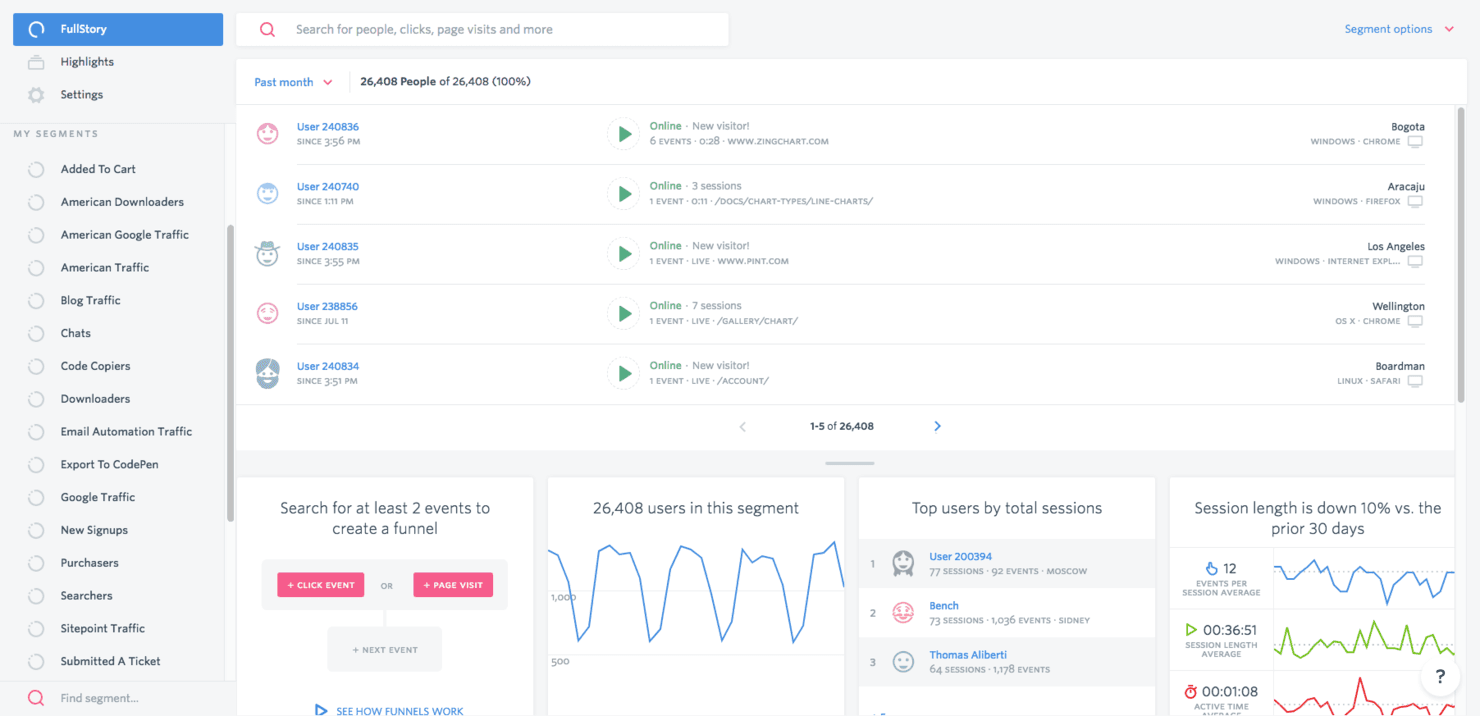
Fullstory provides analytics and session replay to improve user experiences. Fullstory is a free heatmap software platform with click, scroll, and conversion maps alongside session replay, funnels, frustration signals, and no-code autocapture.
Who Is Fullstory Best For?
Product managers and growth teams can connect click and scroll behavior with session replay and funnel drop-offs without extensive event tagging.
Why I Picked Fullstory
I picked Fullstory because it’s best for session replay with advanced funnels, helping me connect heatmap patterns to specific conversion drop-offs. I can filter click maps for rage, error, and dead clicks, then watch matching sessions to see what went wrong. Its URL, event, and hybrid funnels also help me validate whether a product change improves user journeys.
Fullstory Key Features
- No-code autocapture: Capture user interactions without advance event tagging.
- Device and segment filters: Filter heatmap data by device type, segment, and time range.
- Privacy masking: Automatically mask passwords, card numbers, and personally identifiable information.
- PDF heatmap exports: Download heatmaps with page, period, segment, device, and interaction data.
Fullstory Integrations
Fullstory integrates with Slack, Jira, Trello, Microsoft Teams, Google Tag Manager, Segment, and Shopify. It also provides APIs for custom integrations, while webhooks and data exports support broader data workflows on eligible plans.
What's Free?
Fullstory offers a free-forever FullstoryFree plan with up to 30,000 sessions, 10 user seats, and one year of replay and analytics retention. It excludes advanced features such as configurable form privacy, mobile app support, and StoryAI; exceeding the session limit pauses new capture until the next cycle or upgrade.
Pros and Cons
Pros:
- Autocapture supports analysis without event tagging
- Rage and dead-click filters expose friction
- Heatmaps connect clicks to replay sessions
Cons:
- Form-level drop-offs remain unavailable
- No true movement or hover heatmap
Learn more about Fullstory:
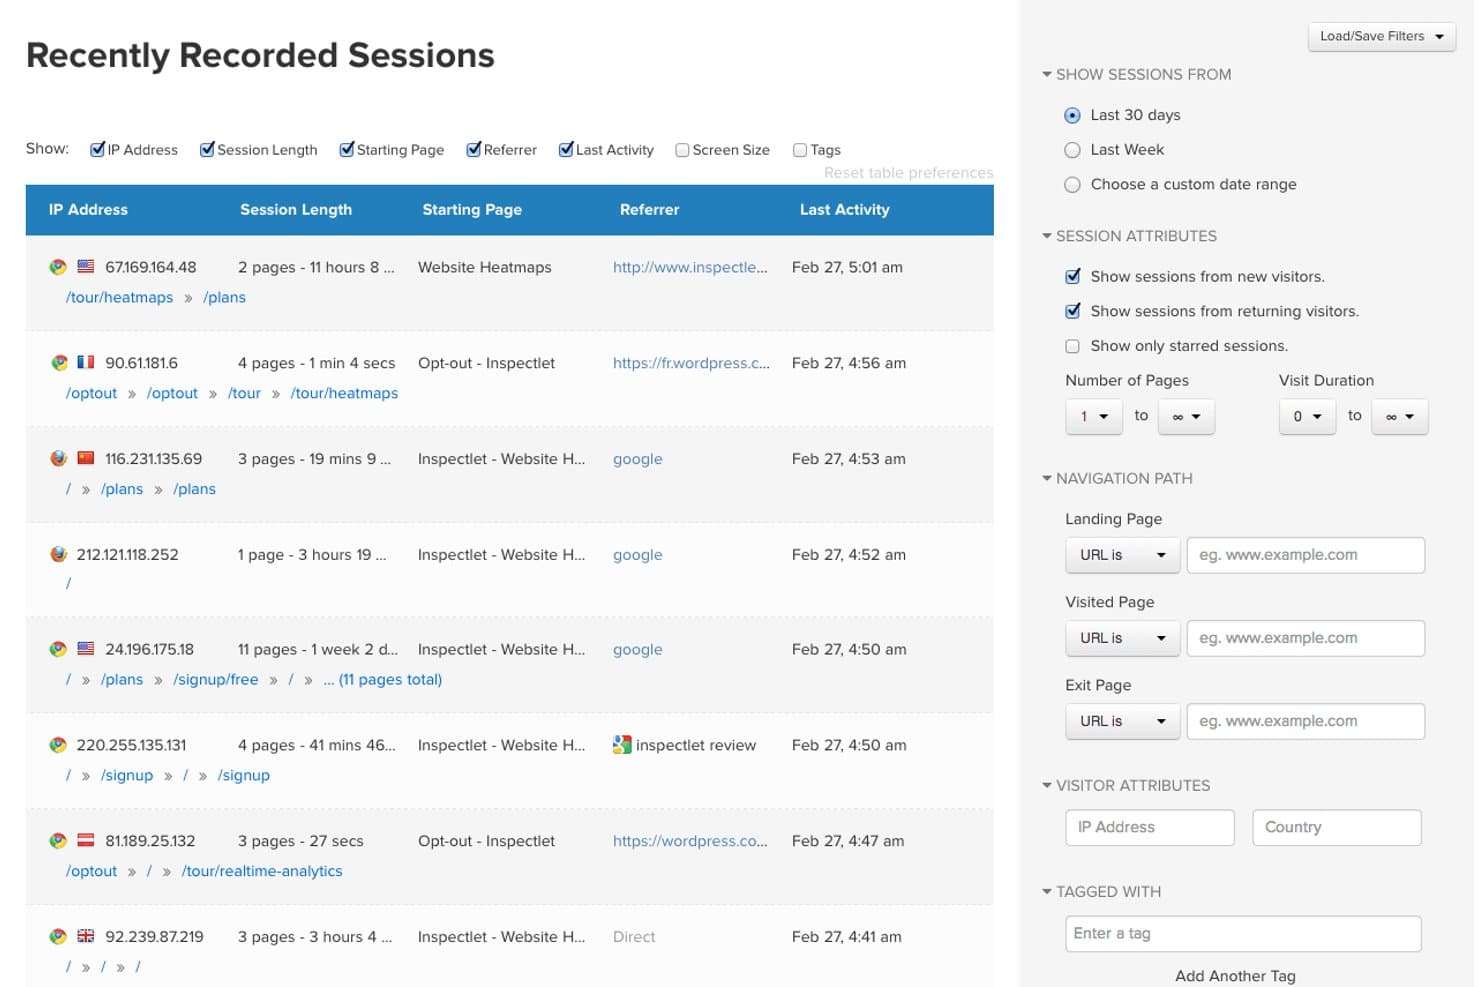
Inspectlet lets users filter recorded sessions by attributes and navigation paths. Inspectlet is a free heatmap software platform with five dynamic heatmap views, session replay, scroll tracking, A/B testing, AI insights, and no-code surveys.
Who Is Inspectlet Best For?
Inspectlet suits product teams and UX designers who need form analytics, session replays, and heatmaps to identify conversion friction.
Why I Picked Inspectlet
I picked Inspectlet because its form analytics connect heatmap behavior to field-level conversion problems. I can review hesitation, fill rates, ignored fields, and drop-off points, then use Click Dots and scroll maps to inspect surrounding page friction. Full form analytics requires the Growth plan, so I treat it as a paid upgrade rather than a free-plan feature.
Inspectlet Key Features
- Session replay: Rewatch clicks, typing, scrolling, navigation, and page visits.
- A/B testing: Create visual experiments and track goals with statistical significance.
- No-code surveys: Build surveys with NPS, emoji, star, text, and multiple-choice questions.
- AI insights: Identify rage clicks, dead clicks, validation errors, and JavaScript errors.
Inspectlet Integrations
Inspectlet integrates with Shopify, WordPress, and Google Tag Manager. It also offers a REST API on the Growth plan and above for custom integrations.
What's Free?
Inspectlet offers a free-forever plan with 2,500 recorded sessions monthly across up to three websites, with no credit card required. It includes session replay, heatmaps, and A/B testing, but limits data retention to one month and stops recording new sessions after reaching the monthly cap.
Pros and Cons
Pros:
- Session filtering helps locate conversion friction
- Dynamic pages and single-page apps render accurately
- Five heatmap views reveal detailed behavior
Cons:
- One-month retention limits before-and-after comparisons
- Form analytics requires a paid upgrade
Learn more about Inspectlet:
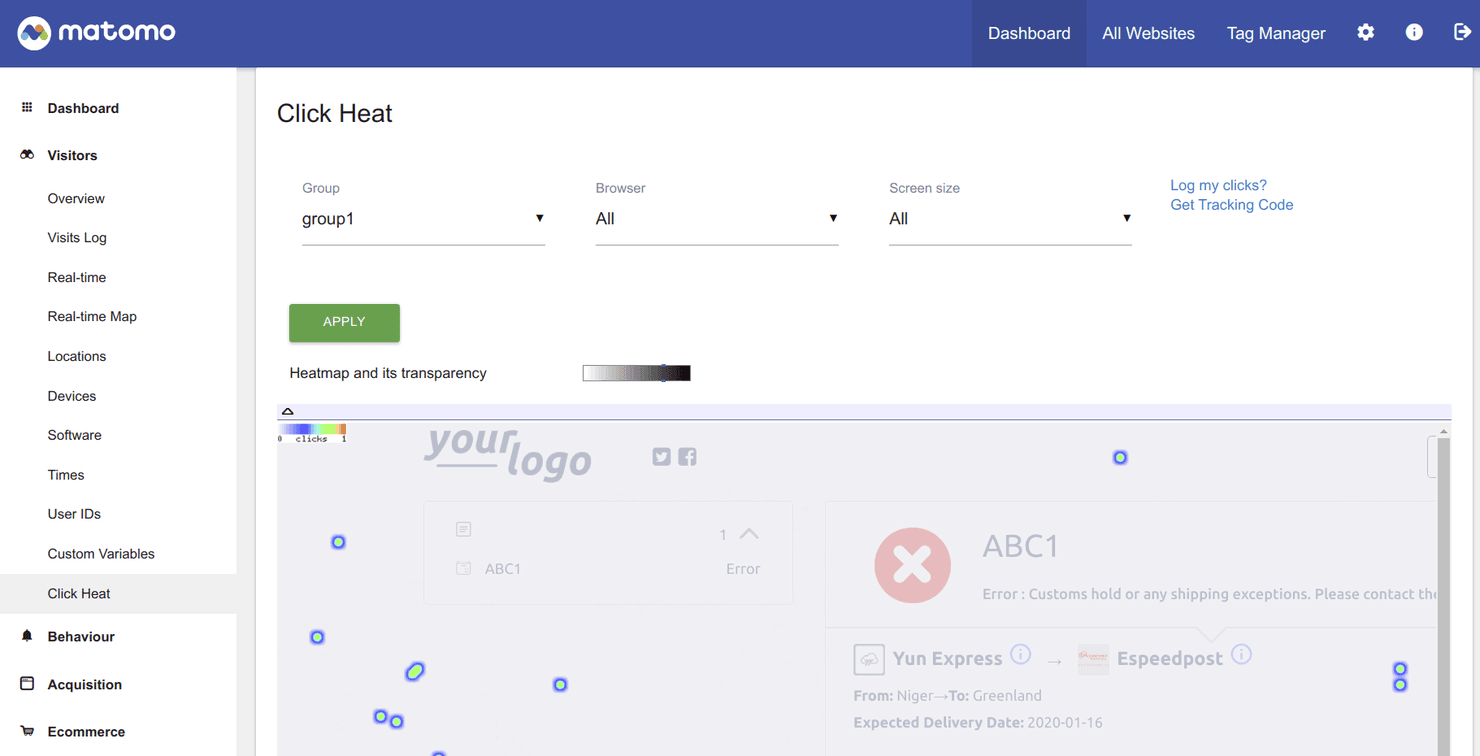
Matomo is an open-source analytics tool focused on privacy and compliance. Matomo is heatmap software with click, move, and scroll maps, session recordings, URL targeting, device and visitor segments, funnels, and form analytics across cloud and self-hosted deployments.
Who Is Matomo Best For?
Matomo suits privacy-conscious product and marketing teams in regulated industries that need heatmaps alongside broader web analytics.
Why I Picked Matomo
I picked Matomo for Best Free Heatmap Software because it’s best for data privacy compliance, with ISO 27001 certification, EU hosting, and self-hosting options. I use its click, move, and scroll maps alongside session recordings to investigate user behavior without sending data to third-party platforms. Its 21-day Cloud trial and 30-day self-hosted plugin trial support a focused UX audit, although heatmaps aren’t free forever.
Matomo Key Features
- URL targeting: Track pages using equals, starts with, contains, or regex rules.
- Device views: Compare desktop, tablet, and mobile behavior with custom breakpoints.
- Visitor segments: Filter reports by browser, country, referrer, or visitor type.
- Form analytics: Find field drop-offs, correction patterns, and time spent per field.
Matomo Integrations
Matomo documents 100+ integrations, including WordPress, WooCommerce, Shopify, BigCommerce, Power BI, Tableau, Looker Studio, Slack, Jira Cloud, and Confluence. Its HTTP API, SDKs, data warehouse connector, and consent-tool integrations support custom analytics workflows.
What's Free?
Matomo offers a 21-day free trial for its Cloud plan and a 30-day free trial for its self-hosted heatmap plugin. Heatmaps aren’t free forever, and continued access requires a paid subscription or license.
Pros and Cons
Pros:
- Segments connect recordings with visitor profiles
- Unlimited on-premise heatmaps avoid sampling limits
- Privacy controls suit regulated analytics teams
Cons:
- Sharing needs API and iframe setup
- Cloud heatmap quotas remain unpublished
Learn more about Matomo: Best for debugging capabilities
- 14-day free trial + free plan available
- From $176/month (billed annually)
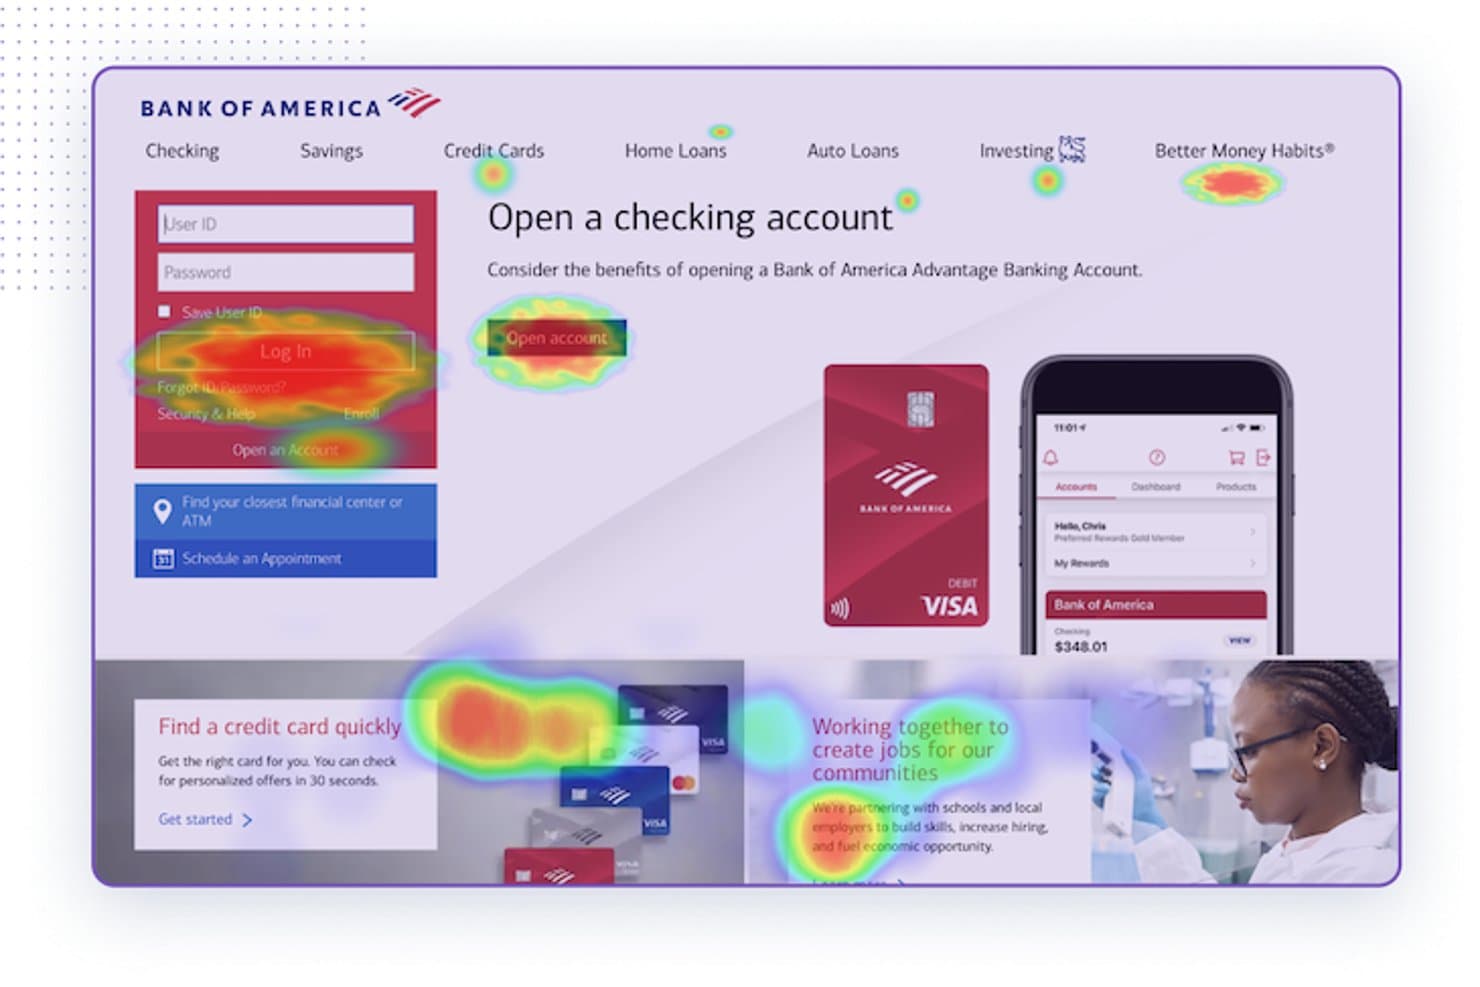
LogRocket overlays heatmaps on live pages to reveal user attention patterns. LogRocket is heatmap software with click, scroll, hover, and conversion-rate maps, zoning, session replay, funnels, path analysis, and frontend debugging data.
Who Is LogRocket Best For?
Product teams that need heatmaps connected to session replay will value LogRocket’s debugging capabilities.
Why I Picked LogRocket
I picked LogRocket because its heatmaps connect directly to session replay, making it my choice for Best for debugging capabilities. I use clickmaps, scrollmaps, and rage-click detection to locate friction, then inspect console errors, network activity, and Redux state in the related replay. That workflow helps me separate interface confusion from frontend defects.
LogRocket Key Features
- Hovermaps: Visualize where desktop users pause their cursors on a page.
- Conversion rate heatmaps: Compare conversion rates for clicks, URLs, or Redux actions.
- Zoning: Analyze clicks within a selected section of a page.
- Path analysis: Review the routes users take through your product.
LogRocket Integrations
LogRocket lists 75 integrations, including 40+ ready-to-use options such as Google Analytics, Amplitude, Mixpanel, Segment, Jira, GitHub, Google Tag Manager, Shopify, and Snowflake. Its MCP server and API support custom integrations.
What's Free?
LogRocket offers a 14-day free trial rather than a free-forever plan. After the trial ends, you’ll need a paid plan to continue using its heatmaps, session replay, and debugging features.
Pros and Cons
Pros:
- Offers conversion-rate and hover heatmaps
- Detects rage clicks and dead clicks
- Connects heatmaps directly to session replays
Cons:
- Requires SDK or script installation
- No free-forever plan confirmed
Learn more about LogRocket: Best for large-scale user behavior analysis
- Free plan available
- Pricing upon request
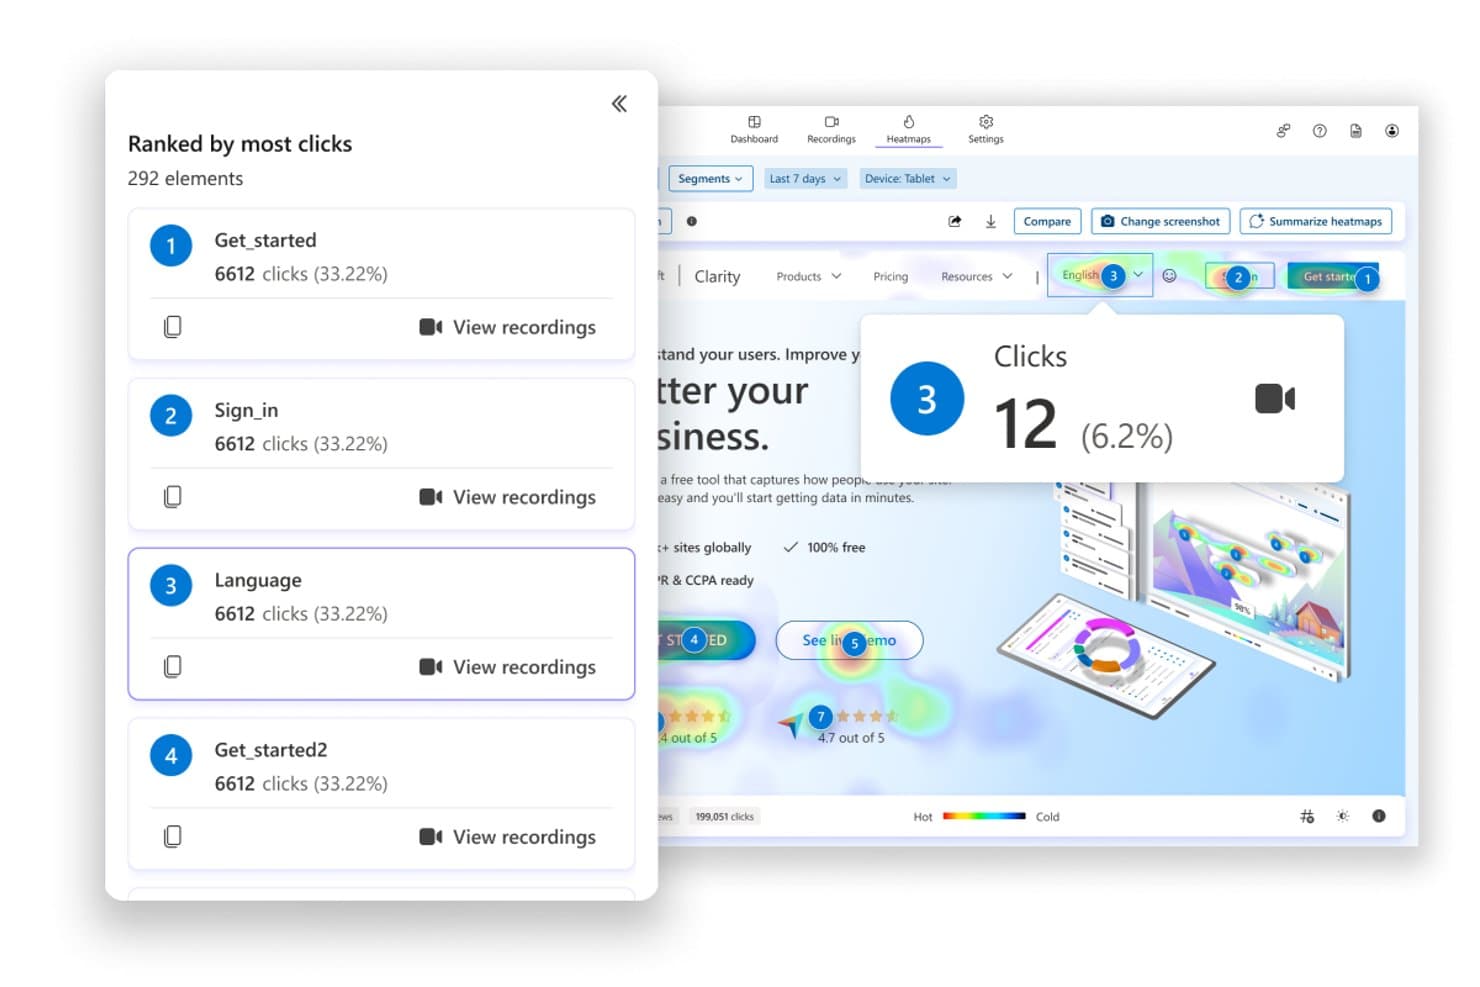
Microsoft Clarity ranks clicked elements by frequency with heatmap overlays. For teams evaluating free heatmap software, Microsoft Clarity combines click, scroll, area, attention, and conversion maps with session recordings, segmentation, and AI summaries across websites and mobile apps.
Who Is Microsoft Clarity Best For?
Product managers, UX designers, and marketers at high-traffic teams can connect heatmaps, recordings, and friction signals across web and mobile experiences.
Why I Picked Microsoft Clarity
I picked Microsoft Clarity for large-scale user behavior analysis because it connects click, scroll, attention, and conversion maps with session recordings. I use rage-click, dead-click, Core Web Vitals, UTM, and device filters to isolate friction across high-traffic journeys. Heatmaps Compare then shows how design changes affect different segments.
Microsoft Clarity Key Features
- Area maps: Visualize interaction concentration across page sections.
- Mobile app SDK: Install Clarity in Android, iOS, React Native, and Flutter apps.
- Heatmap exports: Download filtered data as CSV or PNG files.
- URL grouping: Combine matching pages with exact URL rules or regex.
Microsoft Clarity Integrations
Microsoft Clarity offers documented integrations with Google Analytics, Google Tag Manager, Shopify, WordPress, WooCommerce, Wix, Softr, VisualSP, and CookieYes. Android, iOS, React Native, and Flutter SDKs, plus the Data Export API and MCP server, support custom connectivity.
What's Free?
Microsoft Clarity is free forever, not a time-limited trial. The plan has no traffic limits and includes heatmaps, session recordings, and integrations, although data collection still requires installing Clarity on each website or app.
Pros and Cons
Pros:
- Supports high-volume behavioral analysis
- Compares segments, devices, and timeframes
- Tracks rage, dead, and error clicks
Cons:
- Lacks dedicated form analytics and surveys
- No true cursor-movement heatmaps
Learn more about Microsoft Clarity: Best for building real-time collaborative workflows
- 14-day free trial
- From $19.99/month
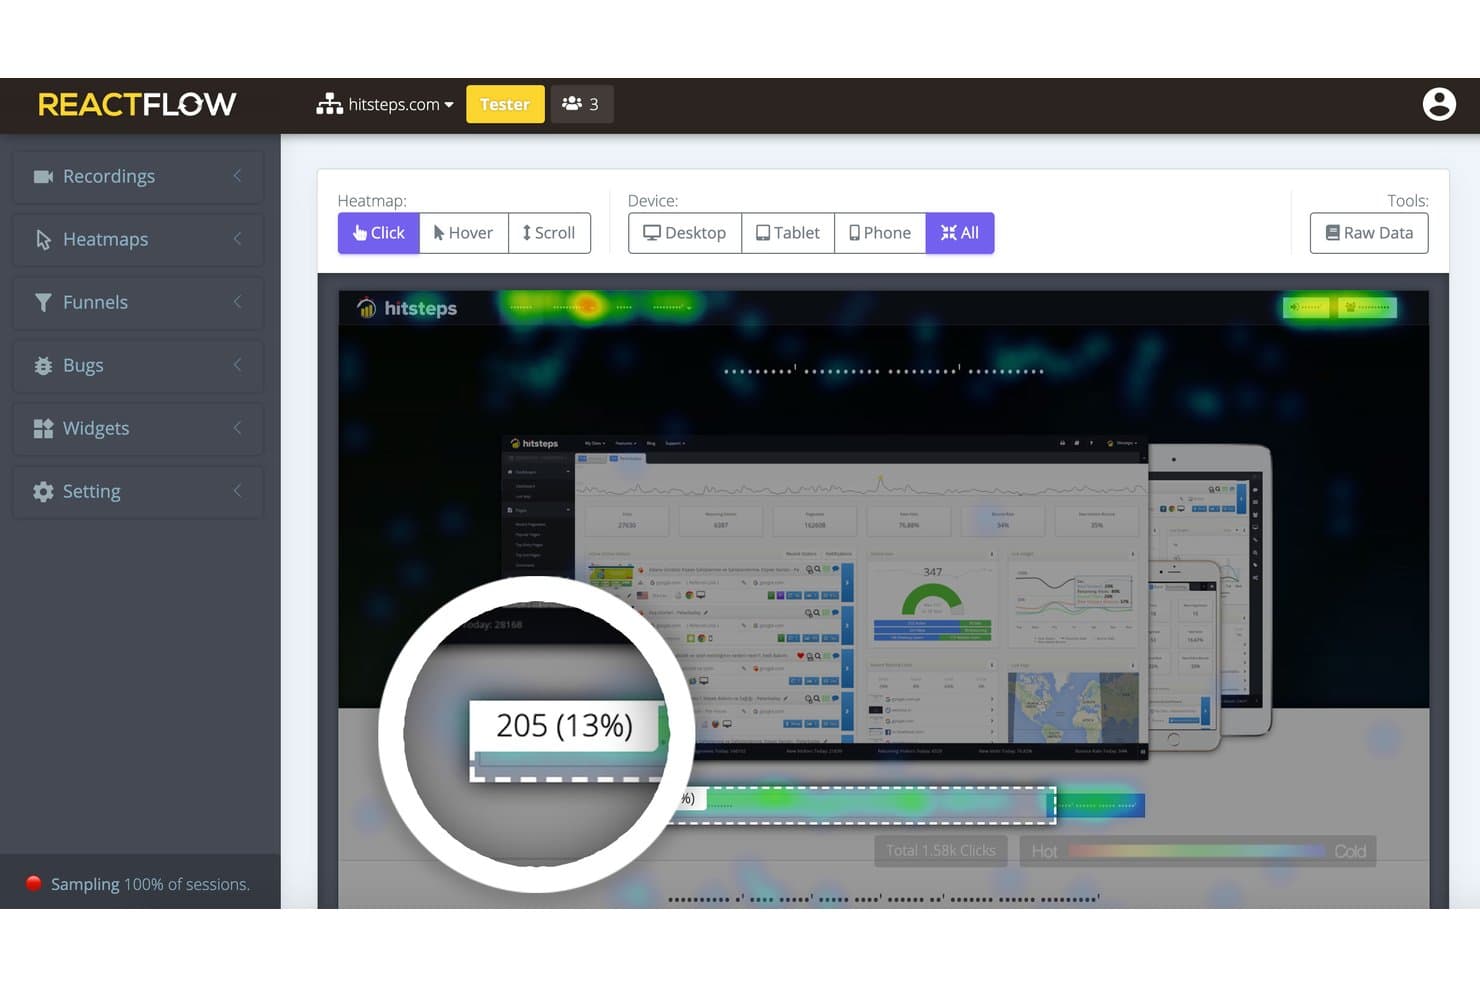
Reactflow lets users visualize click heatmaps across all device types. Reactflow is a website heatmap and session replay platform with click, movement, and scroll maps, funnels, feedback widgets, and JavaScript bug tracking, available through a 14-day full-featured trial.
Who Is Reactflow Best For?
Product managers and UX designers validating page changes through heatmaps, session recordings, funnels, and bug tracking.
Why I Picked Reactflow
I picked Reactflow because its 14-day full-featured trial supports building real-time collaborative workflows around user behavior data. My team can combine click, movement, and scroll maps with recordings, funnels, and pinned comments to review page changes together. Team permissions and shareable links let product and design partners inspect the same evidence, although there’s no standalone free-forever plan.
Reactflow Key Features
- Feedback widgets: Build surveys, polls, NPS forms, and lead-capture widgets.
- Raw data exports: Download element-level heatmap data as CSV files.
- Privacy controls: Mask text and keystrokes, block visitors, and honor Do Not Track.
- Single-page app tracking: Capture activity across SPA, AJAX, and Shadow DOM interfaces.
Reactflow Integrations
Reactflow offers marketplace integrations through WordPress and Shopify, and supports Wix sites. Native integrations with Google Analytics, Slack, Jira, or an API aren’t documented.
What's Free?
Reactflow offers a 14-day free trial with access to its full feature set, rather than a free-forever plan. After the trial, you’ll need a paid plan starting at $19.99 per month to continue using it.
Pros and Cons
Pros:
- Masks text and keystrokes by default
- Links funnel drop-offs to session recordings
- Captures clicks, movement, and scroll depth
Cons:
- No standalone free-forever plan
- Heatmap setup can feel counterintuitive
Learn more about Reactflow:
Diğer Ücretsiz Isı Haritası Yazılımları
Kısa listeme girmeyen ancak yine de göz atmaya değer bazı ek ücretsiz ısı haritası yazılımı seçenekleri şunlardır:
- 11heatmap.comBest for ecommerce revenue-mapped click tracking
- 12Zoho PagesenseBest for CRO and personalization for small businesses
- 13BrowseeBest for AI-powered insights
- 14ContentsquareBest for AI-powered visual journey analytics
- 15FullSessionBest for heatmaps with built-in session replay
How I Evaluate Free Heatmap Software
First, I define what counts as free. Heatmap software qualifies with a limited free-forever plan or a 14-day core-feature trial for an audit. From there, I split my evaluation into three parts: core functionality, weighted most, like mapping clicks and tracking scroll depth; standout features, like rage-click detection; and factors beyond features, like a clear upgrade path.
Core Functionality (Table Stakes For This List)
In addition to my free plan requirements, I use a scoring system to select tools for my list. I score each one on a scale from 0 (does not offer the functionality) to 5 (excels in this area) for each core functionality listed below, based on what's available on the free plan. I then convert the total into a percentage to help assess each tool's overall fit, with extra weight on any functionalities I've deemed essential.
- Click & Movement Heatmaps (Essential): I look for page-level click and cursor or tap patterns that reveal whether visitors notice a primary call to action or click noninteractive elements.
- Scroll Depth Tracking (Essential): I check for visual scroll data that shows where visitors stop on key pages, such as a signup form or product details page.
- Page-Level Tracking: I assess whether you can isolate individual URLs, so an audit can compare engagement across a landing page and its next-step flow.
- Device Breakdown: I look for separate desktop and mobile views to spot issues like a mobile button users struggle to tap.
- Session Recordings: I consider access to replays that help explain why visitors abandon a form or miss a navigation option.
- Export Or Sharing: I check whether teams can share or export heatmaps for a design review, research readout, or product decision.
Once I have a list of tools that meet the criteria, I consider what sets each platform apart.
Differentiating Factors (What Sets Vendors Apart)
Here's how I compare and contrast different vendors:
Standout Features
Rage and dead click detection is the first thing I check because it surfaces exactly where users hit friction—like tapping a element they expect to be clickable but isn't. I also look for form analytics that show field-level drop-off, since a checkout form where users abandon at the phone number field tells a different story than one with low overall starts. Confetti views that color-code clicks by referrer or device help me compare whether paid-traffic visitors interact differently than organic ones on the same page.
Beyond Features
I check whether a free plan includes basic GDPR and CCPA controls like IP anonymization, since missing compliance options can rule out an otherwise solid tool before you even start an audit. Time-to-insight matters just as much—if a heatmap takes days to populate, you can't validate a landing page change mid-sprint. I also evaluate how easily non-technical teammates can view results, looking for public share links or image exports that let you drop behavioral evidence into a roadmap discussion without requiring logins.
Ücretsiz Isı Haritası Yazılımı Nasıl Seçilir?
Uzun özellik listeleri ve karmaşık fiyatlandırma yapıları içinde kaybolmak kolaydır. Kendinize özgü yazılım seçim sürecinizi yürütürken odağınızı korumanıza yardımcı olmak için göz önünde bulundurmanız gereken faktörleri içeren bir kontrol listesi hazırladım:
| Faktör | Dikkate Alınması Gerekenler |
|---|---|
| FaktörÖlçeklenebilirlik | Dikkate Alınması GerekenlerYazılım işletmenizle birlikte büyüyebilir mi? Ek maliyetler veya performans sorunları olmadan artan veri hacmini ve kullanıcı sayısını karşılayıp karşılayamayacağını değerlendirin. |
| FaktörEntegrasyonlar | Dikkate Alınması GerekenlerMevcut araçlarınıza bağlanabiliyor mu? Sorunsuz iş akışı entegrasyonu sağlamak için CRM, CMS ve analiz platformlarınızla uyumluluğunu kontrol edin. |
| FaktörÖzelleştirilebilirlik | Dikkate Alınması Gerekenlerİhtiyaçlarınıza uyacak şekilde düzenleyebilir misiniz? Panoları ve raporları özel iş gereksinimlerinize uyacak şekilde özelleştirmenize olanak tanıyan yazılımları tercih edin. |
| FaktörKullanım kolaylığı | Dikkate Alınması GerekenlerEkibiniz için sezgisel mi? Öğrenme eğrisini ve ekibinizin kapsamlı bir eğitim almadan etkili şekilde kullanmaya başlayıp başlayamayacağını değerlendirin. |
| FaktörUygulama ve işe alıştırma | Dikkate Alınması GerekenlerNe kadar hızlı başlayabilirsiniz? Kurulum sürecini, işe alıştırma kaynaklarının kullanılabilirliğini ve satıcının uygulama sırasında eğitim veya destek sağlayıp sağlamadığını değerlendirin. |
| FaktörMaliyet | Dikkate Alınması GerekenlerBütçenize uyuyor mu? Gizli ücretler de dâhil olmak üzere toplam sahip olma maliyetini değerlendirin ve mali açıdan uygulanabilir bir seçim olduğundan emin olmak için bütçenizle karşılaştırın. |
| FaktörGüvenlik önlemleri | Dikkate Alınması GerekenlerVerileriniz ve kullanıcı bilgileriniz korunuyor mu? Yazılımın veri koruma düzenlemelerine uygun olduğundan ve hassas bilgileri korumak için gelişmiş güvenlik özellikleri sunduğundan emin olun. |
Ücretsiz Isı Haritası Yazılımı Nedir?
Ücretsiz ısı haritası yazılımı, web sitelerindeki kullanıcı etkileşimlerini renk kodlu haritalar aracılığıyla görselleştiren bir araçtır. Bu araçlar genellikle pazarlamacılar, UX tasarımcıları ve ürün yöneticileri tarafından kullanıcı davranışını anlamak ve site tasarımını iyileştirmek için kullanılır.
Tıklama izleme, kaydırma haritalama ve oturum tekrarı özellikleri, kullanıcı etkileşimini belirlemeye ve kullanıcı deneyimini optimize etmeye yardımcı olur. Genel olarak bu araçlar, dijital platformları geliştirmek için daha iyi kararlar alınmasını sağlayan değerli içgörüler sunar.
Ücretsiz Isı Haritası Yazılımının Özellikleri
Ücretsiz ısı haritası yazılımı seçerken aşağıdaki temel özelliklere dikkat edin:
- Tıklama izleme: Kullanıcıların sitenizde nereye tıkladığını görselleştirerek popüler alanları belirlemenize ve daha iyi etkileşim için optimizasyon yapmanıza yardımcı olur.
- Kaydırma haritalama: Kullanıcıların bir sayfada ne kadar aşağı kaydırdığını göstererek içerik görünürlüğünü ve kullanıcı ilgisini ortaya koyar.
- Oturum tekrarı: Kullanıcı etkileşimlerini kaydederek gerçek zamanlı oturumları izlemenize ve kullanıcı davranışını anlamanıza olanak tanır.
- Dönüşüm hunisi analizi: Kullanıcı yollarını ve kullanıcıların ayrıldığı noktaları izleyerek dönüşüm oranlarını optimize etmenize yardımcı olur.
- Isı haritaları: Kullanıcı etkileşimlerinin renk kodlu bir haritasını sunarak kullanıcı davranışı ve etkileşimi hakkında içgörüler sağlar.
- A/B testi: Kitleniz için en iyi sonucu neyin verdiğini belirlemek amacıyla sitenizin farklı sürümlerini test etmenize olanak tanır.
- Form analizleri: Kullanıcıların formlarla etkileşimlerini analiz ederek olası ayrılma noktalarını belirler ve form tamamlama oranlarını iyileştirir.
- Kullanıcı geri bildirimi entegrasyonu: Kullanıcı geri bildirimlerini doğrudan siteden toplar ve nicel verilerin yanı sıra nitel içgörüler de sunar.
- Özelleştirilebilir panolar: Analiz görünümlerini belirli iş ihtiyaçlarını karşılayacak şekilde uyarlamanıza olanak tanıyarak verilerin yorumlanmasını geliştirir.
- Gerçek zamanlı analizler: Kullanıcı etkileşimleri hakkında anında içgörüler sunarak hızlı kararlar almayı ve düzenlemeler yapmayı mümkün kılar.
Ücretsiz Isı Haritası Yazılımının Avantajları
Ücretsiz ısı haritası yazılımını uygulamak ekibiniz ve işletmeniz için çeşitli avantajlar sağlar. Yararlanabileceğiniz avantajlardan bazıları şunlardır:
- Geliştirilmiş kullanıcı etkileşimi: Tıklama izleme ve kaydırma haritalama verilerini analiz ederek kullanıcı etkileşimini artırmak için site düzeninizi optimize edebilirsiniz.
- Artırılmış dönüşüm oranları: Dönüşüm hunisi analizi, kullanıcıların nerede ayrıldığını belirlemenize yardımcı olarak dönüşüm oranlarını iyileştiren düzenlemeler yapmanızı sağlar.
- Daha iyi kullanıcı deneyimi: Oturum tekrarı ve ısı haritaları, kullanıcı davranışı hakkında içgörüler sunarak genel kullanıcı deneyimini geliştirmenize olanak tanır.
- Veriye dayalı kararlar: Gerçek zamanlı analizler ve özelleştirilebilir panolar anında içgörüler sunarak hızlı ve bilinçli karar alma süreçlerini destekler.
- Artan form tamamlama oranı: Form analizleri, formlardaki olası ayrılma noktalarını belirleyerek tamamlama oranlarını artırmak için gerekli değişiklikleri yapmanıza yardımcı olur.
- Değerli kullanıcı geri bildirimi: Kullanıcı geri bildirimini doğrudan analizlerle entegre etmek, kullanıcı ihtiyaçlarını ve tercihlerini anlamanıza yardımcı olarak ürün geliştirmelerine yön verir.
Ücretsiz Isı Haritası Yazılımının Maliyetleri ve Fiyatlandırması
Ücretsiz ısı haritası yazılımı seçmek, mevcut çeşitli fiyatlandırma modellerinin ve planların anlaşılmasını gerektirir. Maliyetler özelliklere, ekip büyüklüğüne, eklentilere ve daha fazlasına göre değişir. Aşağıdaki tablo, ücretsiz ısı haritası yazılımı çözümlerinde yaygın olarak sunulan planları, bunların ortalama fiyatlarını ve tipik özelliklerini özetlemektedir:
Ücretsiz Isı Haritası Yazılımı İçin Plan Karşılaştırma Tablosu
| Plan Türü | Ortalama Fiyat | Yaygın Özellikler |
|---|---|---|
| Plan TürüÜcretsiz Plan | Ortalama Fiyat$0 | Yaygın ÖzelliklerTemel ısı haritaları, sınırlı oturum kayıtları ve temel kullanıcı etkileşimi verileri. |
| Plan TürüKişisel Plan | Ortalama Fiyat$5-$25/kullanıcı/ay | Yaygın ÖzelliklerGelişmiş ısı haritaları, kaydırma haritaları, temel A/B testi ve sınırlı entegrasyonlar. |
| Plan Türüİşletme Planı | Ortalama Fiyat$50-$100/kullanıcı/ay | Yaygın ÖzelliklerGelişmiş ısı haritaları, tam oturum tekrarları, dönüşüm hunisi analizi ve kullanıcı geri bildirimi araçları. |
| Plan TürüKurumsal Plan | Ortalama Fiyat$150-$300/kullanıcı/ay | Yaygın ÖzelliklerÖzelleştirilebilir panolar, kapsamlı analizler, öncelikli destek ve tam entegrasyonlar. |
Ücretsiz Isı Haritası Yazılımı SSS
Ücretsiz ısı haritası yazılımı hakkında sık sorulan soruların bazı yanıtları burada yer alıyor:
Isı haritaları kullanıcı davranışını izlemede ne kadar doğrudur?
Isı haritaları, kullanıcı etkileşimlerinin görsel bir temsilini sunar; ancak her ayrıntıyı yakalayamayabilir. Kullanıcıların nerelere tıkladığını ve kaydırma yaptığını anlamanıza yardımcı olarak genel eğilimleri ve kalıpları gösterir. Bununla birlikte, bireysel kullanıcı yolculuklarını veya dinamik içerikle olan etkileşimleri doğru şekilde izleyemeyebilirler.
Isı haritaları mobil cihazlardaki kullanıcı davranışını izleyebilir mi?
Evet, birçok ısı haritası aracı mobil cihazlardaki kullanıcı davranışını izleyebilir. Dokunma ve kaydırma gibi mobil kullanıcı etkileşimleri hakkında içgörüler sağlayabilirler. Tüm cihazlarda kapsamlı analiz yapılabilmesi için mobil veri toplamayı destekleyen bir araç seçmek önemlidir.
Isı haritalarını kullanmanın sınırlamaları nelerdir?
Isı haritaları kullanıcıların nerelere tıkladığını ve kaydırma yaptığını gösterebilir; ancak kullanıcıların neden belirli bir şekilde davrandığına ilişkin bağlam çoğunlukla eksiktir. Birden fazla sayfadaki bireysel kullanıcı yolculuklarını izlemez ve dinamik içerikle ilgili zorluk yaşayabilirler. Isı haritalarını oturum kayıtları ve huni analiziyle tamamlamak daha derin içgörüler sağlayabilir.
Isı haritaları web sitesi optimizasyonuna nasıl yardımcı olur?
Isı haritaları, web sitenizin hangi bölümlerinin en çok ilgiyi çektiğini ve kullanıcıların ilgisini nerede kaybettiğini belirlemeye yardımcı olur. Bu kalıpları anlayarak kullanıcı etkileşimini ve dönüşüm oranlarını artırmak amacıyla düzen değişiklikleri, içerik yerleşimi ve tasarım iyileştirmeleri hakkında bilinçli kararlar alabilirsiniz.
Isı haritası yazılımını kullanmak için teknik uzmanlığa ihtiyacım var mı?
Çoğu ısı haritası aracı kullanıcı dostu olacak şekilde tasarlanmıştır ve kapsamlı teknik bilgi gerektirmez. Ancak verileri anlamak ve içgörülere dayanarak bilinçli kararlar almak, belirli analitik beceriler gerektirebilir. Kapsamlı destek ve eğitim kaynakları öğrenme sürecini kolaylaştırabilir.
Isı haritası yazılımını kullanırken gizlilikle ilgili endişeler var mı?
Isı haritası araçları, gizlilikle ilgili endişelere yol açabilecek kullanıcı etkileşimi verilerini toplar. GDPR gibi veri koruma düzenlemelerine uyan bir araç seçmek çok önemlidir. Yazılımın kullanıcı verilerini anonimleştirdiğinden ve hassas bilgileri izlemenin dışında bırakma seçenekleri sunduğundan emin olun.