

Piyasada çok sayıda farklı kullanıcı davranışı çözümü bulunduğundan, hangisinin sizin için doğru olduğunu belirlemek zor olabilir. Kullanıcı deneyimini iyileştirmek ve dönüşümleri optimize etmek amacıyla veriye dayalı kararlar almanıza yardımcı olmak için kullanıcıların çeşitli unsurlarda nasıl gezindiğini, etkileşim kurduğunu ve davrandığını belirlemek istediğinizi biliyorsunuz; ancak hangi aracın en iyi olduğunu anlamanız gerekiyor. Doğru yerdesiniz! Bu yazıda, büyük ekipler ve karmaşık ürünlerle onlarca farklı araç kullanarak edindiğim kişisel deneyimlerden yararlanıp en iyi kullanıcı davranışı analitiği araçlarına dair derlediğim listeyi sunarak seçiminizi kolaylaştıracağım.
Why Trust Our Software Recommendations
6,700+
Reviews
20
Industry experts
16+
Evaluation factors
14
Years
Our team has been testing and reviewing software since 2012. As product managers ourselves, we know how difficult—and important—it is to choose the right software.
For this guide, we evaluated tools using hands-on testing and independent research, scoring tools using our selection criteria.
Our reviews reflect our human editorial judgment, not a sales pitch.
Expert reviewers:
- Andrew LumbySenior TPM
- Cristiano ValimSenior UI/UX Lead


Kullanıcı Davranışı Analitiği Araçları Karşılaştırma Tablosu
Bu karşılaştırma tablosu, en iyi kullanıcı davranışı analitiği aracı seçimlerimin fiyatlandırma ayrıntılarını özetlemektedir.
Score legend (out of 5)
- Excellent4.5–5
- Good4–4.4
- Average3–3.9
- Below average2–2.9
- Poor1–1.9
Sorted by: Default
| Tool | Starting Price | Website | |||||||
|---|---|---|---|---|---|---|---|---|---|
Best for AI-driven journey and friction analysis | 4.2 out of 5 | 4 | 5 | 5 | 5 | 4 | 2 | Pricing upon request Free demo available | Website |
Best for in-depth reporting | 4.3 out of 5 | 4 | 5 | 5 | 4 | 4 | 4 | $120/month Free plan available | Website |
Best for combining quantitative and qualitative data | 4.0 out of 5 | 4 | 4 | 5 | 5 | 3 | 3 | Pricing upon request Free plan available | Website |
Best for linking feature experiments to behavior data | 3.8 out of 5 | 4 | 4 | 5 | 3 | 4 | 3 | Pricing upon request Free plan + free demo available | Website |
Best for mobile autocapture tied to AI session review | 3.5 out of 5 | 3 | 4 | 5 | 5 | 2 | 2 | Pricing upon request Free demo + 14-day free trial available | Website |
Best for tagless capture in regulated industries | 3.8 out of 5 | 3 | 5 | 5 | 4 | 4 | 2 | Pricing upon request Free demo available | Website |
Best for product analytics with in-app guidance | 4.0 out of 5 | 4 | 4 | 5 | 4 | 4 | 3 | Pricing upon request Free plan + 30-day free trial + free demo available | Website |
Best for no-code visual event tracking | 3.8 out of 5 | 3 | 4 | 5 | 4 | 4 | 3 | Pricing upon request Free plan available | Website |
Best for linking replays to funnel drop-off analysis | 4.3 out of 5 | 4 | 5 | 5 | 5 | 4 | 3 | Pricing upon request Free plan available | Website |
Best for unified replay, heatmap and product analytics | 3.8 out of 5 | 3 | 4 | 5 | 4 | 4 | 3 | $39/month Free plan + free demo + 15-day free trial available | Website |


En İyi Kullanıcı Davranışı Analitiği Araçları İncelemeleri
Aşağıda, kısa listeme giren en iyi kullanıcı davranışı analitiği araçlarına ilişkin ayrıntılı özetlerimi bulabilirsiniz. İncelemelerimde, her aracın temel özelliklerine, artılarına ve eksilerine, entegrasyonlarına ve ideal kullanım alanlarına ayrıntılı bir bakış sunarak sizin için en uygun olanı bulmanıza yardımcı oluyorum.
 Best for AI-driven journey and friction analysis
- Free demo available
- Pricing upon request
Visit WebsiteCustomer Rating:4.7/5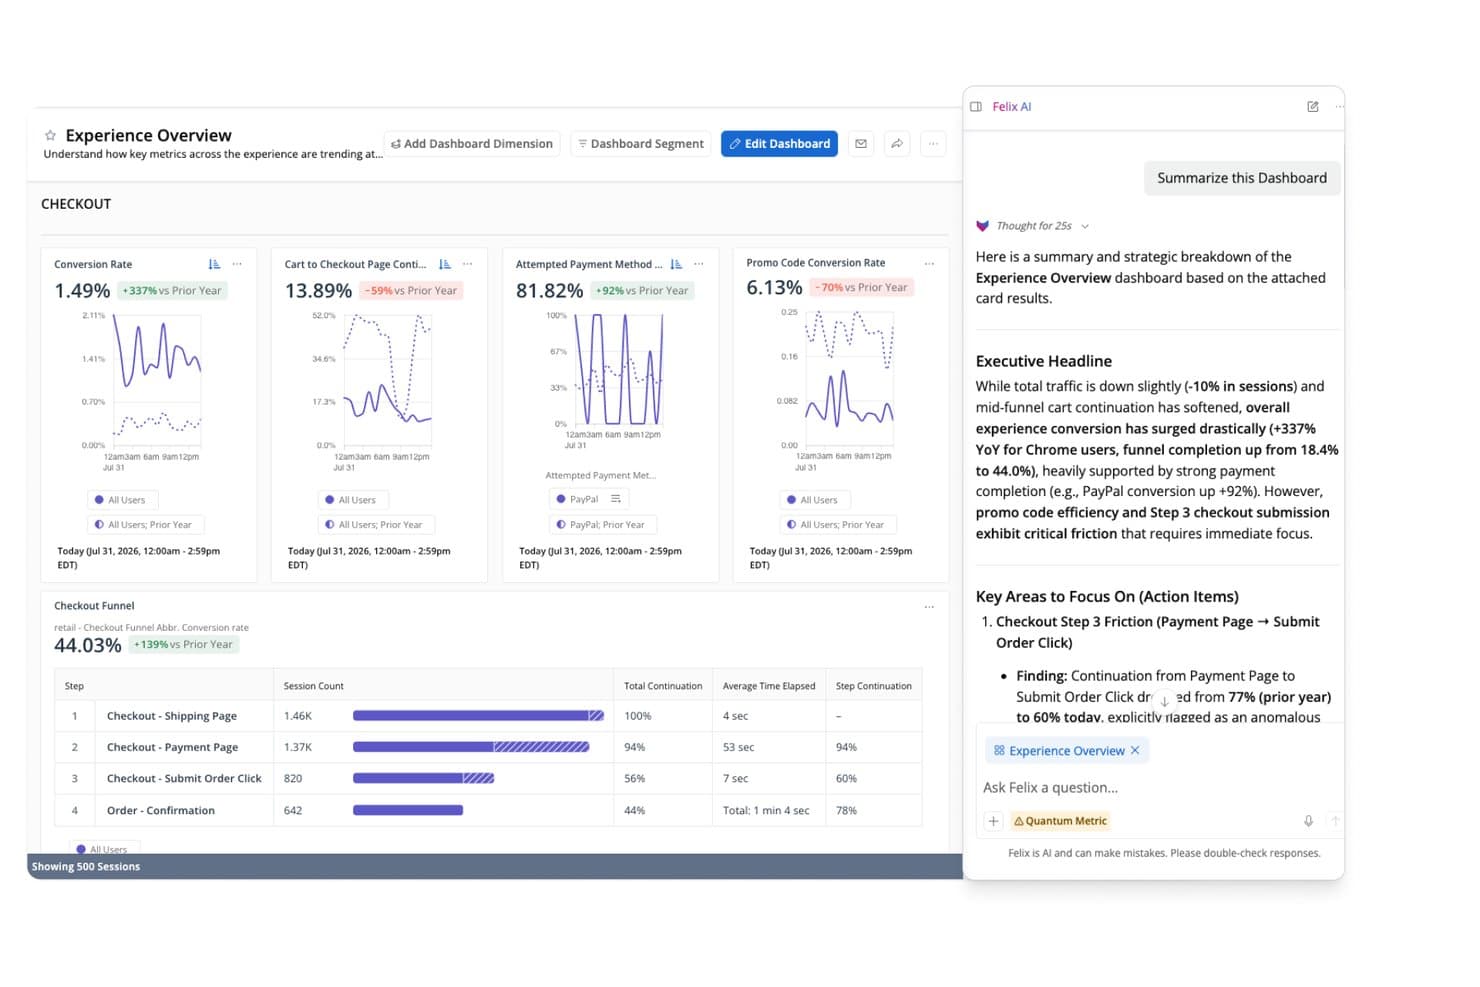
Quantum Metric's Felix AI summarizes checkout funnel insights instantly. Quantum Metric is a user behavior analytics platform that captures behavioral, technical, and friction signals across web, mobile, and kiosk, combining session replay, interaction heatmaps, journey analysis, and AI-driven insights in one place.
Who Is Quantum Metric Best For?
Quantum Metric is a strong fit for enterprise product and digital experience teams at large B2C companies that need to connect behavioral data, journey analysis, and session replay in one place.
Why I Picked Quantum Metric
Quantum Metric earns its spot on my shortlist because its AI-driven journey and friction analysis goes deeper than most tools at this level. I'm particularly impressed by Opportunity Analysis, which automatically quantifies the business impact of friction points in user flows, so I don't have to guess which drop-offs actually matter. Felix AI layers on top of that by monitoring journeys continuously and flagging issues before I've even noticed them, with every alert linked directly to session replays for immediate context.
Quantum Metric Key Features
- Autocapture: A single JavaScript tag or mobile SDK collects 300+ behavioral, technical, and friction signals with no manual tagging required.
- Segment builder: Build nested segments from audience attributes or step sequences and apply them across journeys, sessions, and heatmaps.
- Data streaming: Export session and behavioral data to warehouses like Snowflake, BigQuery, and Redshift via a paid add-on with schema alignment.
- Interaction heatmaps: Visualize clicks, scrolls, and page-level engagement across web and mobile to see where users focus.
Quantum Metric Integrations
Quantum Metric integrates with Split, Optimizely, Google Analytics, Adobe Analytics, Salesforce, Jira, Slack, Snowflake, BigQuery, and Redshift. Data Streaming connects with additional warehouses and destinations, including Databricks, Amazon S3, and Oracle.
Pros and Cons
Pros:
- Autocapture covers web, mobile, and kiosk
- Journey analysis links directly to replays
- AI quantifies friction’s business impact
Cons:
- Retention cohort depth remains unclear
- Enterprise workflows take time to master
Learn more about Quantum Metric: Best for in-depth reporting
- Free plan available
- From $120/month (billed annually)
Visit WebsiteCustomer Rating:4.5/5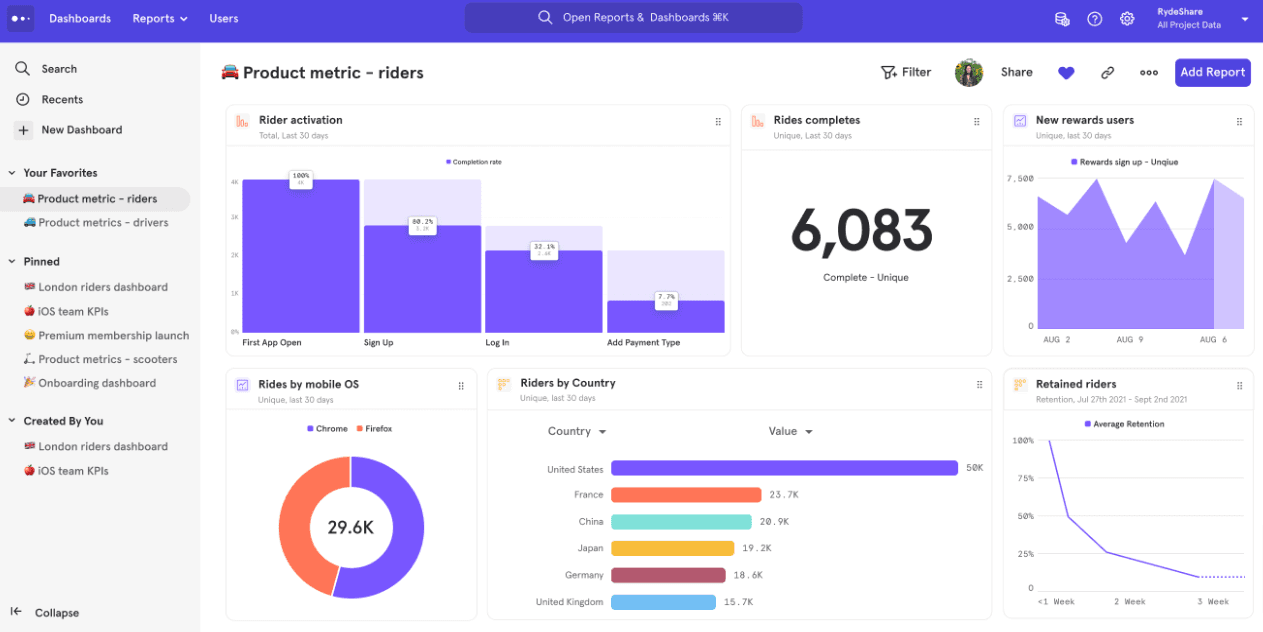
Mixpanel helps you drill down to get granular user data. Mixpanel is a user behavior analytics platform that combines event tracking, funnel and flow analysis, session replay, heatmaps, cohort segmentation, retention reporting, and built-in feature flags and experiments across web and mobile.
Who Is Mixpanel Best For?
Mixpanel is a strong fit for product and data teams that need to go beyond surface-level metrics and dig into exactly how users move through a product.
Why I Picked Mixpanel
Mixpanel earns its spot on my shortlist because the depth of its reporting is genuinely hard to match. I love how funnels let you set custom conversion windows, exclude specific steps, and break results down by any user property—so you're not just seeing where users drop off, but exactly which segments are struggling and why. Pair that with the Flows report, which surfaces paths users actually take rather than the ones you expected, and you get a level of behavioral detail that consistently changes how I interpret product data.
Mixpanel Key Features
- Session replay linkage: Open a session replay directly from a funnel step or chart data point to see exactly what a user did at that moment.
- Feature flags and experiments: Run multi-variant experiments with statistical methods including CUPED and Bonferroni correction, built into the same platform as your analytics.
- Behavioral cohorts: Build and save cohorts based on user behavior, then reuse them as filters across reports or sync them to external marketing tools.
- Warehouse connectors: Pull data from Snowflake, BigQuery, Databricks, and Redshift to run analysis directly against your existing data warehouse.
Mixpanel Integrations
Mixpanel integrations include Segment, mParticle, Snowflake, BigQuery, Databricks, Redshift, HubSpot, ChurnZero, Slack, and Workato. Ingestion, export, and query APIs support custom data connections.
Pros and Cons
Pros:
- Experiments connect releases with behavioral outcomes
- Flows reveal unplanned user journeys
- Links session replays to funnel drop-offs
Cons:
- Enterprise gates anomaly detection and root-cause analysis
- Advanced reporting takes substantial onboarding time
 Best for combining quantitative and qualitative data
- Free plan available
- Pricing upon request
Visit WebsiteCustomer Rating:4.5/5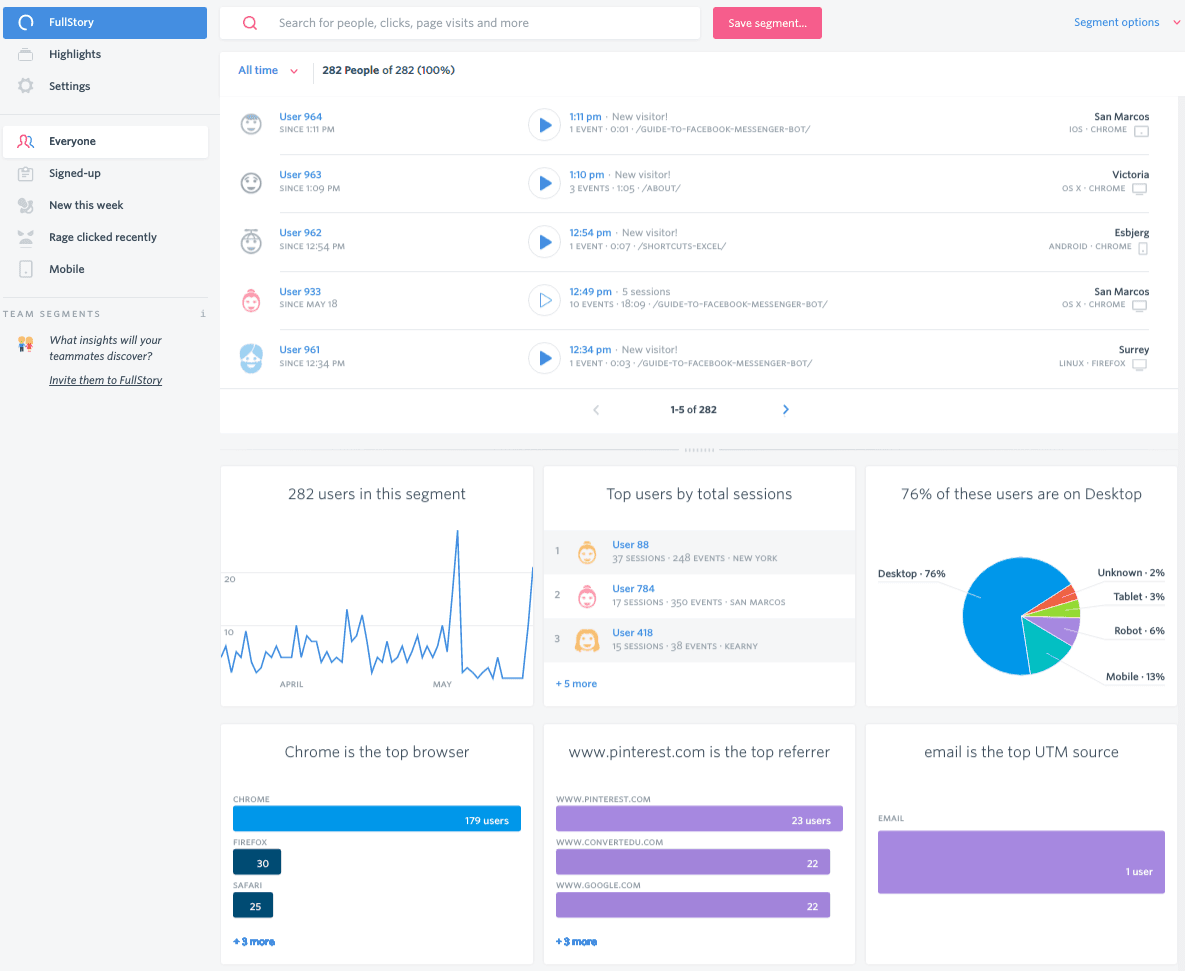
FullStory gives you a complete picture of user behavior. Fullstory is a digital experience analytics platform that captures user behavior through autocapture session replay, heatmaps, funnels, journey analysis, and retention reporting across web and mobile.
Who Is Fullstory Best For?
Fullstory is a strong fit for product and UX teams that need to connect quantitative funnel and retention data with qualitative session replay in a single platform.
Why I Picked Fullstory
Fullstory earns its spot on my shortlist because it's one of the few tools that genuinely bridges the gap between quantitative and qualitative data in a single workflow. I love that you can move from a funnel drop-off directly into session replays of the users who churned, without switching tools or stitching datasets together. Fullcapture autocapture records every interaction retroactively, so you're never locked out of analyzing behavior you didn't think to tag in advance.
Fullstory Key Features
- Omnisearch: Search across all session replays using any captured signal, including rage clicks, errors, or specific page visits, to find the exact sessions you need.
- Segment health and alerts: Monitor user segments over time and get notified when a segment's behavior shifts in a meaningful way.
- Fullstory Anywhere Warehouse: Sends pre-formatted behavioral data directly to your data warehouse so you can combine it with your existing business data.
- Sentiment signals: Detects frustration and confusion cues automatically, surfacing sessions where users are most likely struggling.
Fullstory Integrations
Fullstory supports native integrations, Webhooks, Data Export, and Fullstory Anywhere Warehouse for sending behavioral data to warehouses and cloud storage. Its Activation, Consent, FS.Identity, and Element APIs support custom connections.
Pros and Cons
Pros:
- Combines quantitative and qualitative product data
- Connects funnel drop-offs with session replays
- Retroactive autocapture reveals unplanned behaviors
Cons:
- Alerting may need engineering support at scale
- Mobile implementation can require additional effort
Learn more about Fullstory: Best for linking feature experiments to behavior data
- Free plan + free demo available
- Pricing upon request
Visit WebsiteCustomer Rating:4.5/5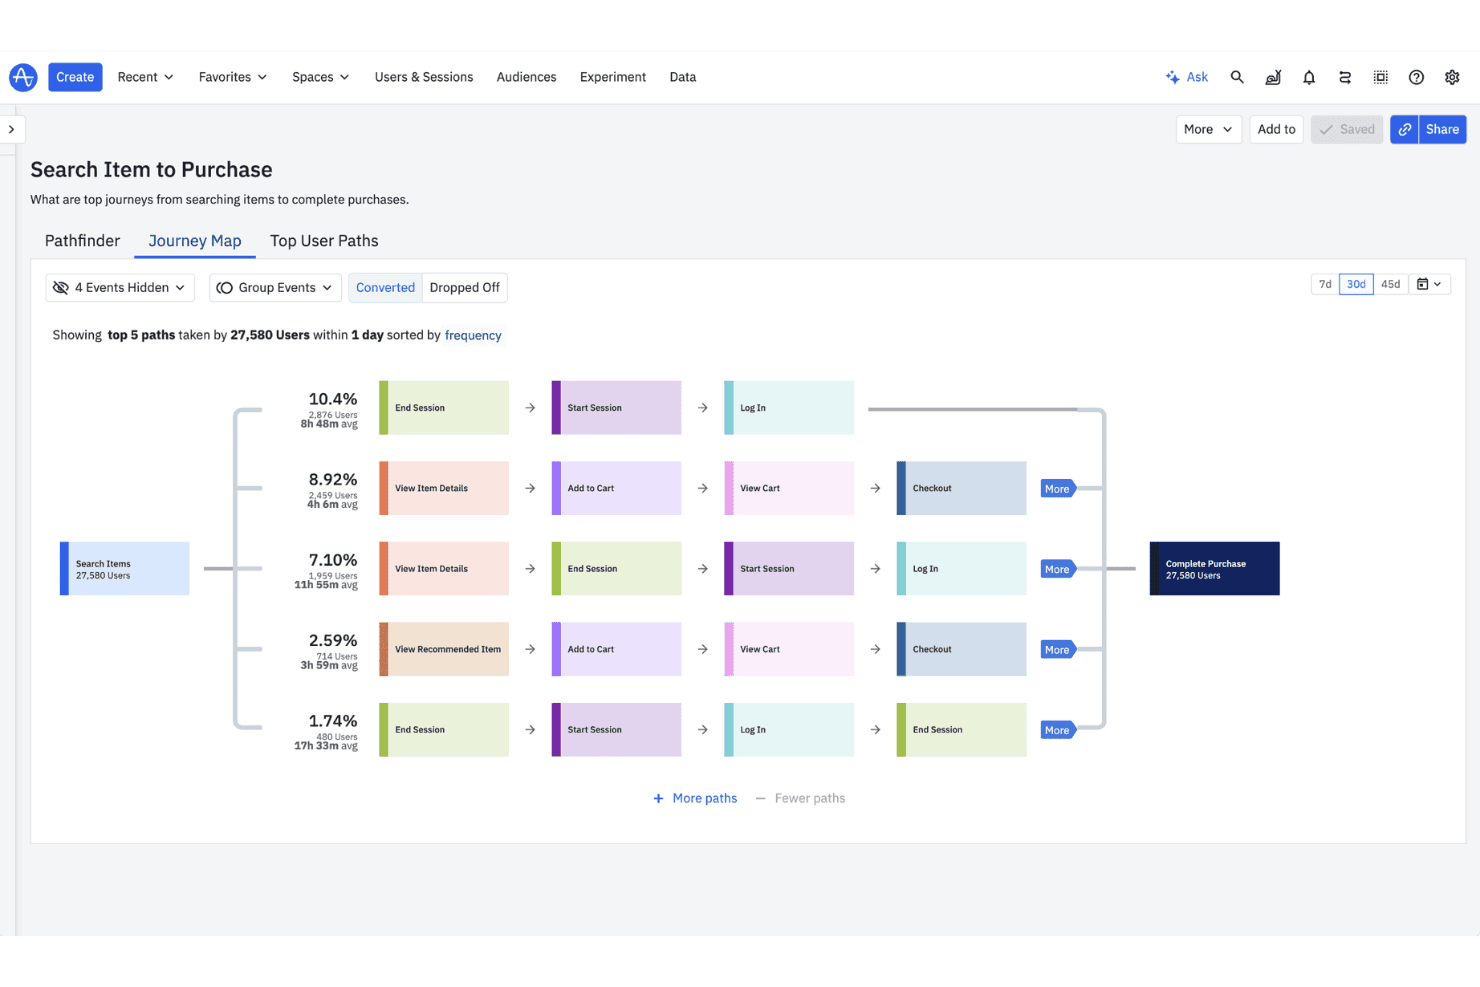
Amplitude offers a Journey Map view that visualizes the top user paths from searching items to completing purchases, with conversion percentages and average session times. Amplitude is a product analytics platform that combines behavioral event tracking, funnel and path analysis, session replay, heatmaps, user segmentation, and built-in experimentation tools across web and mobile.
Who Is Amplitude Best For?
Amplitude is a strong fit for product teams that run experiments and need to tie the results directly back to behavioral data.
Why I Picked Amplitude
Amplitude earns its spot on my shortlist because it's the only tool here that ties experimentation directly to behavioral data in a single workflow. I love that you can run a feature experiment, then immediately break down results by user behavior using funnels, journeys, and retention charts—without exporting anything. Visual Labeling lets you define events retroactively on live data, so past behavior becomes analyzable the moment you name it.
Amplitude Key Features
- Autocapture: Automatically collects clicks, page views, sessions, and form interactions across web, iOS, and Android with minimal setup.
- Behavioral cohorts: Build and sync user segments based on in-product behavior, with scheduled cohort syncs and API access on Growth and higher plans.
- Session replay: Watch real user sessions directly within the analytics platform, available on every plan with up to 50K replays per month on Enterprise.
- AI Feedback: Collects and surfaces user feedback automatically, with up to 2,000 records per month included in the platform.
Amplitude Integrations
Amplitude supports MCP connections to Claude, Cursor, Lovable, and Figma Make, plus a behavioral cohorts API and custom real-time streaming on Growth and higher plans.
Pros and Cons
Pros:
- Combines replay, funnels, and retention analysis
- Visual labeling names events without engineering support
- Links feature experiments to behavior data
Cons:
- Replay retention limits longitudinal session analysis
- Advanced analysis takes analyst-level fluency
Learn more about Amplitude: Best for mobile autocapture tied to AI session review
- Free demo + 14-day free trial available
- Pricing upon request
Visit WebsiteCustomer Rating:4.6/5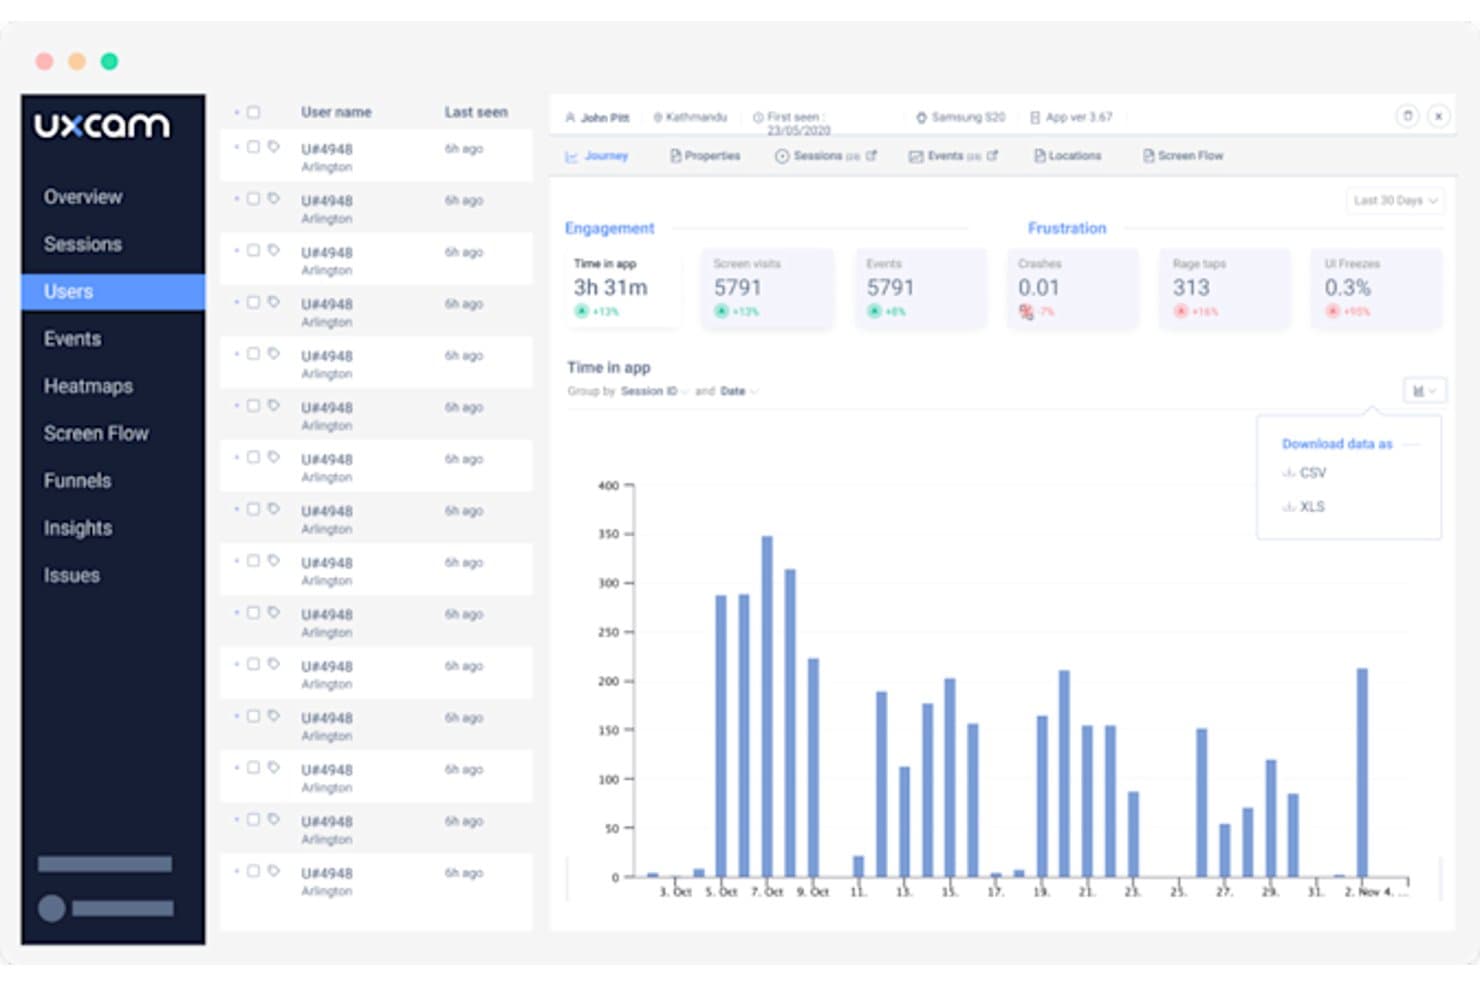
UXCam tracks individual user behavior with engagement and frustration metrics. UXCam is a user behavior analytics platform built around autocapture, session replay, mobile heatmaps, funnel analysis, and an AI analyst that automatically surfaces issues from recorded sessions.
Who Is UXCam Best For?
UXCam is a strong fit for mobile-first product teams who need gesture-level session replay and AI-assisted issue discovery without heavy instrumentation work.
Why I Picked UXCam
UXCam earns its spot on my shortlist because of how tightly it connects mobile autocapture to AI-driven session review through its Tara AI analyst. Tara watches recorded sessions automatically and surfaces the top issues, so I'm not spending hours scrubbing through footage to find where users rage-tapped or hit a UI freeze. I also love that autocapture logs every gesture and screen interaction from day one, meaning I can run retroactive funnel analysis without touching the tracking code again.
UXCam Key Features
- Frustration signal detection: Automatically flags rage taps, unresponsive gestures, and UI freezes without any manual configuration.
- Crash replay: Records the full user journey leading up to a crash, so you can see exactly what happened before an app broke.
- Multi-platform SDK support: A single SDK covers iOS, Android, React Native, Flutter, Xamarin, Cordova, and web.
- Compliance controls: Automatically blocks sensitive fields on-device, with SOC 2 Type 2, HIPAA, GDPR, CCPA, and PCI compliance built in.
UXCam Integrations
UXCam offers integrations with Salesforce, Intercom, Zendesk, Firebase Crashlytics, Slack, and Amplitude. Its SDKs support iOS, Android, React Native, Flutter, Xamarin, Cordova, and web.
Pros and Cons
Pros:
- Tara AI surfaces high-impact usability issues
- Links funnel drop-offs to session replays
- Captures gestures without manual event tagging
Cons:
- Session quotas can interrupt recording access
- Dashboards can overwhelm with excessive data
Learn more about UXCam: Best for tagless capture in regulated industries
- Free demo available
- Pricing upon request
Visit WebsiteCustomer Rating:4.7/5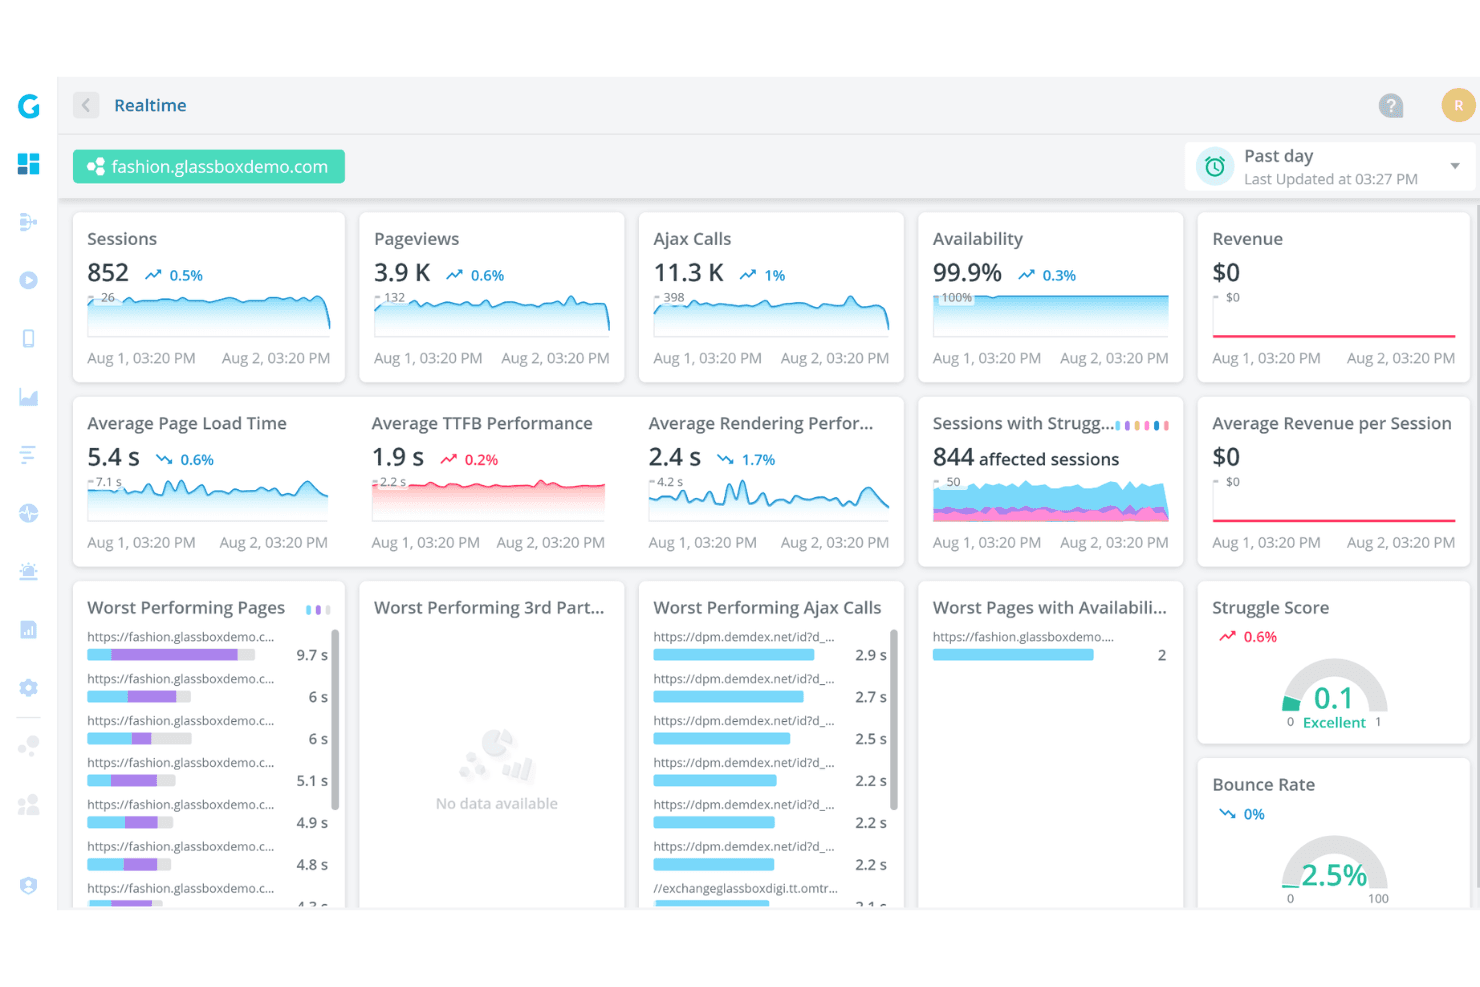
Glassbox offers a real-time analytics dashboard displaying sessions, pageviews, Ajax calls, availability, page load times, and struggle scores for a demo fashion website. Glassbox is a user behavior analytics platform that captures digital interactions automatically—without manual tagging—across web and mobile, offering session replay, funnel analysis, journey mapping, and AI-driven behavioral insights.
Who Is Glassbox Best For?
Glassbox is a strong fit for enterprise product and digital teams in regulated industries like banking, insurance, and healthcare, where data privacy and compliance requirements are non-negotiable.
Why I Picked Glassbox
Glassbox earns its spot on my shortlist because its patented tagless capture automatically records 100% of digital interactions, with no manual tagging required, which matters enormously in regulated industries where retrofitting tags onto sensitive flows is a compliance risk. I love that you can retroactively analyze past behavior using the Augmented Journey Map and Funnel Studio, even for flows you never explicitly instrumented. The built-in HIPAA, GLBA, PCI, and GDPR compliance, combined with on-premises deployment options, makes it one of the few analytics platforms I'd confidently recommend to a banking or healthcare product team.
Glassbox Key Features
- Session replay search: Find specific replays by user ID, Struggle Score, browser type, or free text values captured during any session.
- GIA (Glassbox Insights Assistant): Query sessions in plain language and get AI-generated summaries of funnels, journeys, and replays.
- Mobile crash analytics: Automatically detect and log app crashes alongside session context, including version and performance data.
- Proactive behavioral alerts: Set manual alert triggers or let Glassbox auto-detect unusual changes in behavior or performance metrics.
Glassbox Integrations
Glassbox integrates with Google Analytics, Adobe Analytics, Jira, Slack, Microsoft Teams, Firebase, Optimizely, Qualtrics, and Medallia. It also offers an open API for custom integrations.
Pros and Cons
Pros:
- Strong governance supports regulated product teams
- Funnels connect directly to session replays
- Tagless capture enables retroactive behavior analysis
Cons:
- Replay retention varies significantly by package
- Cohort and retention analysis remains underdeveloped
Learn more about Glassbox: Best for product analytics with in-app guidance
- Free plan + 30-day free trial + free demo available
- Pricing upon request
Visit WebsiteCustomer Rating:4.4/5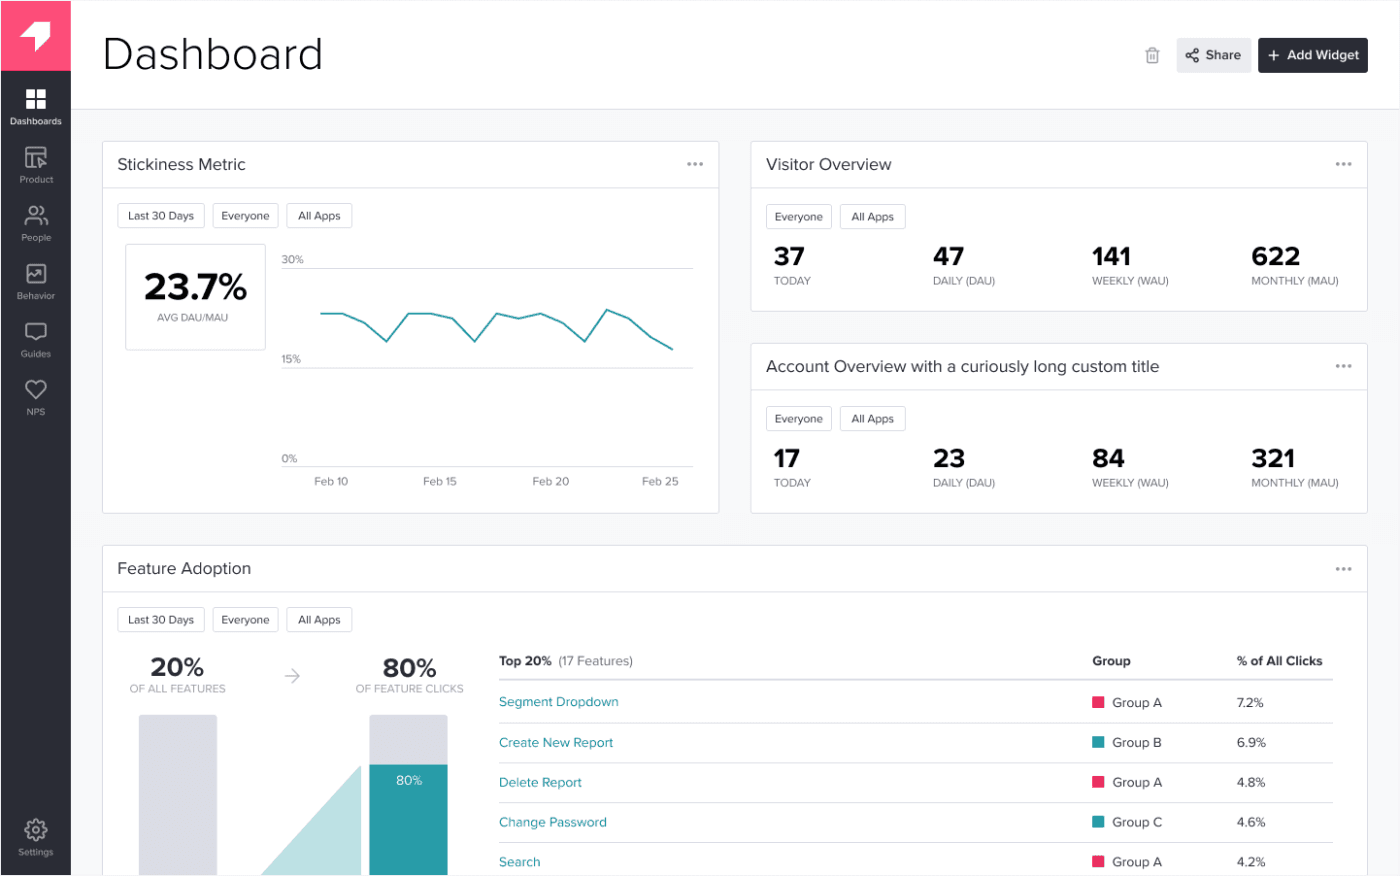
Pendo shows you how popular specific app features are. Pendo is a product analytics platform that combines auto-capture behavioral tracking, funnel and path analysis, session replay, and user segmentation with built-in in-app guidance tools.
Who Is Pendo Best For?
Pendo is a strong fit for product managers who want behavioral analytics and in-app guidance in one platform, without a heavy instrumentation lift.
Why I Picked Pendo
Pendo earns its spot on my shortlist because it combines behavioral analytics and in-app guidance in one platform, which removes the need to stitch together separate tools. I love that auto-capture starts recording interactions the moment the snippet is installed, so when I tag a feature later, its historical data is already there. Workflow Insights uses AI to flag where users hit friction in a flow, and from any funnel drop-off I can jump straight into the matching session replays in one click.
Pendo Key Features
- Product Engagement Score (PES): A composite metric that combines adoption, stickiness, and growth data into a single score for tracking overall product health.
- Session replay with frustration signals: Records real user sessions and automatically flags rage clicks and U-turns to surface where users struggle.
- Leo AI assistant: A chat interface that lets you query live product data in plain language to surface retention, adoption, and usage insights.
- User segmentation: Lets you build segments that combine in-app behavioral data with CRM or third-party data for targeted analysis and in-app guide delivery.
Pendo Integrations
Pendo lists 85+ integrations across CRM, marketing, support, and collaboration tools, including Salesforce and Zendesk. It also connects with GitHub and Slack through Novus and offers the Pendo MCP Server for custom AI access to live data.
Pros and Cons
Pros:
- Behavioral segments power in-app guidance
- Funnels link drop-offs to session replays
- Auto-capture preserves historical interaction data
Cons:
- Replay history defaults to 30 days
- No confirmed native heatmaps
Learn more about Pendo: Best for no-code visual event tracking
- Free plan available
- Pricing upon request
Visit WebsiteCustomer Rating:4.3/5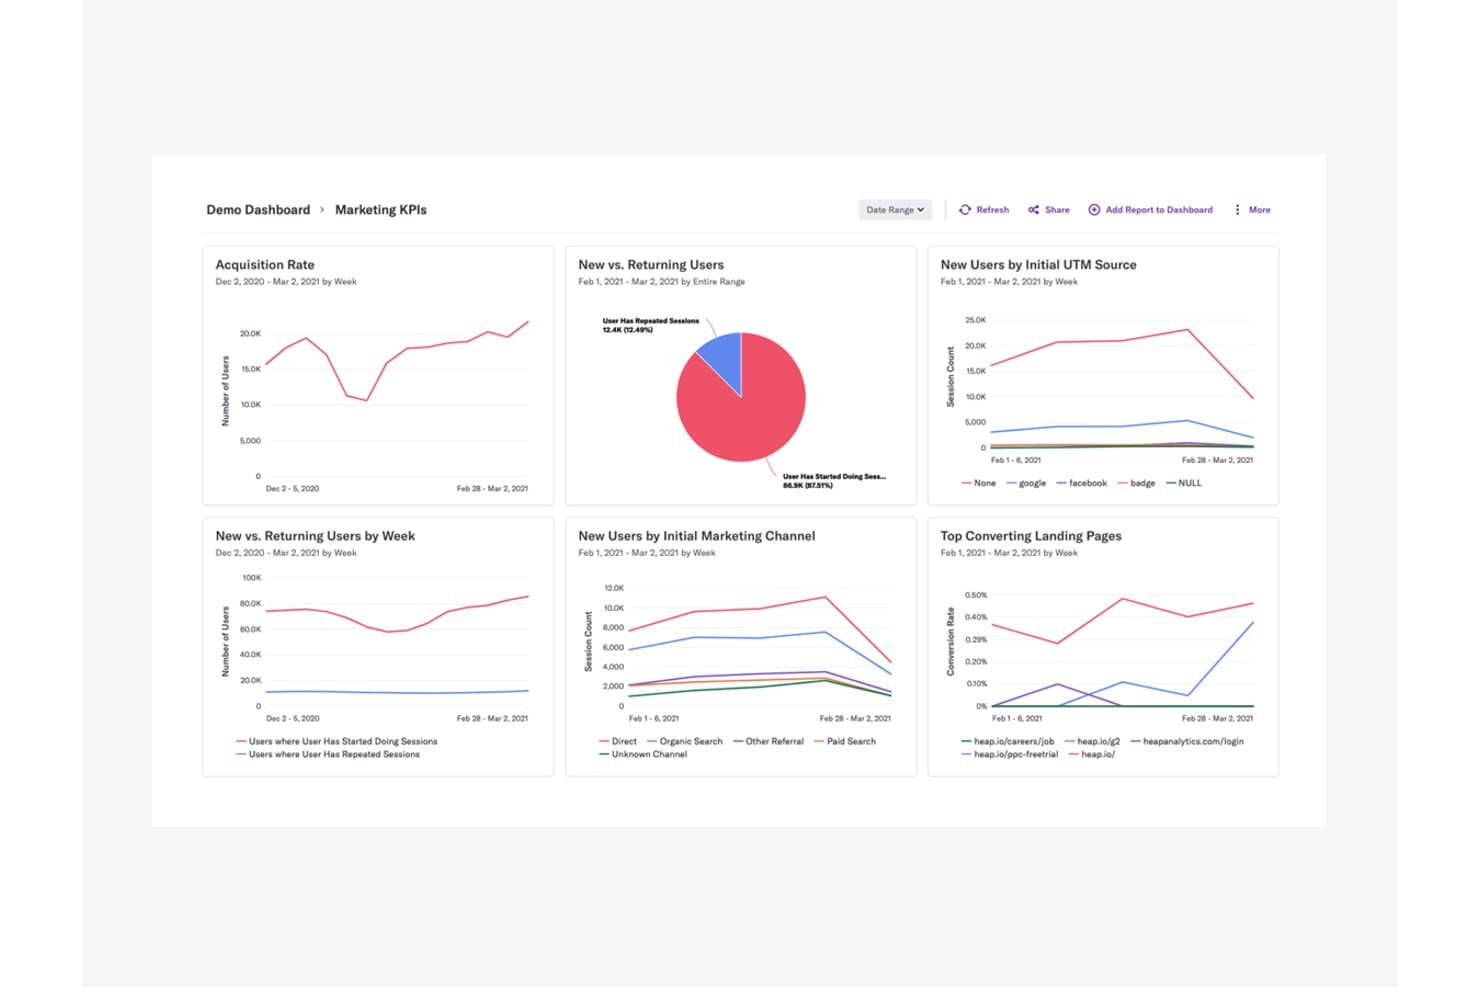
Heap centralizes marketing KPIs to reveal user acquisition and behavior trends. Heap by Contentsquare is a user behavior analytics platform that automatically captures clicks, taps, form fills, and screen views across web and mobile—without manual event tagging—and surfaces that data through funnels, journey maps, session replay, heatmaps, and retention reports.
Who Is Heap Best For?
Heap is a strong fit for product teams that want deep behavioral data without relying on engineers to manually tag every event.
Why I Picked Heap
Heap earns its spot on my shortlist because no-code visual event tracking is genuinely where it shines. Instead of waiting on engineers to tag events, I can use Visual Event Labeling to define what I want to track directly in the interface, and Autocapture has already logged the data retroactively. That means I can go back and analyze a user flow from three months ago even if I hadn't thought to track it then. The ability to jump from a funnel drop-off point straight into a linked session replay makes diagnosing friction fast and concrete.
Heap Key Features
- Retroactive event analysis: Because Autocapture logs all interactions from the moment you install, you can define and analyze events from historical data without re-instrumenting anything.
- Sense AI assistant: Heap's built-in AI tool lets you query behavioral data, surface summaries, and follow up on findings using natural language, available from the Growth plan up.
- Heap Connect warehouse sync: This add-on automatically syncs your Heap data, including behavioral segments, to a data warehouse like Snowflake for deeper analysis outside the platform.
- Report alerts: Available on Pro and above, this feature notifies you when a key metric crosses a threshold, so you catch meaningful changes in user behavior without manually checking dashboards.
Heap Integrations
Heap offers dozens of documented integrations, including Snowflake, Salesforce, Intercom, Shopify, Marketo, Iterable, AWS, and WalkMe. Its APIs support custom event integrations, while Heap Connect syncs behavioral data and segments with Snowflake.
Pros and Cons
Pros:
- Visual labeling reduces engineering tagging work
- Links funnel drop-offs directly to replays
- Captures interactions automatically for retroactive analysis
Cons:
- Short history limits long-term cohort comparisons
- Captured data can overwhelm analysis
Learn more about Heap (by Contentsquare): Best for linking replays to funnel drop-off analysis
- Free plan available
- Pricing upon request
Visit WebsiteCustomer Rating:4.5/5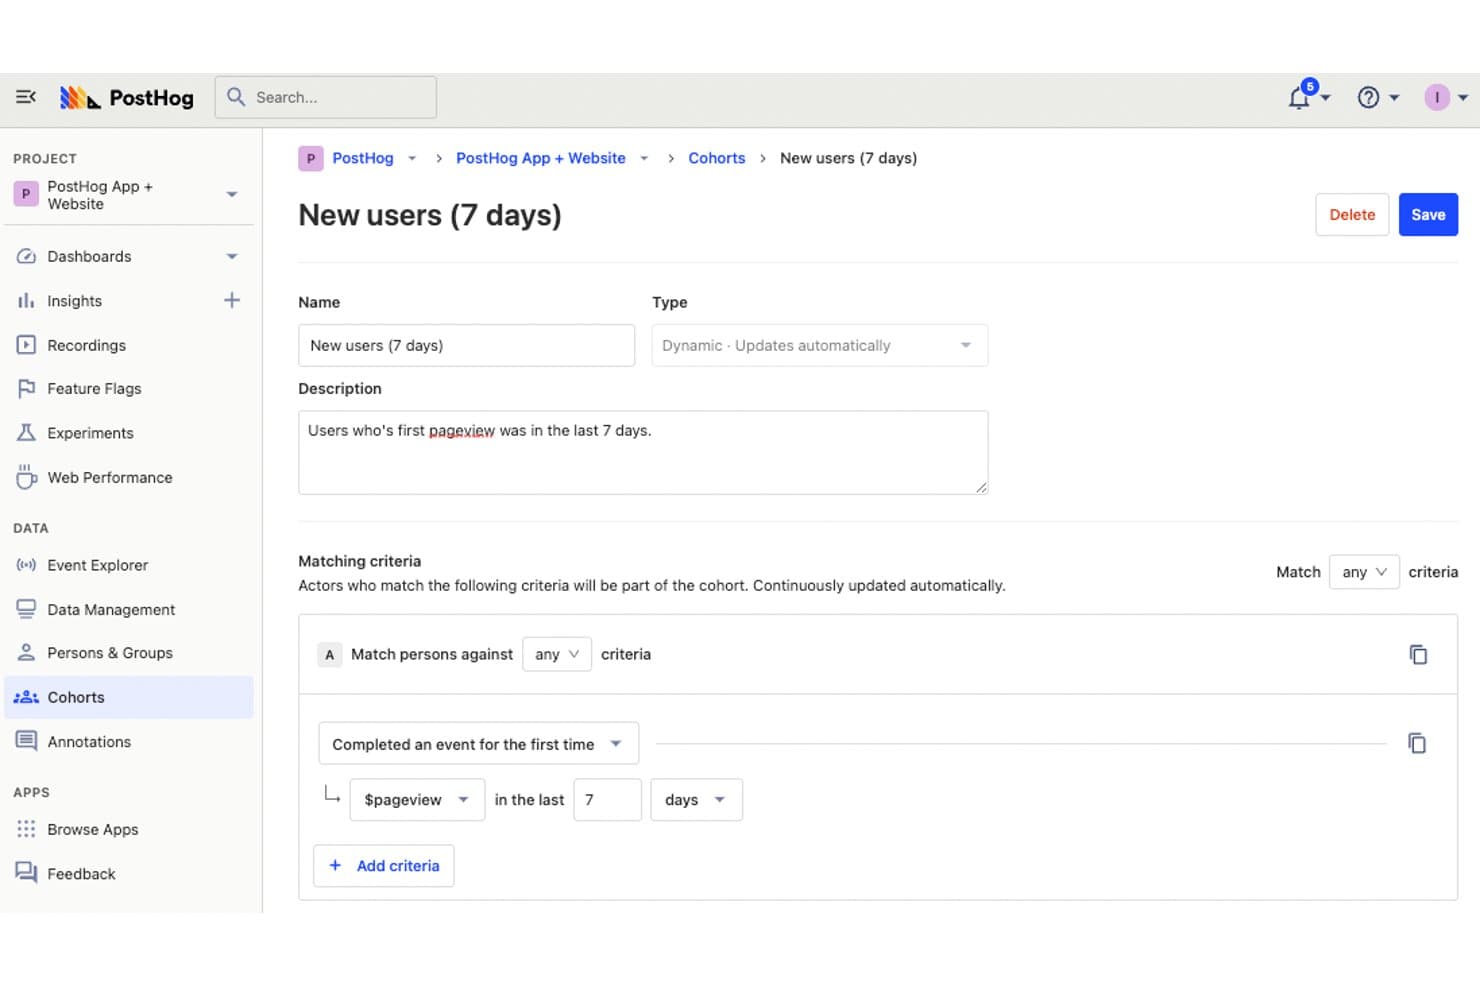
PostHog lets users define dynamic cohorts to track new users. PostHog is an open-source product analytics platform that combines behavioral event tracking, funnel analysis, session replay, heatmaps, and feature flag management in a single, unified toolset.
Who Is PostHog Best For?
PostHog is a strong fit for product teams and data analysts who want behavioral analytics, session replay, and feature flag management in one place without stitching together separate tools.
Why I Picked PostHog
PostHog earns its spot on my shortlist because of how tightly it connects funnel drop-off data to session replay. When I see a conversion dip at a specific funnel step, I can click straight through to the recordings of users who dropped off at exactly that point—no exporting, no manual filtering. Correlation analysis also automatically surfaces which user properties or behaviors are linked to those drop-offs, so I'm not guessing at causes.
PostHog Key Features
- Autocapture: Automatically records clicks, pageviews, and form submissions without requiring manual event instrumentation.
- Correlation analysis: Automatically identifies user properties and behaviors statistically linked to conversion or drop-off in your funnels.
- Feature flag integration: Lets you filter session replays by which feature flags were active during a session, including experiment group playlists.
- SQL editor: Allows you to write custom queries directly against your product data for analyst-level exploration beyond preset reports.
PostHog Integrations
PostHog supports MCP connections with Claude, Cursor, and VS Code, plus Terraform support for managing dashboards and insights as code. Its Data Warehouse syncs external data into PostHog, while Data Pipelines sends data to outside destinations.
Pros and Cons
Pros:
- Combines replay, heatmaps, and feature flags
- Correlates conversion changes with user behavior
- Links funnel drop-offs to session replays
Cons:
- Replay retention limits long-term behavior analysis
- Technical interface challenges nontechnical product teams
Learn more about PostHog: Best for unified replay, heatmap and product analytics
- Free plan + free demo + 15-day free trial available
- From $39/month (billed annually)
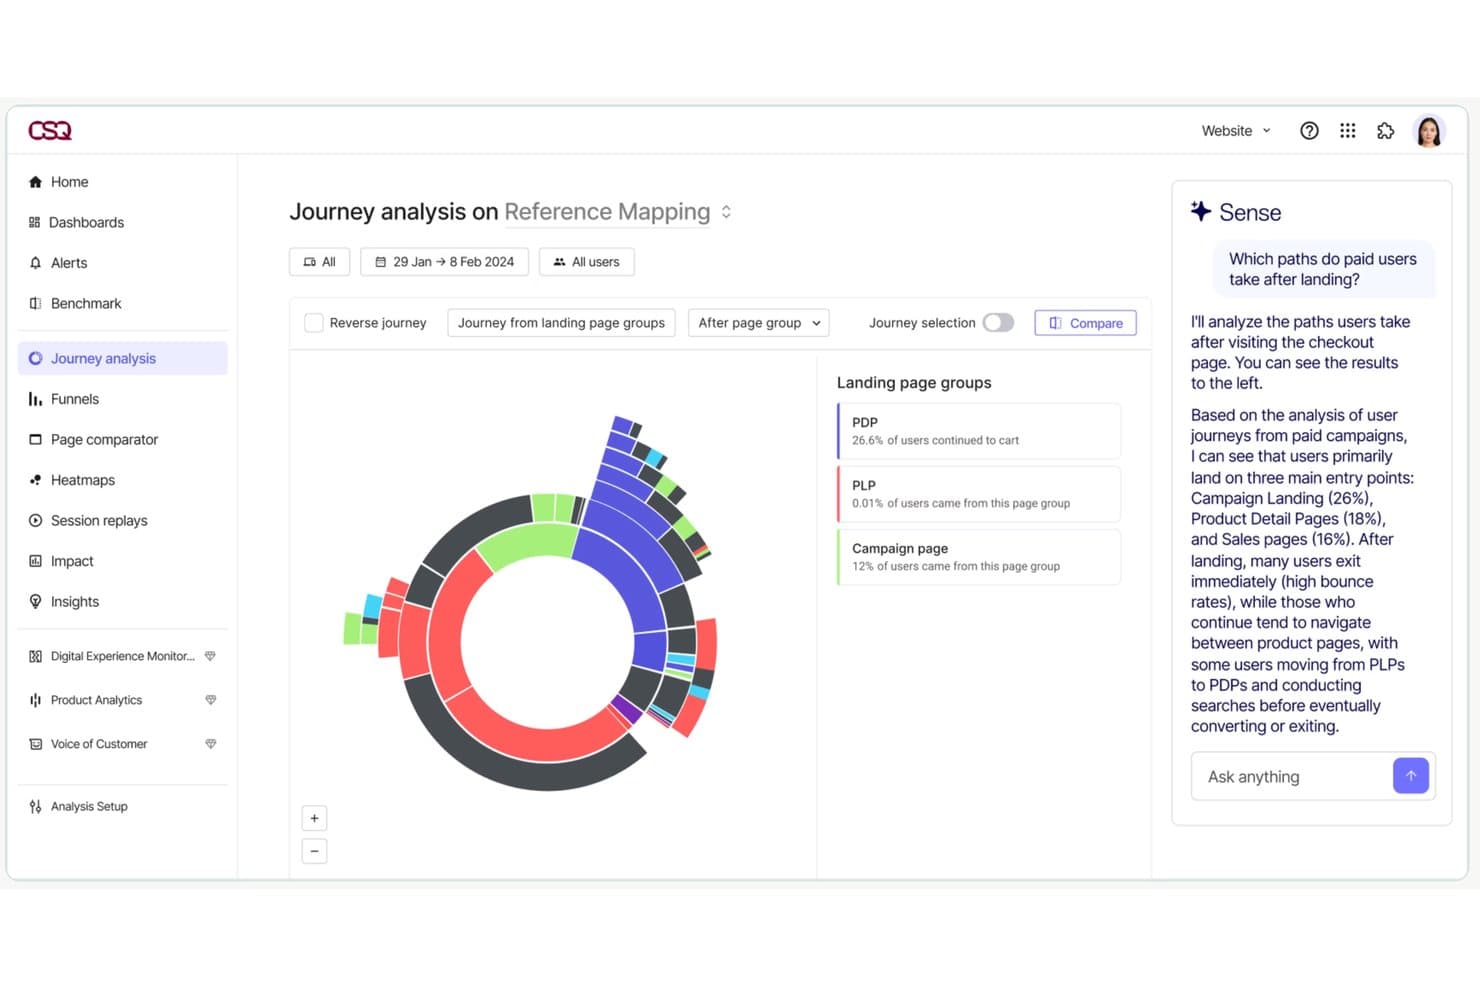
Contentsquare's Journey Analysis maps user paths with AI-driven insights. Contentsquare is a user behavior analytics platform that unifies session replay, heatmaps, funnel analysis, journey mapping, and product analytics under one roof, with AI-powered querying and automatic event capture across web, mobile, and desktop.
Who Is Contentsquare Best For?
Contentsquare is a strong fit for product and UX teams that need session replay, heatmaps, and product analytics in one place rather than stitching together separate tools.
Why I Picked Contentsquare
Contentsquare earns its spot on my shortlist because it pulls session replay, heatmaps, and product analytics into a single platform, which means I'm not jumping between Hotjar and Heap to connect UX friction to feature adoption data. I especially like Smart Capture, which records all user interactions automatically so I can go back and analyze behavior I never thought to track. Sense AI then lets me query that data in plain language and link friction signals directly to revenue impact.
Contentsquare Key Features
- Frustration signal detection: Automatically identifies rage clicks, dead zones, and error clicks within session replays to surface where users struggle.
- Impact quantification: Estimates the revenue and conversion effect of specific UX friction points, available from the Growth plan upward.
- Cross-device identity resolution: Connects anonymous sessions to logged-in user profiles across web, mobile, and desktop for a complete behavioral picture.
- Error and performance monitoring: Tracks JavaScript, API, and network errors alongside real-user performance data, included on every plan.
Contentsquare Integrations
Contentsquare offers 115+ integrations, including Google Analytics, Adobe Analytics, Jira, Slack, Microsoft Teams, HubSpot, and Optimizely. Pro and Enterprise plans include API and export capabilities, while Enterprise adds Data Connect for warehouse exports; Voice of Customer also integrates with Zapier.
Pros and Cons
Pros:
- Unifies journeys across web, mobile, desktop
- Connects replay friction to revenue impact
- Automatically captures interactions for retrospective analysis
Cons:
- Product Analytics remains a separate application
- Replay limits can restrict historical investigation
Learn more about Contentsquare:
Diğer Kullanıcı Davranışı Analitiği Araçları
Kısa listeme giremeyen ancak yine de göz atmaya değer bazı ek kullanıcı davranışı analitiği aracı seçenekleri şunlardır:
- 11LogRocketBest for frontend monitoring and product analytics
- 12StatsigBest for release impact tied to behavior analytics
- 13UserpilotBest for analytics tied to in-app fixes
- 14CleverTapBest for mobile app engagement analytics
- 15MouseflowBest for automatic friction score tracking
- 16SplunkBest for behavior data tied to backend traces
- 17Zoho PagesenseBest for visual insights with heatmaps
- 18AcousticBest for behavior analytics tied to lifecycle marketing
- 19Datadog Real User MonitoringBest for behavior data tied to observability traces
How I Evaluate User Behavior Analytics Tools
My evaluation splits into three parts: core functionality first, which carries the most weight—I look for tools that capture granular user interactions and map multi-step user journeys. Then I consider standout features like session replay linkage or no-code visual tagging. Finally, I check pricing transparency and onboarding support.
Core Functionality (Table Stakes For This List)
When I'm selecting tools for my list, I score each one on a scale from 0 (does not offer the functionality) to 5 (excels in this area) for each core functionality listed below. I then convert the total into a percentage to help assess each tool's overall fit, with extra weight on any functionalities I've deemed essential.
- Behavioral Event Tracking (Essential): I check whether the tool auto-captures clicks, scrolls, and page views with session-level context or requires manual tagging for every interaction.
- Funnel and Flow Analysis (Essential): I look for flexible, multi-step funnels that surface unexpected drop-off points, not just rigid linear sequences you have to predefine.
- Session Replay or Heatmaps: Searchable, filterable replays matter most here. I evaluate how quickly I can isolate rage clicks or dead-end sessions from thousands of recordings.
- User Segmentation: Tools like Amplitude and Mixpanel let you layer behavioral and attribute-based segments across reports. I look for that kind of reusability.
- Retention and Cohort Analysis: I evaluate whether the tool supports custom retention definitions so you can compare cohorts by signup week, first feature used, or plan tier.
- Cross-Platform Data Capture: I check how well the tool unifies web and mobile data under a single user identity, especially across anonymous-to-authenticated transitions.
Once I have a list of tools that meet the criteria, I consider what sets each platform apart.
Differentiating Factors (What Sets Vendors Apart)
Here's how I compare and contrast different vendors:
Standout Features
Session replay linkage is the feature I evaluate most closely. When a funnel shows a 40% drop-off at checkout, I want to jump straight from that data point into filtered recordings of users who abandoned. Tools like Hotjar and FullStory handle this differently, and the speed of that quantitative-to-qualitative pivot matters. I also check for no-code visual tagging, since product managers shouldn't need an engineering sprint just to track a new button click. AI-powered anomaly detection rounds things out by flagging unexpected behavioral shifts before anyone builds a manual report.
Beyond Features
I evaluate how quickly a team can go from SDK install to usable dashboards. Tools like Amplitude and Pendo offer pre-built templates for onboarding funnels and feature adoption, which shaves days off setup for product managers who don't write SQL. Pricing model matters just as much—event-based billing can spike unpredictably during a launch week, so I check whether vendors offer grace periods or committed-volume discounts before costs spiral. I also look at cross-functional usability, specifically whether shared dashboards and role-based permissions let designers and engineers self-serve without admin bottleneck.
Kullanıcı Davranışı Analitiği Aracı Nasıl Seçilir?
Uzun özellik listeleri ve karmaşık fiyatlandırma yapıları arasında kaybolmak kolaydır. Size özgü yazılım seçim sürecinizi yürütürken odağınızı korumanıza yardımcı olmak için göz önünde bulundurmanız gereken faktörleri içeren bir kontrol listesi hazırladım:
| Etken | Dikkate Alınacaklar |
|---|---|
| EtkenÖlçeklenebilirlik | Dikkate AlınacaklarAraç işletmenizle birlikte büyüyebilir mi? Genişledikçe daha fazla kullanıcıyı ve veriyi işleyebilen çözümler arayın. Gelecekteki ihtiyaçlarınızı ve aracın bunları ek maliyet veya karmaşıklık olmadan karşılayıp karşılayamayacağını değerlendirin. |
| EtkenEntegrasyonlar | Dikkate AlınacaklarMevcut sistemlerinize bağlanabiliyor mu? CRM'niz, e-posta pazarlama sisteminiz ve güvendiğiniz diğer araçlarla entegre olduğundan emin olun. Manuel veri aktarımlarından kaçınmak için yerel entegrasyonları veya kolay API erişimini kontrol edin. |
| EtkenÖzelleştirilebilirlik | Dikkate Alınacaklarİş akışlarınıza uyacak şekilde özelleştirebilir misiniz? Özel gösterge tablolarına ve raporlara izin veren seçenekleri arayın. Sizi belirli bir çalışma biçimine zorlayan katı sistemlerden kaçının. |
| EtkenKullanım kolaylığı | Dikkate AlınacaklarEkibiniz için kullanıcı dostu mu? Arayüzü ve gezinmeyi test edin. Öğrenme eğrisinin dik olması benimsenmeyi yavaşlatabilir. Çok az eğitim gerektiren sezgisel tasarımlar arayın. |
| EtkenUygulama ve kullanıma alma | Dikkate AlınacaklarNe kadar hızlı çalışmaya başlayabilirsiniz? Aracı uygulamak için gereken zamanı ve kaynakları değerlendirin. Kullanıma alma aşamasında rehberli kurulumlar, eğitimler ve destek sunan platformları arayın. |
| EtkenMaliyet | Dikkate AlınacaklarFiyatlandırma bütçenize nasıl uyuyor? Kurulum ücretleri ve abonelik tarifeleri de dahil olmak üzere toplam sahip olma maliyetini karşılaştırın. Gizli ücretlere karşı dikkatli olun ve fiyatlandırma yapılarında şeffaflık olduğundan emin olun. |
| EtkenGüvenlik önlemleri | Dikkate AlınacaklarVerileriniz ve kullanıcı bilgileriniz korunuyor mu? Şifrelemeyi, veri koruma düzenlemelerine uyumu ve denetim izlerini kontrol edin. Olası güvenlik ihlallerinden kaçınmak için sağlayıcının güvenliğe öncelik verdiğinden emin olun. |
| EtkenDestek erişilebilirliği | Dikkate AlınacaklarHangi destek seçenekleri mevcut? Sohbet, e-posta veya telefon gibi birden fazla kanal aracılığıyla zamanında yardım alabildiğinizden emin olun. Sorunlar ortaya çıktığında sağlayıcı desteğinin kalitesini ve yanıt verme hızını değerlendirin. |
Kullanıcı Davranışı Analitiği Araçları Nedir?
Kullanıcı davranışı analitiği araçları, insanların web siteniz veya uygulamanızla nasıl etkileşim kurduğunu izleyen ve analiz eden yazılımlardır. Pazarlamacılar, ürün yöneticileri ve UX tasarımcıları bu araçları kullanıcıların ne yaptığını anlamak, eğilimleri tespit etmek ve insanların takıldığı veya ayrıldığı yerleri bulmak için kullanır. Gerçek kullanıcı eylemlerini görerek UX denetimleri ve deneyimi iyileştirmeye ve etkileşimi artırmaya yönelik diğer çalışmalarda daha bilinçli kararlar alabilirsiniz.
Özellikler
Kullanıcı davranışı analitiği araçlarını seçerken aşağıdaki temel özelliklere dikkat edin:
- Oturum tekrarları: Kullanıcı yolculuğunu anlamak ve iyileştirilmesi gereken alanları belirlemek için platformunuzdaki kullanıcı etkileşimlerini kaydedin ve inceleyin.
- Isı haritaları: Etkileşimi ölçmek ve tasarımı optimize etmek için kullanıcıların sitenizde nerelere tıkladığını, kaydırdığını ve fareyi nerelerde beklettiğini görselleştirin.
- Dönüşüm hunisi analizi: Terk noktalarını belirlemek ve dönüşüm oranlarını iyileştirmek için kullanıcıların sitenizdeki yollarını izleyin.
- Kohort analizi: Elde tutma ve etkileşim eğilimlerini anlamak için kullanıcıları zaman içindeki davranışlarına göre gruplara ayırın.
- A/B testi: Kullanıcı deneyimlerini optimize etmek ve sonuçları iyileştirmek için farklı stratejileri deneyin.
- Özelleştirilebilir gösterge tabloları: Önemli metriklere hızlı erişim sağlayacak şekilde veri görselleştirmeyi özel ihtiyaçlarınıza göre uyarlayın.
- Gerçek zamanlı analitik: Zamanında kararlar almak ve gerçekleştiği anda kullanıcı davranışlarına yanıt vermek için anında içgörülere erişin.
- Otomatik segmentasyon: Daha hedefli pazarlama ve etkileşim çalışmaları için kullanıcıları gerçekleştirdikleri eylemlere göre kategorilere ayırın.
- Hata çözümleme: Memnuniyeti korumak ve müşteri kaybını azaltmak için kullanıcı deneyimindeki sorunları hızla teşhis edip düzeltin.
- Farklı cihazlar arası izleme: Davranışlarına ilişkin kapsamlı bir görünüm elde etmek için kullanıcı etkileşimlerini birden fazla cihazda izleyin.
Avantajlar
Kullanıcı davranışı analitiği araçlarını uygulamak ekibiniz ve işletmeniz için çeşitli avantajlar sağlar. Yararlanabileceğiniz avantajlardan bazıları şunlardır:
- Geliştirilmiş kullanıcı etkileşimi: Isı haritalarını ve oturum tekrarlarını analiz ederek kullanıcı etkileşimlerini daha iyi anlayabilir ve sitenizdeki deneyimlerini geliştirebilirsiniz.
- Artan dönüşüm oranları: Huni analizi, kullanıcıların ayrıldığı noktaları belirlemeye yardımcı olur; böylece yolları optimize edebilir ve dönüşümleri artırabilirsiniz.
- Veriye dayalı kararlar: Gerçek zamanlı analizler anında içgörüler sunarak ekibinizin hızlı ve bilinçli kararlar almasını sağlar.
- Hedefli pazarlama çalışmaları: Otomatik segmentasyon, kullanıcıları davranışlarına göre kategorilere ayırarak daha kesin ve etkili pazarlama stratejileri oluşturmanızı sağlar.
- Geliştirilmiş kullanıcı memnuniyeti: Hata çözümleme özellikleri, kullanıcı deneyimi sorunlarını hızlıca belirleyip düzeltmenize yardımcı olarak memnuniyeti ve sadakati korur.
- Kapsamlı kullanıcı içgörüleri: Cihazlar arası izleme, kullanıcı davranışlarının eksiksiz bir görünümünü sunarak kullanıcıların platformlar arasında nasıl etkileşim kurduğunu anlamanıza yardımcı olur.
- Optimize edilmiş ürün geliştirme: A/B testi, özellikler ve tasarım değişiklikleri üzerinde denemeler yapmanızı sağlayarak kullanıcı geri bildirimlerine dayalı geliştirmelere yön verir.
Maliyetler ve Fiyatlandırma
Kullanıcı davranışı analitiği araçlarını seçmek, mevcut çeşitli fiyatlandırma modellerini ve planları anlamayı gerektirir. Maliyetler özelliklere, ekip boyutuna, ek özelliklere ve daha fazlasına bağlı olarak değişir. Aşağıdaki tablo, kullanıcı davranışı analitiği aracı çözümlerinde yaygın planları, ortalama fiyatlarını ve genellikle sunulan özellikleri özetlemektedir:
Kullanıcı Davranışı Analitiği Araçları İçin Plan Karşılaştırma Tablosu
| Plan Türü | Ortalama Fiyat | Yaygın Özellikler |
|---|---|---|
| Plan TürüÜcretsiz Plan | Ortalama Fiyat$0 | Yaygın ÖzelliklerTemel oturum tekrarları, sınırlı ısı haritaları ve temel analizler. |
| Plan TürüKişisel Plan | Ortalama Fiyat$10-$30/kullanıcı/ay | Yaygın ÖzelliklerGelişmiş ısı haritaları, huni analizi, kohort analizi ve e-posta desteği. |
| Plan Türüİşletme Planı | Ortalama Fiyat$50-$150/kullanıcı/ay | Yaygın ÖzelliklerGerçek zamanlı analizler, özelleştirilebilir panolar, A/B testi ve öncelikli destek. |
| Plan TürüKurumsal Plan | Ortalama Fiyat$200+/kullanıcı/ay | Yaygın ÖzelliklerCihazlar arası izleme, gelişmiş segmentasyon, kapsamlı entegrasyonlar ve özel hesap yönetimi. |
Kullanıcı Davranışı Analitiği Araçları SSS
Kullanıcı davranışı analitiği araçları hakkında sık sorulan bazı soruların yanıtları:
Kullanıcı davranışı analitiği araçlarını kullanmak teknik uzmanlık gerektirir mi?
Hayır, birçok kullanıcı davranışı analitiği aracı, kapsamlı teknik bilgi gerektirmeyen kullanıcı dostu arayüzlerle tasarlanmıştır. Ancak bazı gelişmiş özellikler bir miktar teknik bilgi gerektirebilir. Ekibinizin beceri düzeyine uygun ve yeterli destek ya da eğitim kaynakları sunan bir araç seçmek iyi bir fikirdir.
Kullanıcı davranışı analitiği araçlarının kullanımı güvenli midir?
Evet, saygın kullanıcı davranışı analitiği araçları güvenlik ve veri korumasına öncelik verir. Bu araçlar genellikle bilgilerinizi korumak için şifreleme, veri koruma düzenlemelerine uyumluluk ve diğer güvenlik önlemlerini sunar. Bir aracın güvenlik özelliklerini ve gizlilik politikalarını her zaman inceleyerek kuruluşunuzun standartlarını karşıladığından emin olun.
Kullanıcı davranışı analitiği araçlarının ROI'sini nasıl ölçersiniz?
ROI’yi ölçmek için dönüşümleri artırmak veya kayıp oranını azaltmak gibi net performans hedefleri belirleyerek başlayın. Kararlarınızın bu sonuçları nasıl etkilediğini görmek için aracı kullanmadan önceki ve sonraki metrikleri takip edin. Elde edilen ticari kazanımlar ile zaman veya kaynak yatırımınız arasındaki fark, ROI’yi net bir şekilde görmenizi sağlar.
Kullanıcı davranışı analitiği araçlarını benimserken karşılaşılan yaygın zorluklar nelerdir?
Ekipler genellikle veri doğruluğu, tutarlılığı ve içgörüleri gerçek ticari sonuçlarla uyumlu hâle getirme konularında sorunlarla karşılaşır. Net hedefler olmadan anlamlı eylemlere yol açmayan veriler toplayabilirsiniz. Ekiplerin, verilerin zaman içinde güncelliğini korumak için gereken çabayı hafife alması da yaygındır.
Kullanıcı davranışı analitiği araçları kullanıcıyı elde tutma stratejilerinin geliştirilmesine nasıl yardımcı olur?
Bu araçlar, kullanıcıların zaman içinde ürününüzle nasıl etkileşim kurduğunu ortaya çıkararak ilgilerini kaybettikleri veya etkileşimi bıraktıkları noktaları belirlemenize yardımcı olur. Bu davranışları anlayarak sürekli kullanımı teşvik etmek için başlangıç sürecini, içeriği veya iletişimi düzenleyebilirsiniz. İçgörüler etkileşim stratejilerine doğrudan yön verdiğinde kullanıcıyı elde tutma oranı iyileşir.