

10 Migliori Soluzioni di Analisi del Comportamento Utente del 2026

10 Migliori strumenti di analisi del comportamento utente: la shortlist
- 1. Amplitude


Con così tante soluzioni diverse per analizzare il comportamento degli utenti disponibili, capire quale fa al caso tuo può essere una sfida. Sai di voler individuare come gli utenti navigano, si impegnano e interagiscono con i vari elementi per aiutarti a prendere decisioni basate sui dati, migliorare l’esperienza utente e ottimizzare le conversioni, ma devi capire quale strumento sia davvero il migliore. Nessun problema: ti aiuto io! In questo articolo ti aiuterò a scegliere con facilità, sfruttando la mia esperienza personale con decine di strumenti diversi, testati con grandi team e prodotti complessi, per offrirti una lista curata dei migliori strumenti di analisi del comportamento utente.
Perché Fidarsi delle Nostre Recensioni Software
Testiamo e recensiamo software per il product management dal 2020. Come product manager sappiamo quanto sia fondamentale e difficile fare la scelta giusta in termini di software. Investiamo in una ricerca approfondita per aiutare il nostro pubblico a prendere decisioni migliori sugli acquisti di software. Abbiamo testato oltre 2.000 strumenti per diversi casi d’uso e scritto più di 1.000 recensioni approfondite.Scopri come assicuriamo la trasparenza & la nostra metodologia di recensione software.
Riepilogo migliori strumenti di analisi del comportamento utente
Questa tabella comparativa riassume i dettagli sui prezzi delle mie principali scelte di strumenti di analisi del comportamento utente per aiutarti a trovare quello più adatto al tuo budget e alle esigenze della tua azienda.
| Tool | Best For | Trial Info | Price | ||
|---|---|---|---|---|---|
| 1 | Piano gratuito disponibile | Prezzi su richiesta | Website | ||
| 2 | Ideale per la raccolta automatica dei dati da dispositivi mobili abbinata alla revisione delle sessioni tramite AI | Piano gratuito disponibile | Prezzi su richiesta | Website | |
| 3 | Ideale per l'acquisizione senza tag nei settori regolamentati | Demo gratuita disponibile | Prezzi disponibili su richiesta | Website | |
| 4 | Ideale per il monitoraggio visivo degli eventi senza codice | Piano gratuito disponibile | Prezzi su richiesta | Website | |
| 5 | Ideale per riunire la riproduzione delle sessioni, le mappe di calore e l'analisi del prodotto | Prova gratuita di 15 giorni + piano gratuito + demo gratuita disponibili | A partire da 39 $/mese (con fatturazione annuale) | Website | |
| 6 | Ideale per il monitoraggio frontend e l'analisi del prodotto | Piano gratuito disponibile | A partire da $83/mese | Website | |
| 7 | Ideale per collegare l'impatto dei rilasci all'analisi comportamentale | Piano gratuito disponibile | A partire da $150/mese | Website | |
| 8 | Ideale per report approfonditi | Piano gratuito disponibile | A partire da $120/mese (fatturato annualmente) | Website | |
| 9 | Ideale per l'analisi dei percorsi e degli attriti basata sull'IA | Demo gratuita disponibile | Prezzi su richiesta | Website | |
| 10 | Ideale per combinare dati quantitativi e qualitativi | Piano gratuito + demo gratuita disponibile | Prezzi su richiesta | Website |
Recensioni dei migliori strumenti di analisi del comportamento utente
Qui sotto trovi le mie analisi dettagliate dei migliori strumenti di analisi del comportamento utente che sono entrati nella mia shortlist. Le mie recensioni offrono una panoramica approfondita delle caratteristiche principali, dei pro e contro, delle integrazioni e dei contesti d’uso ideali di ciascuna soluzione, per aiutarti a trovare quella giusta per te.

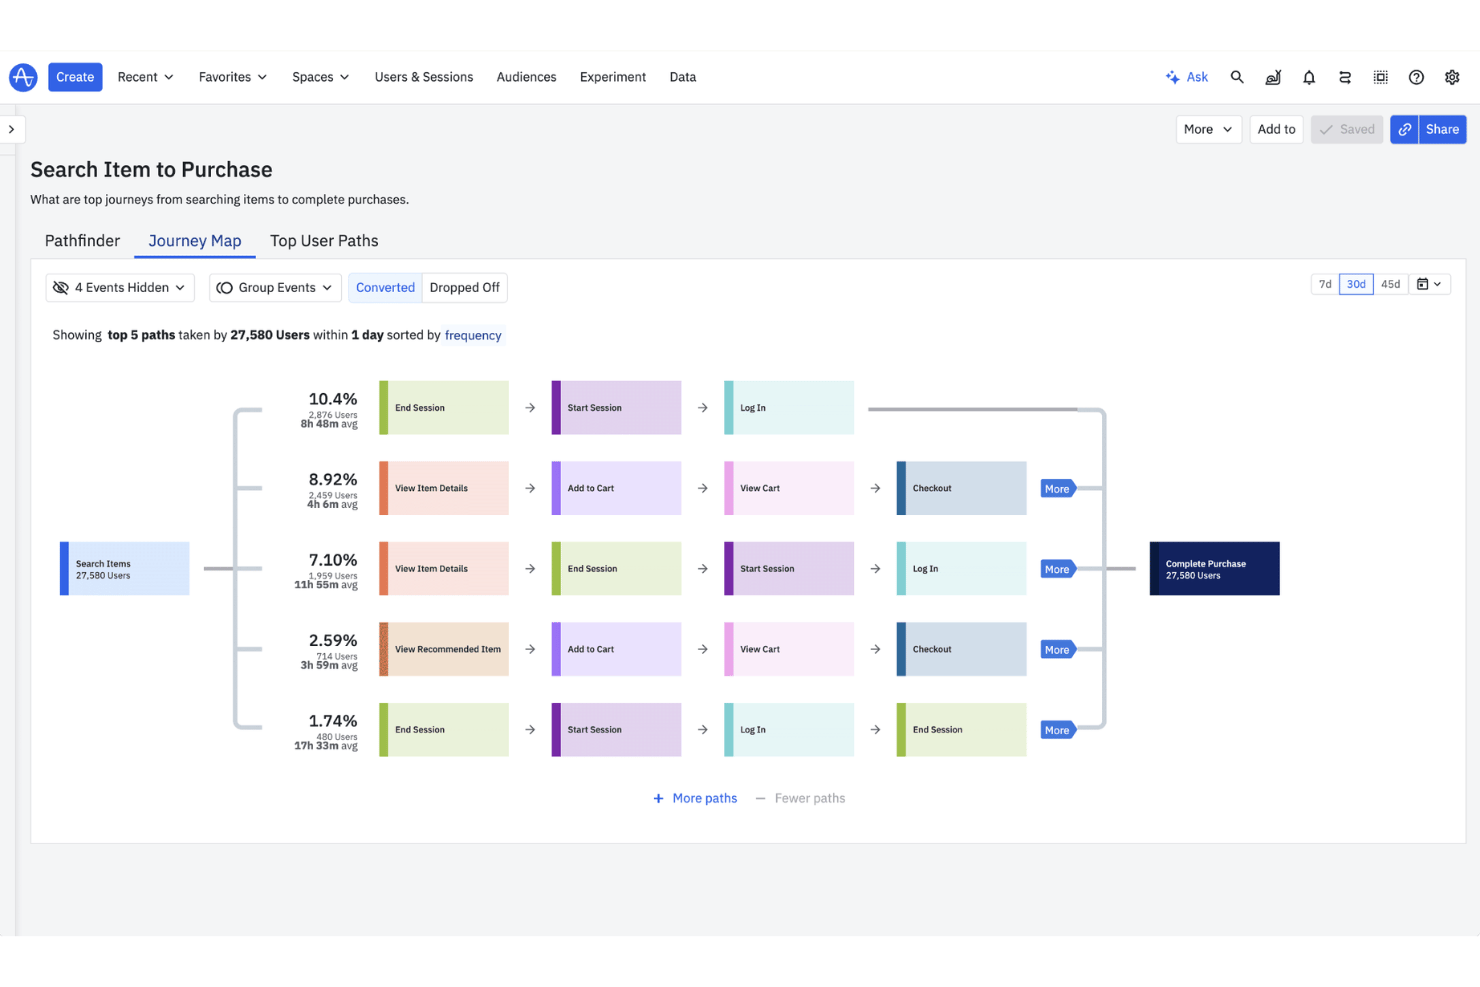
Amplitude è una piattaforma di analisi dei prodotti che combina il monitoraggio degli eventi comportamentali, l'analisi dei funnel e dei percorsi, la riproduzione delle sessioni, le mappe di calore, la segmentazione degli utenti e strumenti di sperimentazione integrati su web e dispositivi mobili.
Per chi è più adatto Amplitude?
Amplitude è particolarmente adatto ai team di prodotto che conducono esperimenti e devono ricondurre direttamente i risultati ai dati comportamentali.
Perché ho scelto Amplitude
Amplitude si è guadagnato un posto nella mia selezione perché è l'unico strumento qui presente che collega direttamente la sperimentazione ai dati comportamentali in un unico flusso di lavoro. Mi piace il fatto che si possa eseguire un esperimento su una funzionalità e poi analizzare immediatamente i risultati in base al comportamento degli utenti utilizzando funnel, percorsi e grafici di fidelizzazione, senza esportare nulla. L'etichettatura visiva consente di definire retroattivamente gli eventi sui dati reali, così il comportamento passato diventa analizzabile non appena gli si assegna un nome.
Funzionalità principali di Amplitude
- Raccolta automatica: raccoglie automaticamente clic, visualizzazioni di pagina, sessioni e interazioni con i moduli su web, iOS e Android con una configurazione minima.
- Coorti comportamentali: crea e sincronizza segmenti di utenti basati sul comportamento nel prodotto, con sincronizzazioni programmate delle coorti e accesso API nei piani Growth e superiori.
- Riproduzione delle sessioni: consente di guardare le sessioni reali degli utenti direttamente nella piattaforma di analisi, disponibile in ogni piano con fino a 50K riproduzioni al mese nel piano Enterprise.
- Feedback IA: raccoglie e presenta automaticamente il feedback degli utenti, con fino a 2.000 record al mese inclusi nella piattaforma.
Integrazioni di Amplitude
Amplitude supporta connessioni MCP a Claude, Cursor, Lovable e Figma Make, oltre a un'API per le coorti comportamentali e lo streaming in tempo reale personalizzato nei piani Growth e superiori.
Pros and Cons
Pros:
- Collega gli esperimenti sulle funzionalità ai dati comportamentali
- L'etichettatura visiva assegna un nome agli eventi senza supporto tecnico
- Combina la riproduzione delle sessioni, i funnel e l'analisi della fidelizzazione
Cons:
- L'analisi avanzata richiede competenze da analista
- I limiti di conservazione delle riproduzioni ostacolano l'analisi longitudinale delle sessioni

UXCam
Ideale per la raccolta automatica dei dati da dispositivi mobili abbinata alla revisione delle sessioni tramite AI
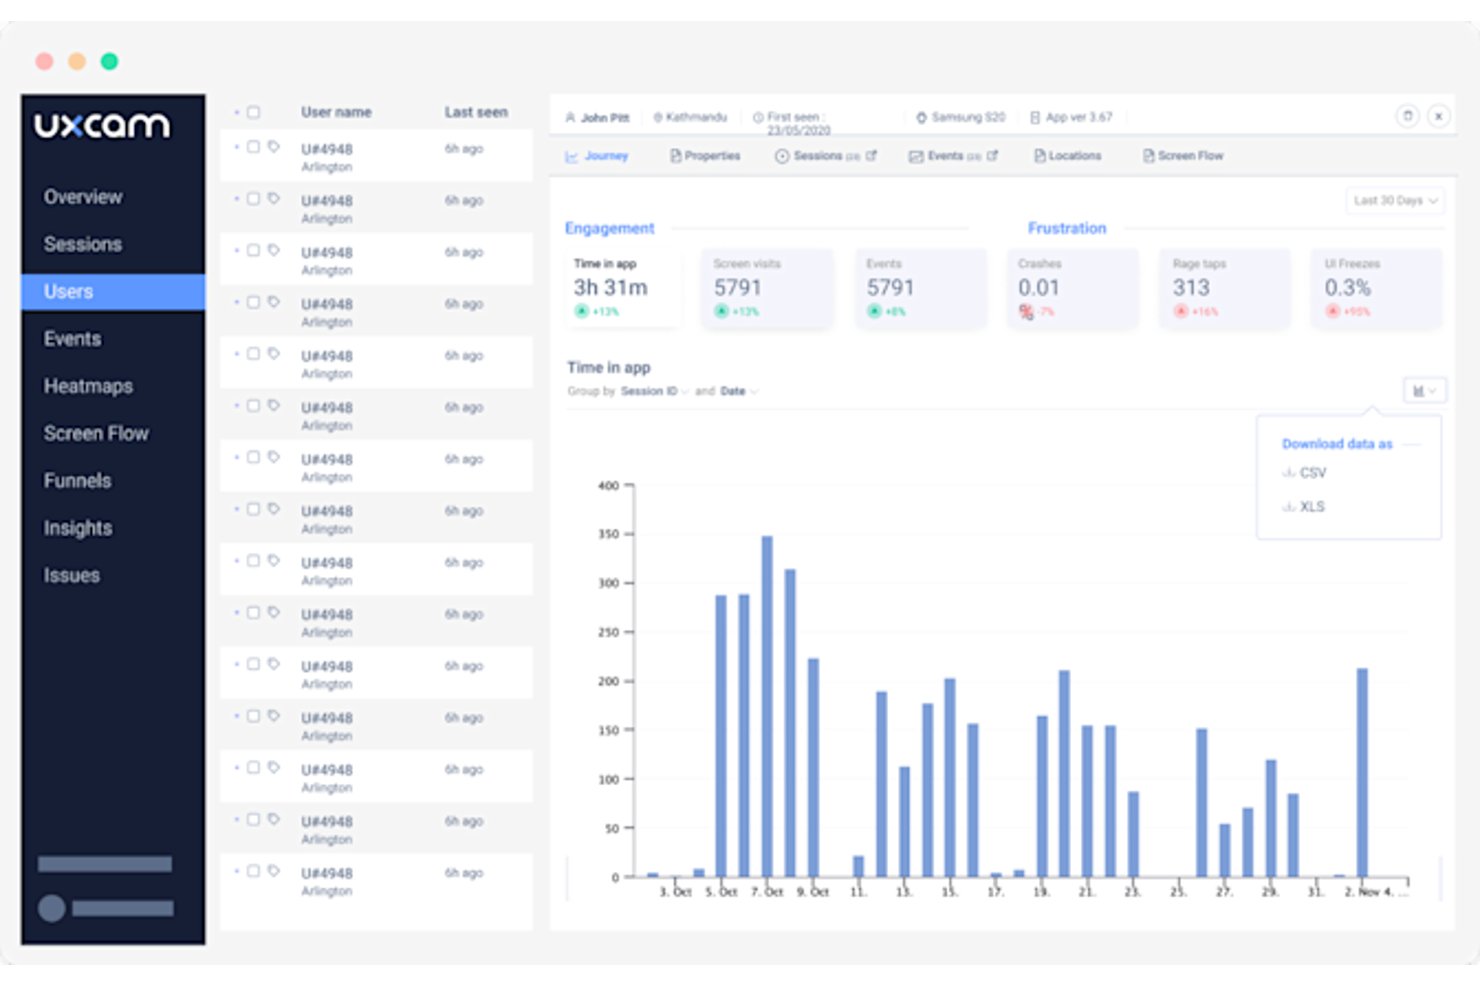
UXCam è una piattaforma di analisi del comportamento degli utenti basata sulla raccolta automatica dei dati, sulla riproduzione delle sessioni, sulle mappe di calore per dispositivi mobili, sull'analisi degli imbuti e su un analista AI che individua automaticamente i problemi dalle sessioni registrate.
Per chi è più adatta UXCam?
UXCam è particolarmente adatta ai team di prodotto orientati innanzitutto ai dispositivi mobili che hanno bisogno della riproduzione delle sessioni a livello di gesto e dell'individuazione dei problemi assistita dall'AI senza dover svolgere un'attività complessa di strumentazione.
Perché ho scelto UXCam
UXCam si è guadagnata un posto nella mia lista ristretta grazie alla stretta integrazione tra la raccolta automatica dei dati da dispositivi mobili e la revisione delle sessioni basata sull'AI tramite il suo analista AI Tara. Tara osserva automaticamente le sessioni registrate e mette in evidenza i problemi principali, così non devo passare ore a esaminare i filmati per scoprire dove gli utenti hanno effettuato tocchi ripetuti per frustrazione o hanno riscontrato un blocco dell'interfaccia. Mi piace anche il fatto che la raccolta automatica dei dati registri ogni gesto e interazione con lo schermo fin dal primo giorno, permettendomi di eseguire analisi retroattive degli imbuti senza dover modificare nuovamente il codice di monitoraggio.
Funzionalità principali di UXCam
- Rilevamento dei segnali di frustrazione: segnala automaticamente i tocchi ripetuti per frustrazione, i gesti che non ricevono risposta e i blocchi dell'interfaccia senza alcuna configurazione manuale.
- Riproduzione degli arresti anomali: registra l'intero percorso dell'utente che precede un arresto anomalo, così puoi vedere esattamente cosa è successo prima che l'app smettesse di funzionare.
- Supporto SDK multipiattaforma: un unico SDK copre iOS, Android, React Native, Flutter, Xamarin, Cordova e web.
- Controlli di conformità: blocca automaticamente i campi sensibili sul dispositivo, con conformità integrata a SOC 2 Type 2, HIPAA, GDPR, CCPA e PCI.
Integrazioni di UXCam
UXCam offre integrazioni con Salesforce, Intercom, Zendesk, Firebase Crashlytics, Slack e Amplitude. I suoi SDK supportano iOS, Android, React Native, Flutter, Xamarin, Cordova e web.
Pros and Cons
Pros:
- Registra i gesti senza dover assegnare manualmente gli eventi
- Collega gli abbandoni dell'imbuto alle riproduzioni delle sessioni
- Tara AI mette in evidenza i problemi di usabilità ad alto impatto
Cons:
- I pannelli di controllo possono risultare sovraccarichi a causa dell'eccesso di dati
- I limiti delle sessioni possono interrompere l'accesso alle registrazioni

Glassbox
Ideale per l'acquisizione senza tag nei settori regolamentati
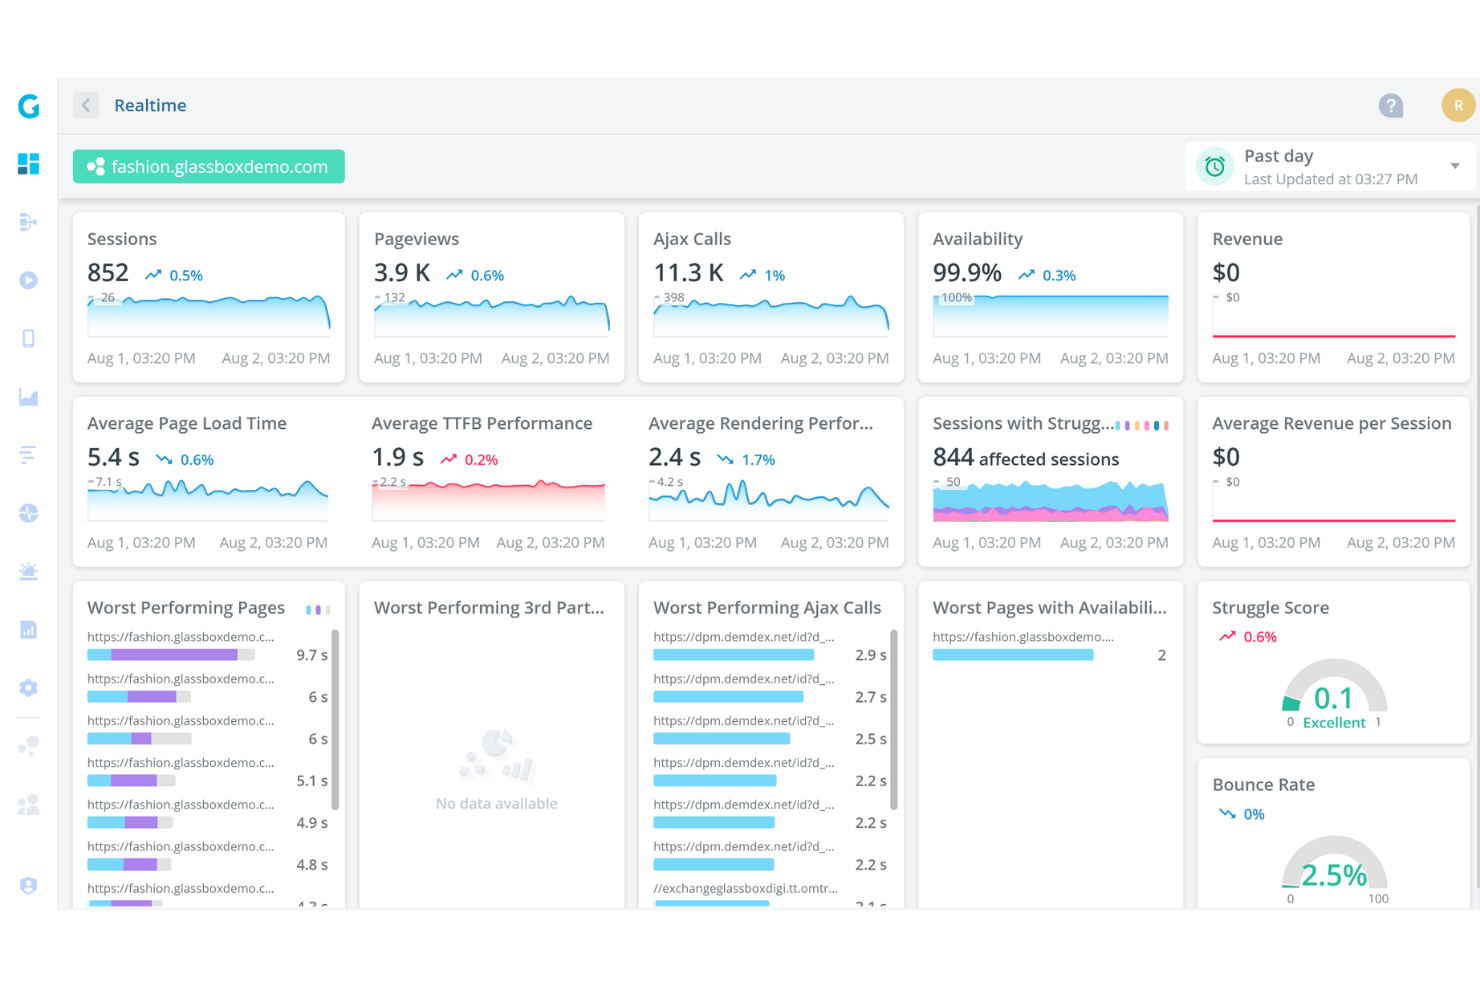
Glassbox è una piattaforma di analisi del comportamento degli utenti che acquisisce automaticamente le interazioni digitali, senza attribuzione manuale di tag, su web e dispositivi mobili, offrendo riproduzione delle sessioni, analisi dei percorsi di conversione, mappatura dei percorsi e indicazioni comportamentali basate sull'IA.
Per chi è più adatto Glassbox?
Glassbox è particolarmente indicato per i team aziendali di prodotto e digitali nei settori regolamentati, come quello bancario, assicurativo e sanitario, dove i requisiti di privacy dei dati e conformità non sono negoziabili.
Perché ho scelto Glassbox
Glassbox si è guadagnato un posto nella mia lista ristretta perché la sua acquisizione brevettata senza tag registra automaticamente il 100% delle interazioni digitali, senza richiedere attribuzione manuale di tag: un aspetto di enorme importanza nei settori regolamentati, dove l'aggiunta successiva di tag a flussi sensibili rappresenta un rischio per la conformità. Mi piace molto la possibilità di analizzare retroattivamente i comportamenti passati utilizzando Augmented Journey Map e Funnel Studio, anche per i flussi che non sono mai stati strumentati esplicitamente. La conformità integrata a HIPAA, GLBA, PCI e GDPR, insieme alle opzioni di distribuzione in sede, rende Glassbox una delle poche piattaforme di analisi che consiglierei con sicurezza a un team di prodotto bancario o sanitario.
Funzionalità principali di Glassbox
- Ricerca nelle riproduzioni delle sessioni: Trova riproduzioni specifiche per ID utente, Struggle Score, tipo di browser o valori di testo libero acquisiti durante una sessione.
- GIA (assistente per le indicazioni di Glassbox): Interroga le sessioni in linguaggio naturale e ottieni riepiloghi generati dall'IA di percorsi di conversione, percorsi e riproduzioni.
- Analisi degli arresti anomali su dispositivi mobili: Rileva e registra automaticamente gli arresti anomali delle app insieme al contesto della sessione, inclusi dati sulla versione e sulle prestazioni.
- Avvisi comportamentali proattivi: Imposta attivatori di avviso manuali oppure lascia che Glassbox rilevi automaticamente cambiamenti insoliti nel comportamento o nelle metriche delle prestazioni.
Integrazioni di Glassbox
Glassbox si integra con Google Analytics, Adobe Analytics, Jira, Slack, Microsoft Teams, Firebase, Optimizely, Qualtrics e Medallia. Offre inoltre un'API aperta per integrazioni personalizzate.
Pros and Cons
Pros:
- L'acquisizione senza tag consente l'analisi retroattiva dei comportamenti
- I percorsi di conversione si collegano direttamente alle riproduzioni delle sessioni
- Una governance solida supporta i team di prodotto dei settori regolamentati
Cons:
- L'analisi delle coorti e della fidelizzazione è ancora poco sviluppata
- La conservazione delle riproduzioni varia significativamente in base al pacchetto

Ideale per il monitoraggio visivo degli eventi senza codice
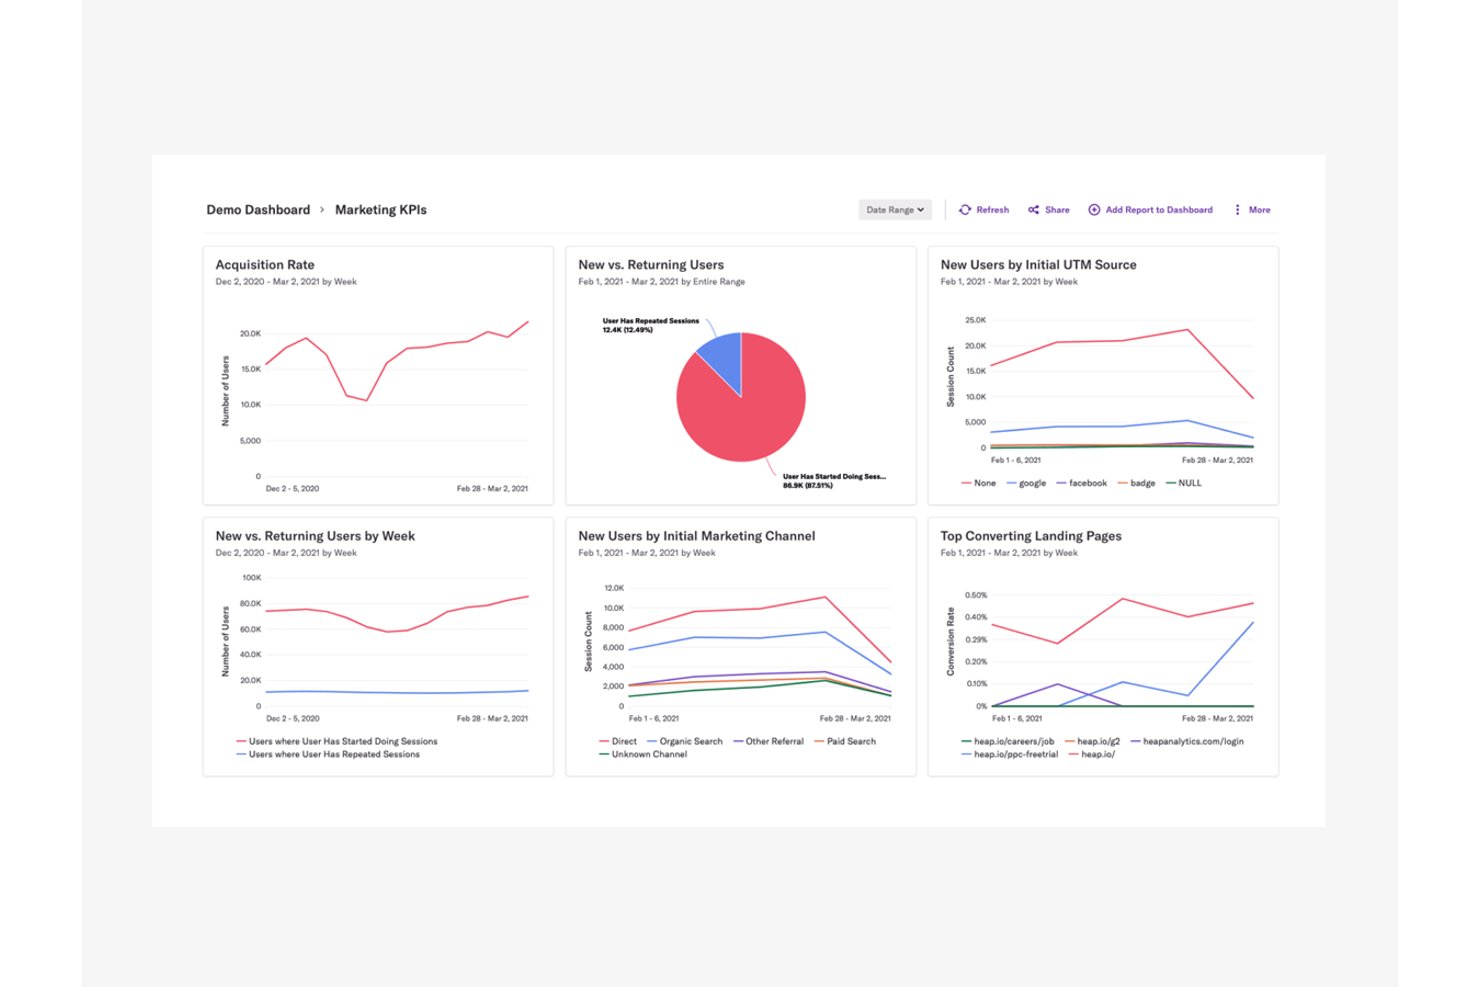
Heap di Contentsquare è una piattaforma di analisi del comportamento degli utenti che acquisisce automaticamente clic, tocchi, compilazioni di moduli e visualizzazioni delle schermate sul web e sui dispositivi mobili, senza la necessità di aggiungere manualmente tag agli eventi, e presenta questi dati tramite funnel, mappe dei percorsi, riproduzioni delle sessioni, mappe di calore e report sulla fidelizzazione.
Per chi è più adatto Heap?
Heap è particolarmente adatto ai team di prodotto che desiderano dati comportamentali approfonditi senza dover fare affidamento sugli ingegneri per aggiungere manualmente tag a ogni evento.
Perché ho scelto Heap
Heap si è guadagnato un posto nella mia lista ristretta perché il monitoraggio visivo degli eventi senza codice è davvero il suo punto di forza. Invece di aspettare che gli ingegneri aggiungano tag agli eventi, posso utilizzare Visual Event Labeling per definire ciò che desidero monitorare direttamente nell'interfaccia, mentre Autocapture ha già registrato i dati retroattivamente. Ciò significa che posso tornare indietro e analizzare un flusso utente di tre mesi fa, anche se all'epoca non avevo pensato di monitorarlo. La possibilità di passare da un punto di abbandono dell'imbuto direttamente a una riproduzione della sessione collegata rende la diagnosi degli ostacoli rapida e concreta.
Funzionalità principali di Heap
- Analisi retroattiva degli eventi: poiché Autocapture registra tutte le interazioni dal momento dell'installazione, puoi definire e analizzare gli eventi a partire dai dati storici senza dover configurare nuovamente nulla.
- Assistente AI Sense: lo strumento AI integrato di Heap consente di interrogare i dati comportamentali, generare riepiloghi e approfondire i risultati usando il linguaggio naturale, a partire dal piano Growth.
- Sincronizzazione del magazzino dati tramite Heap Connect: questo componente aggiuntivo sincronizza automaticamente i dati di Heap, inclusi i segmenti comportamentali, con un magazzino dati come Snowflake per analizzarli più approfonditamente al di fuori della piattaforma.
- Avvisi sui report: disponibile nel piano Pro e nei piani superiori, questa funzionalità ti avvisa quando una metrica chiave supera una soglia, consentendoti di rilevare cambiamenti significativi nel comportamento degli utenti senza dover controllare manualmente i cruscotti.
Integrazioni di Heap
Heap offre decine di integrazioni documentate, tra cui Snowflake, Salesforce, Intercom, Shopify, Marketo, Iterable, AWS e WalkMe. Le sue API supportano integrazioni personalizzate per gli eventi, mentre Heap Connect sincronizza i dati comportamentali e i segmenti con Snowflake.
Pros and Cons
Pros:
- Acquisisce automaticamente le interazioni per l'analisi retroattiva
- Collega direttamente gli abbandoni dell'imbuto alle riproduzioni delle sessioni
- L'etichettatura visiva riduce il lavoro degli ingegneri per l'aggiunta dei tag
Cons:
- I dati acquisiti possono sovraccaricare l'analisi
- La cronologia limitata ostacola i confronti tra coorti nel lungo periodo

Ideale per riunire la riproduzione delle sessioni, le mappe di calore e l'analisi del prodotto
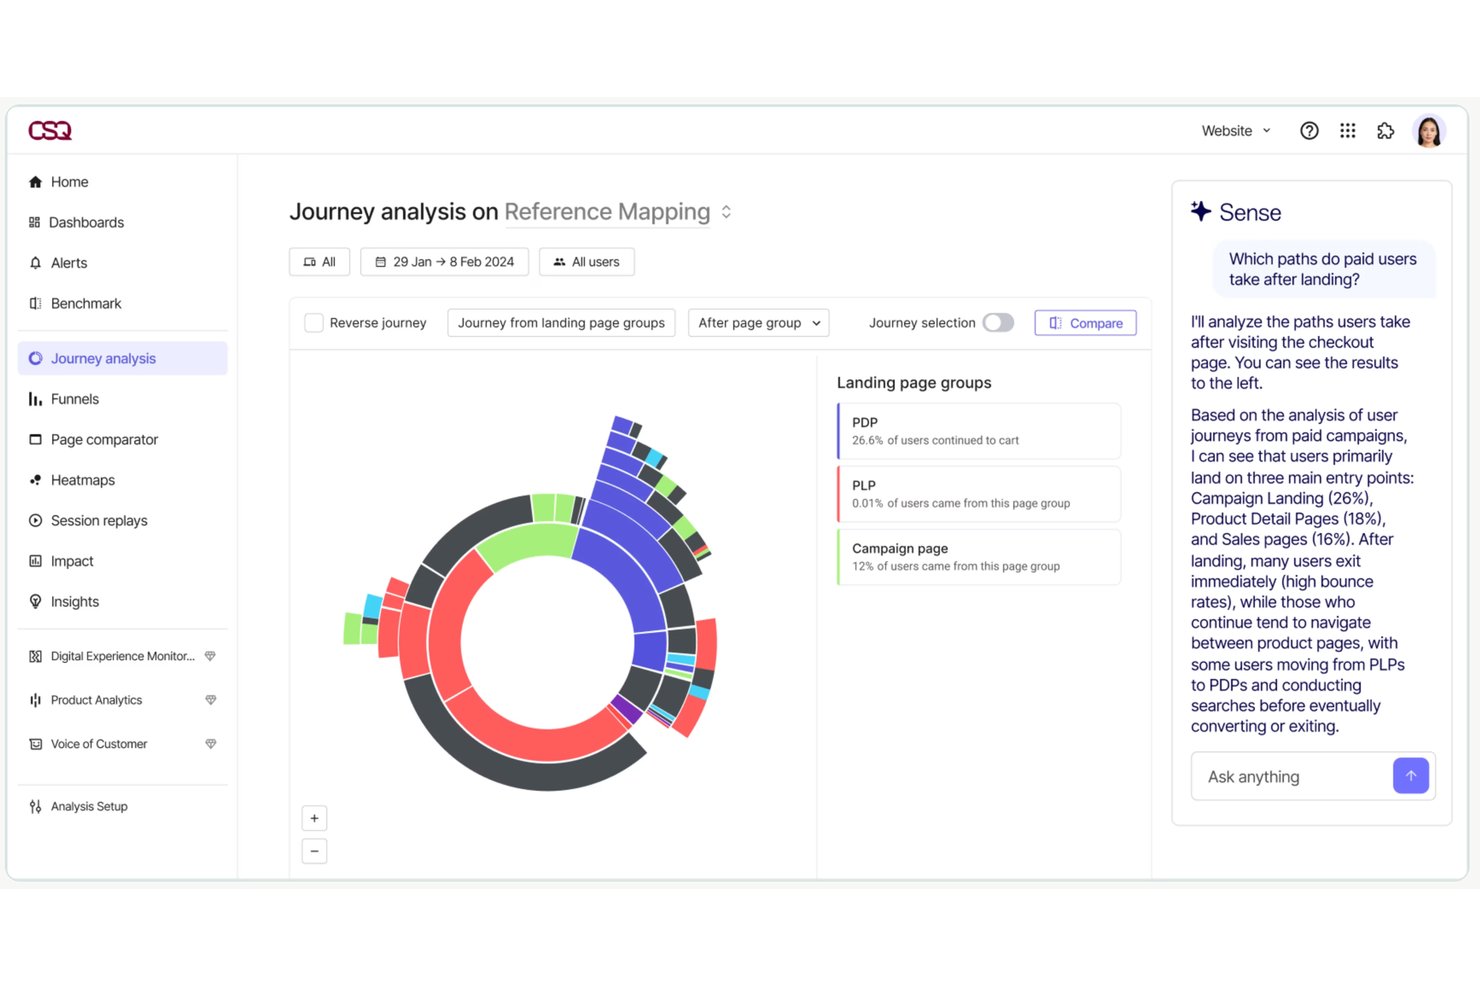
Contentsquare è una piattaforma di analisi del comportamento degli utenti che riunisce in un unico ambiente la riproduzione delle sessioni, le mappe di calore, l'analisi dei funnel, la mappatura dei percorsi e l'analisi del prodotto, con query basate sull'intelligenza artificiale e acquisizione automatica degli eventi su web, dispositivi mobili e desktop.
Per chi è più adatto Contentsquare?
Contentsquare è particolarmente adatto ai team di prodotto e UX che hanno bisogno di riproduzione delle sessioni, mappe di calore e analisi del prodotto in un unico ambiente, anziché dover combinare strumenti separati.
Perché ho scelto Contentsquare
Contentsquare si è guadagnato un posto nella mia selezione perché riunisce la riproduzione delle sessioni, le mappe di calore e l'analisi del prodotto in un'unica piattaforma. Questo significa che non devo passare da Hotjar a Heap per collegare i punti di attrito dell'esperienza utente ai dati sull'adozione delle funzionalità. Apprezzo particolarmente Smart Capture, che registra automaticamente tutte le interazioni degli utenti, permettendomi di tornare indietro e analizzare comportamenti che non avevo mai pensato di monitorare. Sense AI mi consente poi di interrogare questi dati in linguaggio naturale e collegare direttamente i segnali di attrito all'impatto sui ricavi.
Funzionalità principali di Contentsquare
- Rilevamento dei segnali di frustrazione: Identifica automaticamente i clic ripetuti, le zone inattive e i clic sugli errori nelle riproduzioni delle sessioni, per evidenziare i punti in cui gli utenti incontrano difficoltà.
- Quantificazione dell'impatto: Stima l'effetto sui ricavi e sulle conversioni di specifici punti di attrito UX, disponibile a partire dal piano Growth.
- Risoluzione dell'identità tra dispositivi: Collega le sessioni anonime ai profili degli utenti autenticati su web, dispositivi mobili e desktop, offrendo una visione completa del comportamento.
- Monitoraggio degli errori e delle prestazioni: Tiene traccia degli errori JavaScript, API e di rete insieme ai dati sulle prestazioni degli utenti reali, incluso in ogni piano.
Integrazioni di Contentsquare
Contentsquare offre oltre 115 integrazioni, tra cui Google Analytics, Adobe Analytics, Jira, Slack, Microsoft Teams, HubSpot e Optimizely. I piani Pro ed Enterprise includono funzionalità API ed esportazione, mentre il piano Enterprise aggiunge Data Connect per le esportazioni verso i data warehouse; Voice of Customer si integra inoltre con Zapier.
Pros and Cons
Pros:
- Acquisisce automaticamente le interazioni per un'analisi retrospettiva
- Collega l'attrito rilevato nella riproduzione delle sessioni all'impatto sui ricavi
- Riunisce i percorsi su web, dispositivi mobili e desktop
Cons:
- I limiti della riproduzione possono ostacolare l'analisi storica
- L'analisi del prodotto rimane un'applicazione separata


LogRocket è una piattaforma di monitoraggio frontend e analisi del prodotto che combina riproduzione delle sessioni, mappe di calore, funnel di conversione, analisi dei percorsi, segmentazione degli utenti e insight basati sull'IA in un unico strumento.
Per chi è più adatto LogRocket?
LogRocket è una soluzione ideale per i team di prodotto e di ingegneria che necessitano di riproduzione delle sessioni, monitoraggio frontend e analisi del prodotto in un'unica piattaforma.
Perché ho scelto LogRocket
LogRocket si è guadagnato un posto nella mia lista ristretta perché combina davvero il monitoraggio frontend con l'analisi del prodotto in un modo che la maggior parte degli strumenti non offre. Mi piace molto che i funnel siano collegati direttamente alle riproduzioni delle sessioni, così quando noto un calo in un funnel di conversione posso guardare immediatamente le sessioni alla base di quel dato. Galileo AI aggiunge un ulteriore livello, individuando i segnali di difficoltà prima che gli utenti abbandonino effettivamente un flusso, il che cambia la velocità con cui posso intervenire sui punti di attrito.
Funzionalità principali di LogRocket
- Monitoraggio automatico degli eventi: Registra automaticamente ogni evento dell'utente, visualizzazione di pagina e azione, senza richiedere modifiche al codice.
- Segmentazione basata sulle coorti: Crea coorti di pubblico a partire da qualsiasi combinazione di comportamenti, caratteristiche e metadati, per poi applicarle a qualsiasi grafico.
- Grafici di fidelizzazione: Monitorano quanto il tuo prodotto e le singole funzionalità riescano a fidelizzare gli utenti e mostrano quali azioni li spingono a tornare.
- Registrazione condizionale: Acquisisce solo le sessioni che soddisfano i criteri da te definiti, consentendoti di controllare il volume dei dati e i costi.
Integrazioni di LogRocket
LogRocket offre centinaia di integrazioni, tra cui Zendesk, Intercom, Qualtrics, G2 e Gong. Fornisce inoltre accesso tramite API e MCP per connessioni dati personalizzate.
Pros and Cons
Pros:
- I funnel si collegano direttamente alle riproduzioni delle sessioni
- Il monitoraggio frontend completa l'analisi del prodotto
- L'IA individua i punti di attrito prima dell'abbandono
Cons:
- Volumi elevati di sessioni possono diventare costosi
- L'attenzione agli aspetti tecnici può rappresentare una difficoltà per i team di ricerca

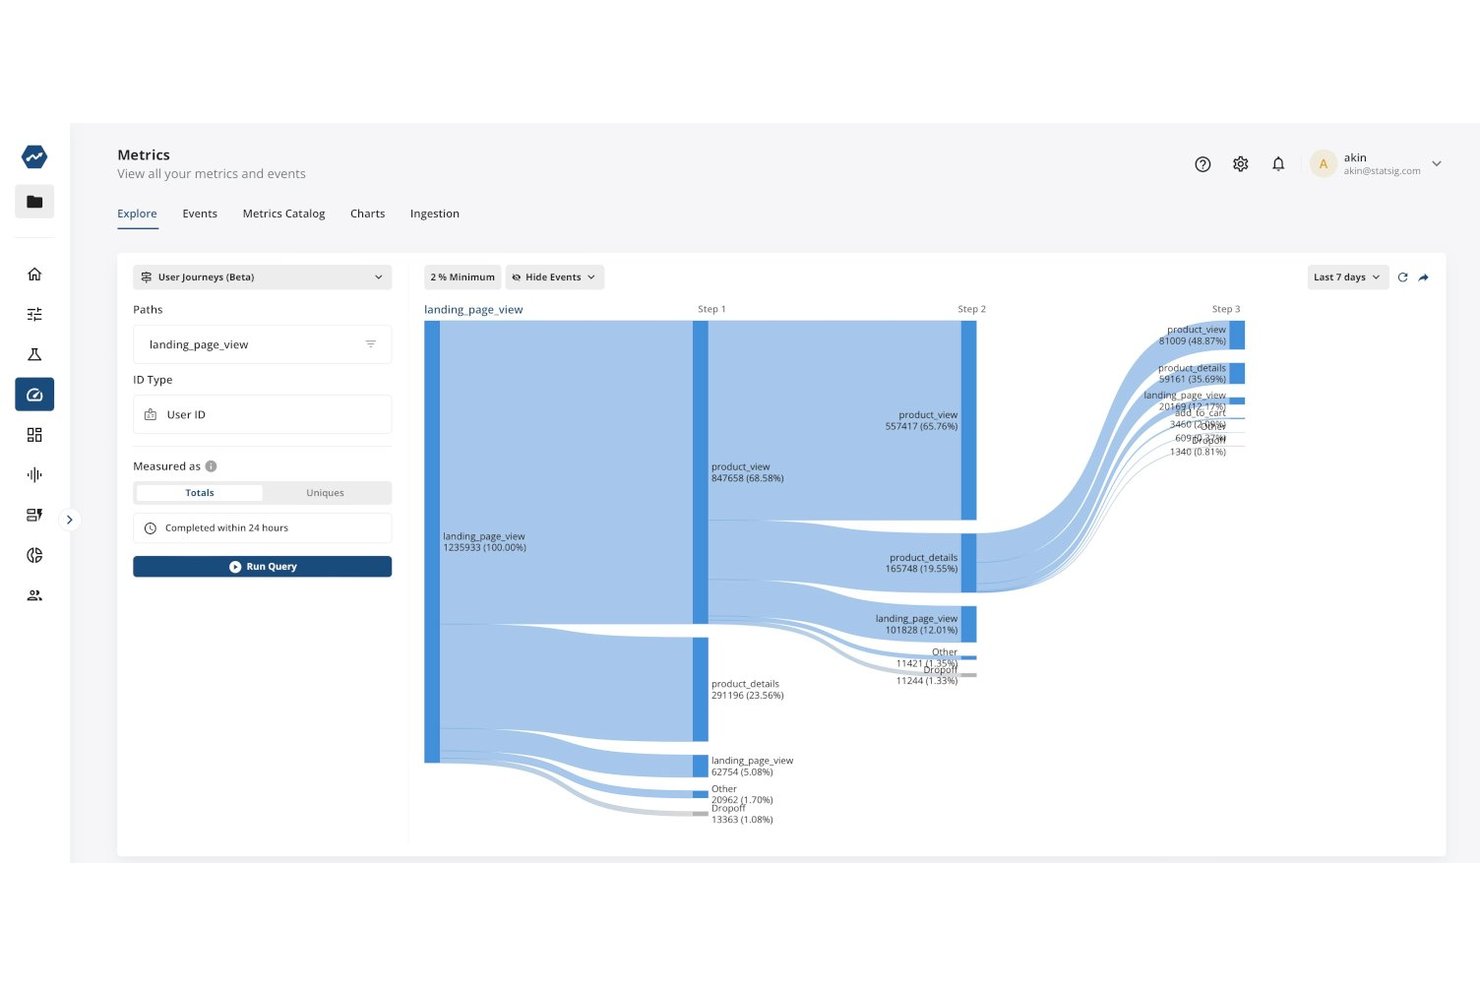
Statsig è una piattaforma di analisi dei prodotti e sperimentazione che combina il monitoraggio degli eventi comportamentali, l'analisi dei funnel e dei percorsi, la riproduzione delle sessioni, la segmentazione degli utenti e i flag delle funzionalità e i test A/B integrati in un unico posto.
Per chi è più adatto Statsig?
Statsig è particolarmente adatto ai team di prodotto che vogliono collegare direttamente i rilasci delle funzionalità ai dati comportamentali senza dover integrare separatamente strumenti di analisi e sperimentazione.
Perché ho scelto Statsig
Statsig si è guadagnato un posto nella mia lista ristretta perché collega direttamente i rilasci dei flag delle funzionalità ai dati comportamentali, permettendoti di vedere esattamente in che modo un rilascio ha prodotto un impatto, senza passare da uno strumento all'altro. Apprezzo molto il fatto che ogni riproduzione della sessione includa una cronologia completa degli eventi che mostra i controlli dei flag delle funzionalità e le esposizioni agli esperimenti: ciò significa che puoi ricondurre l'esperienza frustrante di un utente alla specifica variante del flag che gli è stata assegnata. Insieme all'analisi dei funnel integrata e ai fattori determinanti delle conversioni, rende la misurazione dell'impatto dei rilasci davvero concreta.
Funzionalità principali di Statsig
- Coorti comportamentali: Crea segmenti di pubblico riutilizzabili, come utenti assidui o utenti che hanno abbandonato il servizio, e applicali a funnel, grafici della fidelizzazione ed esperimenti.
- Distribuzione nativa del data warehouse: Esegui Statsig direttamente sulla tua istanza Snowflake, BigQuery, Databricks o Redshift esistente per avere il pieno controllo della governance dei dati.
- Acquisizione automatica per il web: Acquisisci clic, invii di moduli, clic ripetuti per frustrazione, profondità di scorrimento e metriche essenziali del web con una sola riga di JavaScript, senza bisogno di aggiungere tag manualmente.
- Analisi dei percorsi: Visualizza i percorsi seguiti dagli utenti prima e dopo qualsiasi azione per identificare schemi di navigazione imprevisti senza scrivere codice SQL.
Integrazioni di Statsig
Statsig supporta connessioni dati a sei data warehouse documentati: Snowflake, Databricks, BigQuery, Redshift, Athena e Microsoft Fabric. Offre inoltre controlli API nel piano Pro per integrazioni personalizzate, oltre a importazioni di dati aziendali e integrazioni in uscita.
Pros and Cons
Pros:
- I flag delle funzionalità collegano i rilasci al comportamento
- Le cronologie delle riproduzioni rivelano gli ostacoli alla base delle conversioni
- I funnel collegano gli abbandoni ai risultati degli esperimenti
Cons:
- Le mappe di calore non sono disponibili per l'analisi visiva
- L'acquisizione automatica da dispositivi mobili richiede la strumentazione manuale

Mixpanel
Ideale per report approfonditi

Mixpanel è una piattaforma di analisi del comportamento degli utenti che combina il tracciamento degli eventi, l’analisi dei funnel e dei flussi, la riproduzione delle sessioni, le mappe di calore, la segmentazione per coorti, i report sulla fidelizzazione e gli indicatori delle funzionalità e gli esperimenti integrati per web e dispositivi mobili.
A chi è più adatto Mixpanel?
Mixpanel è particolarmente adatto ai team di prodotto e dati che hanno bisogno di andare oltre le metriche superficiali e analizzare nel dettaglio come gli utenti si muovono all’interno di un prodotto.
Perché ho scelto Mixpanel
Mixpanel si è guadagnato un posto nella mia rosa di candidati perché la profondità dei suoi report è davvero difficile da eguagliare. Adoro il modo in cui i funnel consentono di impostare finestre di conversione personalizzate, escludere passaggi specifici e suddividere i risultati in base a qualsiasi proprietà dell’utente: così non vedi soltanto dove gli utenti abbandonano il percorso, ma anche esattamente quali segmenti incontrano difficoltà e perché. Se a questo aggiungi il report Flussi, che evidenzia i percorsi effettivamente seguiti dagli utenti invece di quelli che ti aspettavi, ottieni un livello di dettaglio comportamentale che cambia costantemente il modo in cui interpreto i dati del prodotto.
Funzionalità principali di Mixpanel
- Collegamento alla riproduzione delle sessioni: Apri una riproduzione della sessione direttamente da un passaggio del funnel o da un punto dati del grafico per vedere esattamente cosa ha fatto un utente in quel momento.
- Indicatori delle funzionalità e sperimentazioni: Conduci esperimenti multivarianti con metodi statistici tra cui CUPED e la correzione di Bonferroni, integrati nella stessa piattaforma delle tue analisi.
- Coorti comportamentali: Crea e salva coorti basate sul comportamento degli utenti, quindi riutilizzale come filtri nei report o sincronizzale con strumenti di marketing esterni.
- Connettori per data warehouse: Recupera dati da Snowflake, BigQuery, Databricks e Redshift per eseguire analisi direttamente sul tuo data warehouse esistente.
Integrazioni di Mixpanel
Le integrazioni di Mixpanel includono Segment, mParticle, Snowflake, BigQuery, Databricks, Redshift, HubSpot, ChurnZero, Slack e Workato. Le API di acquisizione, esportazione e interrogazione supportano connessioni dati personalizzate.
Pros and Cons
Pros:
- Collega le riproduzioni delle sessioni agli abbandoni nei funnel
- I flussi rivelano i percorsi degli utenti non pianificati
- Gli esperimenti collegano i rilasci ai risultati comportamentali
Cons:
- I report avanzati richiedono un periodo di onboarding considerevole
- Il rilevamento delle anomalie e l’analisi delle cause principali sono disponibili solo nei piani Enterprise

Ideale per l'analisi dei percorsi e degli attriti basata sull'IA
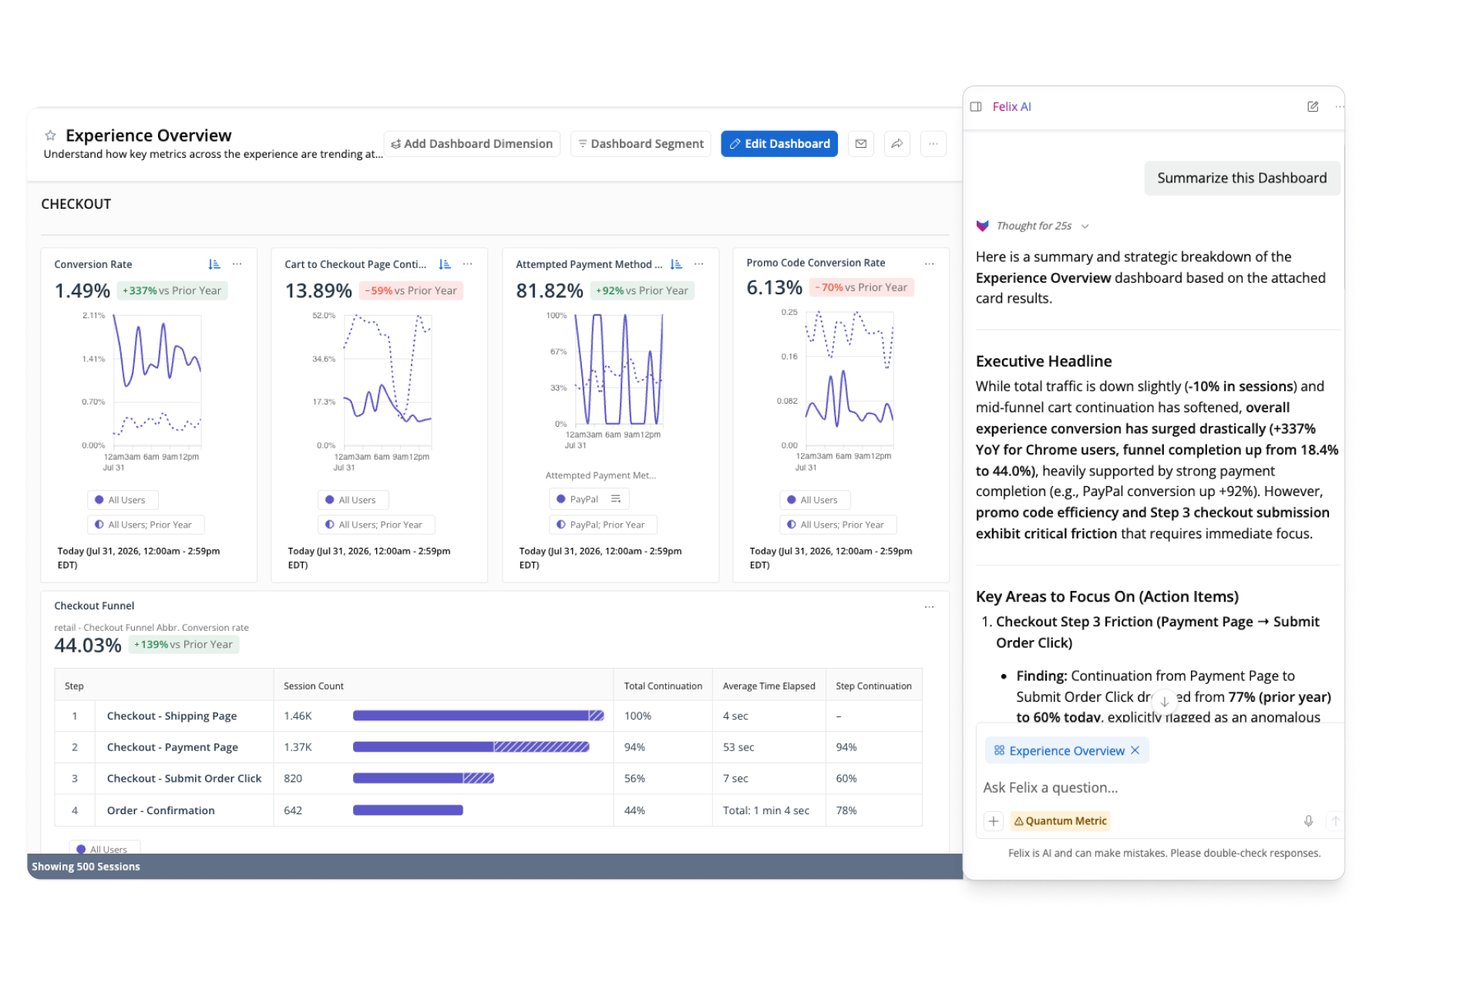
Quantum Metric è una piattaforma di analisi del comportamento degli utenti che acquisisce segnali comportamentali, tecnici e di attrito sul web, mobile e chioschi, combinando la riproduzione delle sessioni, le mappe di calore delle interazioni, l'analisi dei percorsi e gli insight basati sull'IA in un unico luogo.
Per chi è più adatto Quantum Metric?
Quantum Metric è particolarmente adatto ai team aziendali di prodotto e di esperienza digitale di grandi aziende B2C che hanno bisogno di collegare dati comportamentali, analisi dei percorsi e riproduzione delle sessioni in un unico luogo.
Perché ho scelto Quantum Metric
Quantum Metric si è guadagnato un posto nella mia rosa ristretta perché la sua analisi dei percorsi e degli attriti basata sull'IA va più in profondità rispetto alla maggior parte degli strumenti di questo livello. Sono particolarmente colpito da Analisi delle opportunità, che quantifica automaticamente l'impatto aziendale dei punti di attrito nei flussi degli utenti, così non devo cercare di indovinare quali abbandoni siano effettivamente importanti. Felix AI si aggiunge a questa funzionalità monitorando continuamente i percorsi e segnalando i problemi prima ancora che me ne accorga, con ogni avviso collegato direttamente alle riproduzioni delle sessioni per fornire un contesto immediato.
Caratteristiche principali di Quantum Metric
- Acquisizione automatica: Un singolo tag JavaScript o SDK mobile raccoglie oltre 300 segnali comportamentali, tecnici e di attrito senza richiedere alcuna codifica manuale.
- Generatore di segmenti: Crea segmenti nidificati a partire dagli attributi del pubblico o da sequenze di passaggi e applicali a percorsi, sessioni e mappe di calore.
- Streaming dei dati: Esporta i dati delle sessioni e comportamentali verso archivi di dati come Snowflake, BigQuery e Redshift tramite un componente aggiuntivo a pagamento con allineamento dello schema.
- Mappe di calore delle interazioni: Visualizza clic, scorrimenti e coinvolgimento a livello di pagina sul web e sui dispositivi mobili per capire dove si concentrano gli utenti.
Integrazioni di Quantum Metric
Quantum Metric si integra con Split, Optimizely, Google Analytics, Adobe Analytics, Salesforce, Jira, Slack, Snowflake, BigQuery e Redshift. Lo streaming dei dati si collega a ulteriori archivi di dati e destinazioni, tra cui Databricks, Amazon S3 e Oracle.
Pros and Cons
Pros:
- L'IA quantifica l'impatto aziendale degli attriti
- L'analisi dei percorsi si collega direttamente alle riproduzioni
- L'acquisizione automatica copre web, mobile e chioschi
Cons:
- I flussi di lavoro aziendali richiedono tempo per essere padroneggiati
- La profondità delle coorti di fidelizzazione non è ancora chiara

Fullstory
Ideale per combinare dati quantitativi e qualitativi

Fullstory è una piattaforma di analisi dell'esperienza digitale che acquisisce il comportamento degli utenti tramite la riproduzione automatica delle sessioni, mappe di calore, imbuti di conversione, analisi dei percorsi e report sulla fidelizzazione sul web e sui dispositivi mobili.
Per chi è più indicato Fullstory?
Fullstory è particolarmente adatto alle squadre di prodotto e UX che hanno bisogno di collegare i dati quantitativi relativi agli imbuti di conversione e alla fidelizzazione con la riproduzione qualitativa delle sessioni in un'unica piattaforma.
Perché ho scelto Fullstory
Fullstory è entrato nella mia lista ristretta perché è uno dei pochi strumenti che colma davvero il divario tra dati quantitativi e qualitativi in un unico flusso di lavoro. Apprezzo molto la possibilità di passare direttamente da un abbandono nell'imbuto di conversione alle riproduzioni delle sessioni degli utenti che hanno abbandonato, senza cambiare strumento o unire manualmente diversi set di dati. L'acquisizione automatica Fullcapture registra retroattivamente ogni interazione, così non si perde mai la possibilità di analizzare comportamenti che non si era pensato di contrassegnare in anticipo.
Funzionalità principali di Fullstory
- Omnisearch: Cerca in tutte le riproduzioni delle sessioni utilizzando qualsiasi segnale acquisito, inclusi clic ripetuti, errori o visite a pagine specifiche, per trovare esattamente le sessioni necessarie.
- Stato e avvisi dei segmenti: Monitora i segmenti di utenti nel tempo e ricevi una notifica quando il comportamento di un segmento cambia in modo significativo.
- Fullstory Anywhere Warehouse: Invia dati comportamentali preformattati direttamente al tuo archivio di dati, permettendoti di combinarli con i dati aziendali esistenti.
- Segnali di sentimento: Rileva automaticamente gli indicatori di frustrazione e confusione, mettendo in evidenza le sessioni in cui è più probabile che gli utenti incontrino difficoltà.
Integrazioni di Fullstory
Fullstory supporta integrazioni native, webhook, esportazione dei dati e Fullstory Anywhere Warehouse per inviare dati comportamentali ad archivi di dati e sistemi di archiviazione cloud. Le API Activation, Consent, FS.Identity ed Element supportano connessioni personalizzate.
Pros and Cons
Pros:
- L'acquisizione automatica retroattiva rivela comportamenti imprevisti
- Collega gli abbandoni nell'imbuto di conversione alle riproduzioni delle sessioni
- Combina dati quantitativi e qualitativi sul prodotto
Cons:
- L'implementazione su dispositivi mobili può richiedere uno sforzo aggiuntivo
- Gli avvisi possono richiedere il supporto degli ingegneri su larga scala
Altri strumenti di analisi del comportamento utente
Ecco altre opzioni di strumenti di analisi del comportamento utente che non sono entrate nella mia shortlist, ma che comunque meritano di essere considerate:
- CleverTap
Ideale per l'analisi del coinvolgimento nelle applicazioni mobili
- Pendo
Ideale per l'analisi dei prodotti con guida nell'app
- Mouseflow
Ideale per il monitoraggio automatico del punteggio di frizione
- Zoho Pagesense
Ideale per ottenere informazioni visive con le mappe di calore
- PostHog
Ideale per collegare le riproduzioni all'analisi degli abbandoni del funnel
- Userpilot
Ideale per analisi legate a correzioni nell'app
- Datadog Real User Monitoring
Ideale per i dati sul comportamento associati alle tracce di osservabilità


Come valuto gli strumenti di User Behavior Analytics
Divido la mia valutazione in criteri di base—event tracking, funnel, cohort—e fattori distintivi come session replay, insight basati su AI e compatibilità con il data stack che separano i migliori strumenti dal resto.
Funzionalità di base (Requisiti indispensabili per questa lista)
Quando seleziono gli strumenti per la mia lista, attribuisco a ciascuno un punteggio da 0 (non offre la funzionalità) a 5 (eccelle in questa area) per ciascuna delle funzionalità di base riportate sotto. Poi converto il punteggio totale dello strumento in percentuale. Ogni strumento deve raggiungere un punteggio totale minimo del 65% per poter essere incluso.
- Event Tracking: Verifico se uno strumento traccia clic, visualizzazioni di pagina ed eventi personalizzati sia su web che su mobile—e se la configurazione richiede un intervento tecnico importante o offre opzioni di auto-cattura.
- Analisi di Funnel & Conversione: La creazione di funnel multi-step su flussi come da iscrizione ad attivazione o finalizzazione dell'acquisto mi mostra quanto bene uno strumento evidenzia dove gli utenti abbandonano.
- Analisi di Cohort & Retention: Cerco la capacità di raggruppare gli utenti in base ad azioni condivise e monitorare la retention nel tempo, ad esempio osservando i tassi di ritorno settimanali per un nuovo cohort appena onboardato.
- Segmentazione Utenti: È importante poter filtrare gli utenti per comportamento, proprietà e attributi personalizzati. Valuto quanto siano flessibili le combinazioni di condizioni per isolare gruppi come gli utenti avanzati o gli account in prova.
- Analisi di Percorsi & Journey: Valuto quanto chiaramente uno strumento visualizza le sequenze effettive seguite dagli utenti all'interno di un prodotto, specialmente durante la diagnosi di pattern di navigazione inattesi dopo una modifica dell'interfaccia.
- Dashboard & Report Comportamentali: Dashboard condivisibili e personalizzabili sono il mezzo tramite cui gli insight arrivano agli stakeholder. Osservo la flessibilità del layout, le opzioni di schedulazione e se i report possono essere adattati al pubblico di riferimento.
Una volta ottenuta una lista di strumenti che soddisfano questi criteri, considero cosa distingue ciascuna piattaforma.
Fattori distintivi (Cosa distingue i vendor)
Ecco come confronto e metto a paragone i vari vendor:
Caratteristiche di spicco
Il session replay è un differenziatore importante. Cerco strumenti che consentano di filtrare le registrazioni in base a segnali di frustrazione come rage click o inversioni di percorso, trasformando gli abbandoni astratti nei funnel in problematiche facilmente identificabili. È importante anche la sperimentazione integrata, poiché eseguire A/B test collegati direttamente a metriche comportamentali tiene la validazione in un unico flusso di lavoro. Verifico anche la presenza di insight basati su AI che segnalano automaticamente anomalie, come un improvviso aumento di flussi di onboarding abbandonati, senza richiedere un'esplorazione manuale da parte del team di prodotto.
Oltre le funzionalità
Quanto bene uno strumento si integra con il tuo stack dati esistente è fondamentale. Controllo la presenza di integrazioni native con CDP come Segment e data warehouse come BigQuery, visto che l'inserimento dei dati comportamentali in questi sistemi è il modo con cui la maggior parte dei team di prodotto rendono operative le insight. Anche la struttura dei prezzi è importante. I modelli basati su eventi possono crescere rapidamente man mano che il prodotto scala, quindi valuto se i prezzi restano prevedibili a volumi elevati. Per i team che operano in settori regolamentati, osservo la copertura in termini di conformità comprese GDPR, SOC 2 e controlli di mascheramento dei dati personali.
Come scegliere uno strumento di analisi del comportamento utente
È facile perdersi tra lunghe liste di funzionalità e strutture di prezzo complesse. Per aiutarti a restare concentrato durante il tuo percorso di scelta del software più adatto alle tue esigenze, ecco una checklist di fattori da tenere presenti:
| Fattore | Cosa Considerare |
|---|---|
| Scalabilità | Lo strumento può crescere con la tua azienda? Cerca soluzioni che possano gestire più utenti e dati man mano che espandi. Considera le esigenze future e se lo strumento può soddisfarle senza costi o complessità aggiuntive. |
| Integrazioni | Si collega ai tuoi sistemi esistenti? Assicurati che si integri con il tuo CRM, email marketing e altri strumenti su cui fai affidamento. Verifica la presenza di integrazioni native o un facile accesso API per evitare trasferimenti di dati manuali. |
| Personalizzazione | Puoi adattarlo ai tuoi flussi di lavoro? Cerca opzioni che permettano dashboard e report personalizzati. Evita sistemi rigidi che ti costringono a lavorare in un modo specifico. |
| Facilità d'uso | È facile da usare per il tuo team? Testa l’interfaccia e la navigazione. Una curva di apprendimento ripida può rallentare l’adozione. Scegli design intuitivi che richiedono una formazione minima. |
| Implementazione e onboarding | Quanto velocemente puoi iniziare? Valuta il tempo e le risorse necessari per implementare lo strumento. Cerca piattaforme che offrano configurazioni guidate, tutorial e supporto durante la fase di onboarding. |
| Costo | Come si adatta il prezzo al tuo budget? Confronta il costo di proprietà, incluse le spese di configurazione e le tariffe di abbonamento. Fai attenzione a costi nascosti ed assicurati che la struttura dei prezzi sia trasparente. |
| Tutele di sicurezza | I tuoi dati e le informazioni degli utenti sono protetti? Controlla la presenza di crittografia, conformità alle normative sulla protezione dati e audit trail. Assicurati che il fornitore dia priorità alla sicurezza per evitare possibili violazioni. |
| Disponibilità del supporto | Quali opzioni di supporto sono disponibili? Assicurati di poter accedere tempestivamente all'aiuto tramite più canali come chat, email o telefono. Valuta la qualità e reattività del supporto del fornitore quando sorgono problemi. |
Cosa Sono gli Strumenti di Analisi del Comportamento Utente?
Gli strumenti di analisi del comportamento utente sono software che tracciano e analizzano come le persone interagiscono con il tuo sito web o app. Marketer, product manager e designer UX li utilizzano per comprendere cosa fanno gli utenti, individuare tendenze e scoprire punti in cui le persone si bloccano o abbandonano. Osservando le azioni reali degli utenti, puoi prendere decisioni più intelligenti durante le verifiche UX e in altre iniziative per migliorare l’esperienza e aumentare il coinvolgimento.
Funzionalità
Quando selezioni strumenti di analisi del comportamento utente, fai attenzione alle seguenti funzionalità chiave:
- Replay delle sessioni: Cattura e rivedi le interazioni degli utenti sulla tua piattaforma per comprendere il loro percorso e individuare aree da migliorare.
- Heatmap: Visualizza dove gli utenti cliccano, scorrono e passano il mouse sul sito per valutare il coinvolgimento e ottimizzare il design.
- Analisi dei funnel: Traccia i percorsi degli utenti sul sito per identificare i punti di abbandono e migliorare i tassi di conversione.
- Analisi delle coorti: Segmenta gli utenti in base al comportamento nel tempo per capire trend di retention e coinvolgimento.
- A/B testing: Sperimenta strategie diverse per ottimizzare l'esperienza utente e migliorare i risultati.
- Dashboard personalizzabili: Adatta la visualizzazione dei dati alle tue esigenze per accedere rapidamente alle metriche più importanti.
- Analisi in tempo reale: Accedi a insight immediati per prendere decisioni rapide e rispondere al comportamento degli utenti mentre accade.
- Segmentazione automatica: Classifica gli utenti in base alle loro azioni per sforzi di marketing e coinvolgimento più mirati.
- Risoluzione degli errori: Diagnostica e risolvi rapidamente i problemi nell’esperienza utente per mantenere la soddisfazione e ridurre l’abbandono.
- Tracciamento cross-device: Monitora le interazioni utente su più dispositivi per una visione completa del loro comportamento.
Vantaggi
L'implementazione di strumenti di analisi del comportamento utente offre numerosi vantaggi per il tuo team e la tua azienda. Ecco alcuni benefici a cui puoi guardare con interesse:
- Maggior coinvolgimento degli utenti: Analizzando le heatmap e le sessioni registrate, puoi comprendere meglio le interazioni degli utenti e migliorare la loro esperienza sul tuo sito.
- Aumento dei tassi di conversione: L’analisi dei funnel permette di identificare i punti di abbandono, consentendo di ottimizzare i percorsi e incrementare le conversioni.
- Decisioni guidate dai dati: Le analisi in tempo reale forniscono informazioni immediate, permettendo al tuo team di prendere decisioni rapide e consapevoli.
- Sforzi di marketing mirati: La segmentazione automatizzata classifica gli utenti in base al comportamento, consentendo strategie di marketing più precise ed efficaci.
- Maggiore soddisfazione dell’utente: Le funzioni di individuazione e risoluzione degli errori aiutano a identificare e correggere rapidamente i problemi di esperienza utente, mantenendo alta la soddisfazione e la fedeltà degli utenti.
- Visione completa degli utenti: Il monitoraggio cross-device offre una visione complessiva del comportamento degli utenti, aiutando a comprendere come interagiscono attraverso le diverse piattaforme.
- Sviluppo prodotto ottimizzato: Gli A/B test permettono di sperimentare nuove funzionalità e modifiche di design, orientando i miglioramenti grazie ai feedback degli utenti.
Costi e prezzi
La scelta degli strumenti di analisi del comportamento utente richiede la comprensione dei vari modelli e piani tariffari disponibili. I costi variano in base alle funzionalità, alle dimensioni del team, agli extra e altri fattori. La tabella seguente riassume i piani più comuni, i prezzi medi e le tipiche funzionalità incluse nelle soluzioni di analisi del comportamento utente:
Tabella di confronto dei piani per strumenti di analisi del comportamento utente
| Tipo di piano | Prezzo medio | Funzionalità comuni |
|---|---|---|
| Piano gratuito | $0 | Replay delle sessioni base, heatmap limitate e analisi basilari. |
| Piano personale | $10-$30/user/month | Heatmap avanzate, analisi funnel, analisi delle coorti e assistenza via email. |
| Piano business | $50-$150/user/month | Analisi in tempo reale, dashboard personalizzabili, A/B testing e assistenza prioritaria. |
| Piano enterprise | $200+/user/month | Monitoraggio cross-device, segmentazione avanzata, integrazioni complete e account manager dedicato. |
Domande frequenti sugli strumenti di analisi del comportamento degli utenti
Ecco alcune risposte alle domande più comuni sugli strumenti di analisi del comportamento degli utenti:
Gli strumenti di analisi del comportamento degli utenti richiedono competenze tecniche per essere utilizzati?
No, molti strumenti di analisi del comportamento degli utenti sono progettati con interfacce intuitive che non richiedono conoscenze tecniche approfondite. Tuttavia, alcune funzionalità avanzate possono richiedere un po’ di competenza tecnica. È consigliabile scegliere uno strumento adatto al livello di competenza del proprio team e che fornisca adeguato supporto o risorse di formazione.
Gli strumenti di analisi del comportamento degli utenti sono sicuri da utilizzare?
Sì, gli strumenti affidabili di analisi del comportamento degli utenti danno priorità alla sicurezza e alla protezione dei dati. Di solito offrono crittografia, conformità alle normative sulla protezione dei dati e altre misure di sicurezza per proteggere le tue informazioni. Controlla sempre le funzionalità di sicurezza e le politiche sulla privacy dello strumento per assicurarti che siano conformi agli standard della tua organizzazione.
Come si misura il ROI degli strumenti di analisi del comportamento degli utenti?
Per misurare il ROI, inizia stabilendo obiettivi di performance chiari, come migliorare le conversioni o ridurre l’abbandono. Monitora i parametri prima e dopo l’utilizzo dello strumento per vedere come le tue decisioni hanno influenzato i risultati. La differenza tra i guadagni aziendali ottenuti e l’investimento in termini di tempo o risorse ti offre una chiara visione del ROI.
Quali sono le sfide più comuni nell’adozione degli strumenti di analisi del comportamento degli utenti?
I team spesso incontrano problemi relativi all’accuratezza, coerenza dei dati e allineamento degli insight con risultati aziendali concreti. Senza obiettivi chiari, potresti raccogliere dati che non portano ad azioni significative. È inoltre comune sottovalutare lo sforzo necessario per mantenere la rilevanza dei dati nel tempo.
In che modo gli strumenti di analisi del comportamento degli utenti aiutano a migliorare le strategie di fidelizzazione?
Questi strumenti rivelano come gli utenti interagiscono con il tuo prodotto nel tempo, aiutandoti a individuare dove perdono interesse o smettono di interagire. Comprendendo questi comportamenti, puoi modificare onboarding, contenuti o comunicazioni per incentivare l’uso continuativo. La fidelizzazione migliora quando gli insight guidano direttamente le strategie di coinvolgimento.
E ora?
Se stai valutando strumenti per l’analisi del comportamento degli utenti, contatta gratuitamente un consulente SoftwareSelect per ricevere raccomandazioni personalizzate.
Basta compilare un modulo e fare una breve chiacchierata per entrare nei dettagli delle tue esigenze. Riceverai così una lista selezionata di software da valutare. Verrai supportato anche durante l’intero processo di acquisto, incluse le trattative sui prezzi.