

Kullanıcı deneyimi izleme yalnızca sayıları takip etmekten ibaret değildir; kullanıcıların ürününüzden öfkeyle ayrılmadan önce hayal kırıklığıyla ellerini havaya kaldırdığı anları yakalamakla ilgilidir. Hiç harika olduğunu düşündüğünüz bir özelliğin, kullanıcıların onu bulamadığını fark ettiğiniz oldu mu? Ya da yaptığınız her tasarım tercihini sorgulamanıza neden olan oturum kayıtlarını izlediniz mi?
Doğru UX izleme aracı, sürtüşme noktalarını fark etmenize, kullanıcıların nerelerde zorlandığını anlamanıza ve tahminleri gerçek iyileştirmelere dönüştürmenize yardımcı olur. Seçenekleri inceledim, onları test ettim ve gerçekten önemli olanları öne çıkarmak için gereksiz ayrıntıları eledim. Bu rehber, ekibinizin ihtiyaçlarına uygun bir araç bulmanıza yardımcı olacak; böylece ürününüzü daha akıcı, daha akıllı ve daha akılda kalıcı (doğru anlamda) hâle getirmeye odaklanabileceksiniz.
Why Trust Our Software Recommendations
6,700+
Reviews
20
Industry experts
16+
Evaluation factors
14
Years
Our team has been testing and reviewing software since 2012. As product managers ourselves, we know how difficult—and important—it is to choose the right software.
For this guide, we evaluated tools using hands-on testing and independent research, scoring tools using our selection criteria.
Our reviews reflect our human editorial judgment, not a sales pitch.
Expert reviewers:
- Andrew LumbySenior TPM
- Cristiano ValimSenior UI/UX Lead


Karşılaştırma Tablosu: Kullanıcı Deneyimi İzleme Araçları
Bu karşılaştırma tablosu, en iyi kullanıcı deneyimi izleme araçları seçimlerimdeki fiyatlandırma ayrıntılarını özetlemektedir.
Score legend (out of 5)
- Excellent4.5–5
- Good4–4.4
- Average3–3.9
- Below average2–2.9
- Poor1–1.9
Sorted by: Default
| Tool | Starting Price | Website | |||||||
|---|---|---|---|---|---|---|---|---|---|
Best for quantifying friction across user journeys | 3.5 out of 5 | 3 | 4 | 3 | 1 | 5 | 5 | $25/month Free plan + 14-day trial + demo available | Website |
Best for AI-driven root cause analysis | 3.3 out of 5 | 2 | 4 | 4 | 5 | 1 | 4 | $7/month 15-day free trial + demo available | Website |
Best for session replay insights | 4.0 out of 5 | 4 | 5 | 2 | 4 | 4 | 5 | Pricing upon request Free plan + demo available | Website |
Best for mobile app behavior analytics | 3.5 out of 5 | 4 | 4 | 2 | 2 | 4 | 5 | Pricing upon request Free plan + 14-day trial + demo available | Website |
Best for product and funnel behavior analysis | 3.7 out of 5 | 5 | 4 | 3 | 2 | 4 | 4 | $250/month Free plan available | Website |
Best for revenue-tied friction prioritization | 4.7 out of 5 | 5 | 5 | 4 | 4 | 5 | 5 | Pricing upon request Free demo available | Website |
Best for enterprise feedback and behavior pairing | 4.3 out of 5 | 5 | 4 | 5 | 2 | 5 | 5 | Pricing upon request Free demo available | Website |
Best for heatmap analytics | 3.8 out of 5 | 3 | 4 | 3 | 4 | 5 | 4 | $49/month Free plan + 15-day free trial + free demo available | Website |
Best for friction detection in regulated industries | 4.8 out of 5 | 5 | 5 | 5 | 4 | 5 | 5 | Pricing upon request Free demo available | Website |
Best for full-stack frontend and backend correlation | 4.3 out of 5 | 4 | 5 | 3 | 5 | 4 | 5 | $2.50/1,000 sessions/month Free demo + 14-day free trial available | Website |


En İyi Kullanıcı Deneyimi İzleme Aracı İncelemeleri
Aşağıda, kısa listeme giren en iyi kullanıcı deneyimi izleme araçlarına ilişkin ayrıntılı özetlerimi bulabilirsiniz. İncelemelerim; size en uygun aracı bulmanıza yardımcı olmak için her aracın temel özelliklerine, artılarına ve eksilerine, entegrasyonlarına ve ideal kullanım alanlarına ayrıntılı bir bakış sunar.
 Best for quantifying friction across user journeys
- Free plan + 14-day trial + demo available
- From $25/month (billed annually)
Visit WebsiteCustomer Rating:4.7/5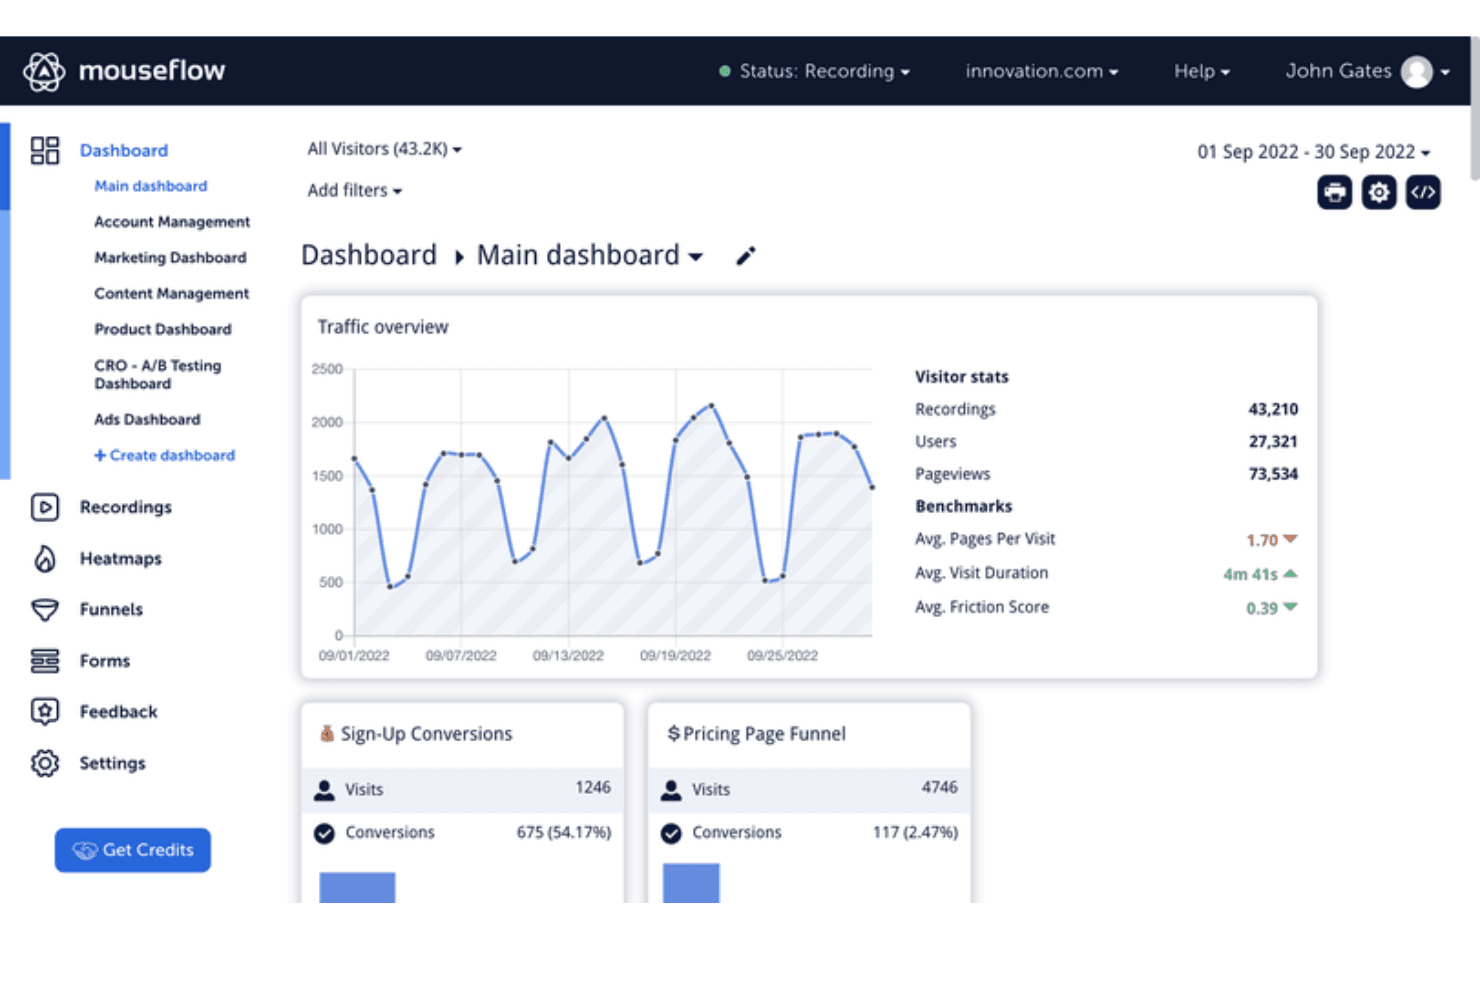
Mouseflow's dashboard tracks traffic, conversions, and visitor behavior metrics. Mouseflow is a web behavior analytics platform that combines session replay, seven heatmap types, friction scoring, form analytics, funnel tracking, and user journey mapping.
Who Is Mouseflow Best For?
Mouseflow is a strong fit for product and UX teams who need to see exactly where users struggle on web products and tie that friction directly to conversion impact.
Why I Picked Mouseflow
Mouseflow earns its spot on my shortlist because no other tool I've tested makes friction as measurable and actionable as this one does. Its proprietary Friction Score rates frustration at the session and page level, and the Friction Insights dashboard ranks your highest-friction pages automatically, so you're never guessing where to start. I also like that friction heatmaps show rage clicks, dead clicks, and stuck points visually, making it easy to connect a spike in frustration to a specific element on a specific page.
Mouseflow Key Features
- Session replay filtering: Filter recorded sessions by device, traffic source, rage clicks, Friction Score, and more to zero in on the sessions that matter most.
- Form analytics: Track field-level hesitation, skipped fields, blank submissions, and abandonment across native, third-party, and embedded forms.
- Conversion funnel tracking: Build no-code funnels with regex support, compare multiple funnels side by side, and see missed revenue at each drop-off step.
- Mina AI summaries: An AI assistant that analyzes friction signals across replays, heatmaps, and funnels and surfaces actionable UX recommendations in natural language.
Mouseflow Integrations
Mouseflow offers 42 documented native integrations, including Google Analytics, Adobe Analytics, Google Tag Manager, Google Ads, Shopify, WordPress, HubSpot, Slack, Microsoft Teams, and Zendesk. Its Open REST API supports custom integrations.
Pros and Cons
Pros:
- Captures seven distinct heatmap views
- Links replay insights to conversion impact
- Quantifies friction with proprietary scoring
Cons:
- Offers limited technical performance diagnostics
- Lacks native mobile app tracking
Learn more about Mouseflow: Best for AI-driven root cause analysis
- 15-day free trial + demo available
- From $7/month (billed annually)
Visit WebsiteCustomer Rating:4.5/5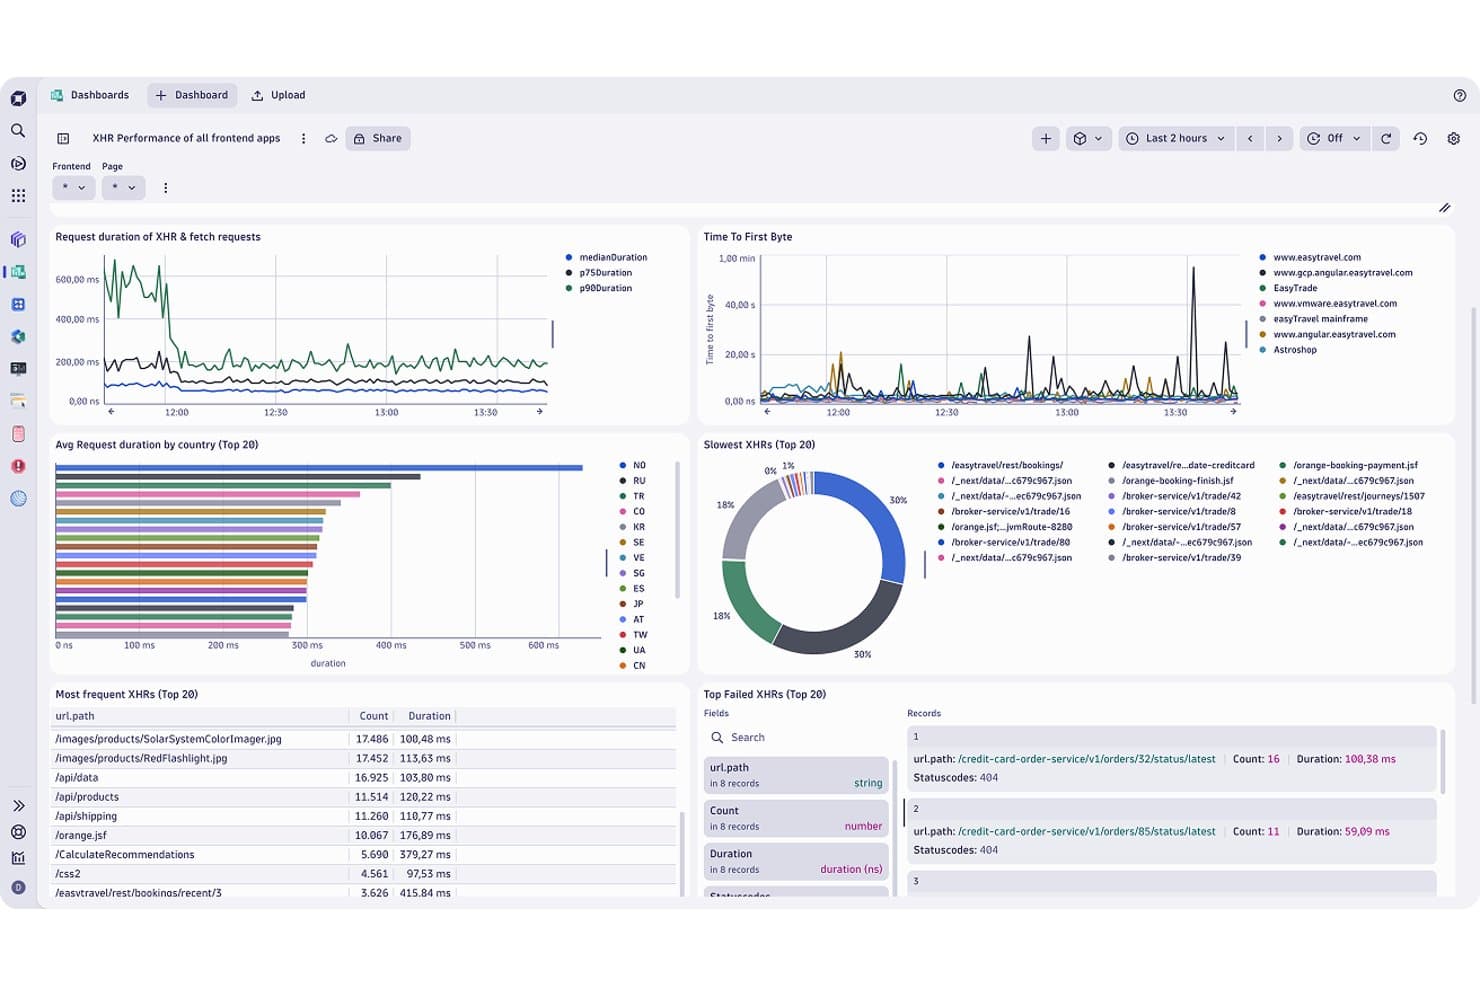
Dynatrace tracks XHR performance, request duration, and failed requests in real time. Dynatrace is a digital experience monitoring platform that combines real user session capture, session replay, frontend performance monitoring, AI-driven error detection, and full-stack observability across web and mobile applications.
Who Is Dynatrace Best For?
Dynatrace is a strong fit for enterprise engineering and IT/ops teams that need end-to-end visibility from frontend user sessions all the way through to backend traces and infrastructure.
Why I Picked Dynatrace
I picked Dynatrace as one of the best because its Davis AI doesn't just flag problems—it traces them automatically from a frustrated user session all the way back to a slow database query or a failing microservice. I love that the new Session Replay links directly to backend traces, logs, and error stack traces in one view, so you're not jumping between tools to diagnose why a checkout flow broke. On-demand AI session summarization surfaces exactly where things went wrong, in plain language, without you having to scrub through recordings manually.
Dynatrace Key Features
- Experience Vitals app: Tracks Core Web Vitals, waterfall analysis, mobile crash rates, and frontend error rates in a single dashboard with up to two years of metric retention.
- Health alerts with adaptive analyzers: Configures static, seasonal, or auto-adaptive alert thresholds across LCP, INP, CLS, crash rate, and traffic anomalies, feeding directly into Davis AI problem correlation.
- Error Inspector: Groups and prioritizes frontend errors and crashes by severity and user impact, with source-map drill-down and direct Jira integration for developer handoff.
- Privacy masking controls: Applies recording-time and playback-time data masking across web and mobile sessions, with role-based access to unmasked content and retroactive rule application.
Dynatrace Integrations
Dynatrace offers native integrations with Jira, Slack, PagerDuty, Microsoft Teams, and ServiceNow. It also supports OpenTelemetry, configuration-as-code, the Settings API, Workflows, and custom integrations through DQL.
Pros and Cons
Pros:
- Tracks Core Web Vitals alongside mobile crashes
- Session replays connect actions with error traces
- AI traces frontend issues to backend causes
Cons:
- Custom funnels require DQL query work
- No native heatmaps for visual behavior analysis
Learn more about Dynatrace: Best for session replay insights
- Free plan + demo available
- Pricing upon request
Visit WebsiteCustomer Rating:4.5/5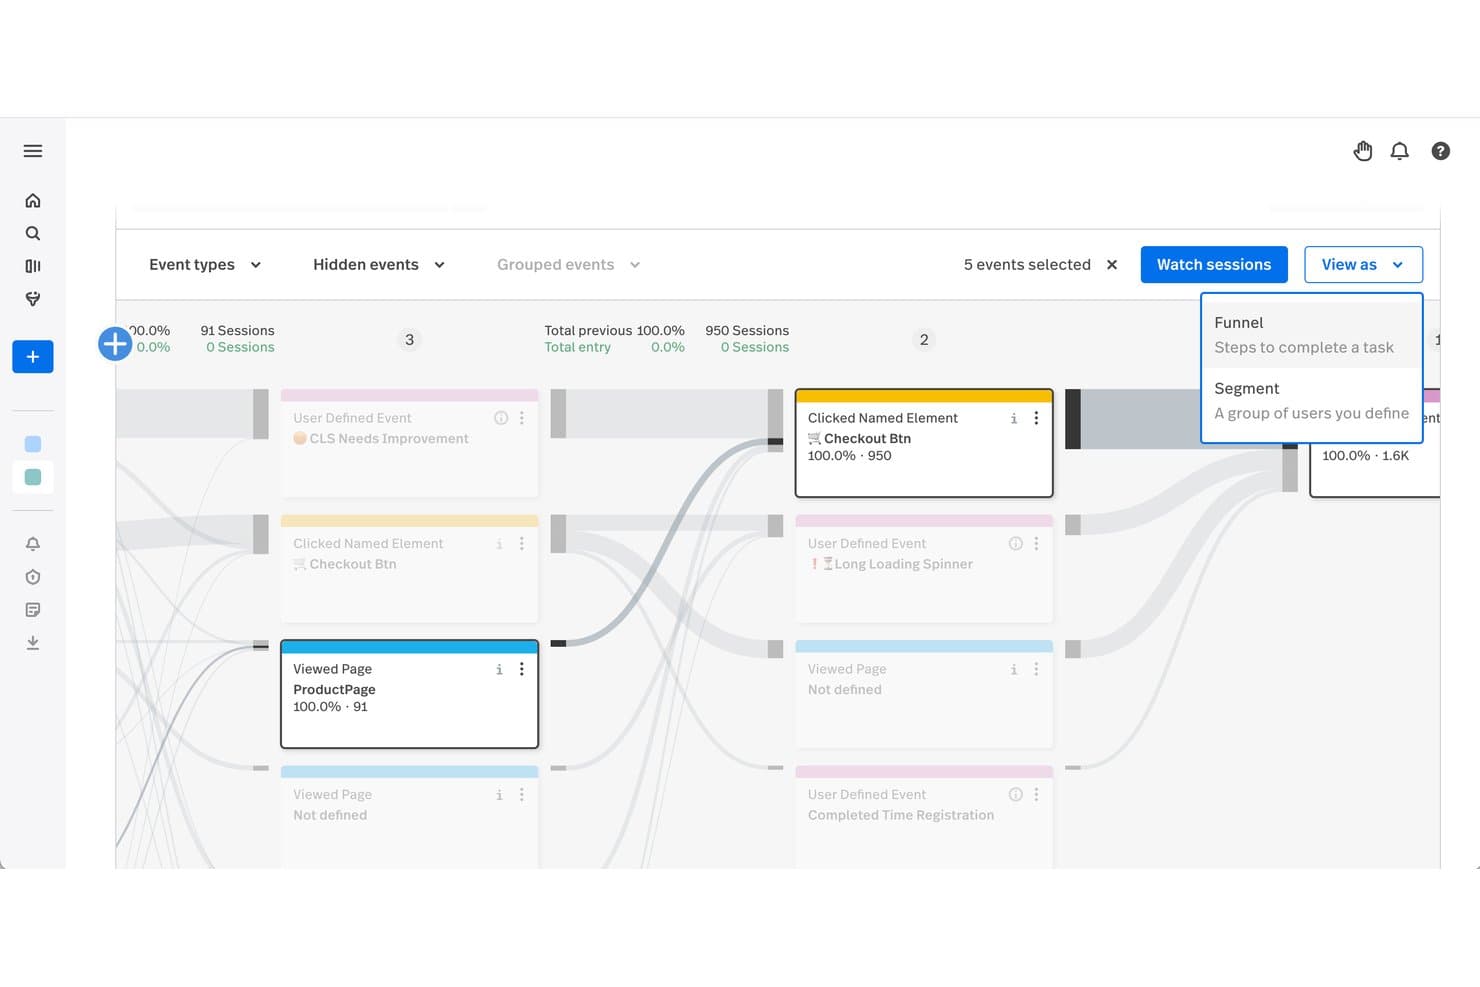
Fullstory lets users visualize user journeys across key interaction events. Fullstory is a user experience monitoring platform that captures sessions through tagless autocapture and combines session replay, heatmaps, funnel analysis, friction detection, and AI-powered behavioral summaries across web and native mobile apps.
Who Is Fullstory Best For?
Fullstory is a strong fit for product managers and UX teams who need to connect session replay data directly to funnel drop-off, friction signals, and revenue impact.
Why I Picked Fullstory
Fullstory earns its spot on my shortlist because session replay here isn't just video playback—it's tied directly to friction signals like rage clicks, dead clicks, and thrashed cursor movement, so I can pinpoint exactly where users struggle without manually scrubbing through recordings. I particularly like StoryAI Opportunities, which automatically surfaces friction points ranked by revenue impact, turning hours of replay review into a prioritized action list. The Frustrated Sessions card, available even on the free plan, surfaces the 10 most friction-heavy sessions instantly.
Fullstory Key Features
- Tagless autocapture: Fullstory records all user interactions automatically, with no manual event tagging required.
- Dev Tools sync: Console logs, network request waterfalls, and JavaScript errors are captured and synced directly to the session replay timeline.
- Journeys analysis: Multi-step user paths are mapped across single or multiple sessions, with segment comparison and session filtering at each step.
- Privacy masking: Sensitive elements are redacted on-device before transmission, with customizable masking rules that can be updated without redeploying your app.
Fullstory Integrations
Fullstory documents integrations with Jira, Slack, Microsoft Teams, Google Analytics, Google Tag Manager, Salesforce, Shopify, Tealium, Twilio Segment, and Zendesk. It also offers APIs, webhooks, data exports, and Zapier for custom connectivity.
Pros and Cons
Pros:
- Developer errors align with user behavior
- StoryAI ranks issues by revenue impact
- Session replays reveal friction context
Cons:
- Replay review still demands substantial time
- Advanced analysis requires higher-tier plans
Learn more about Fullstory: Best for mobile app behavior analytics
- Free plan + 14-day trial + demo available
- Pricing upon request
Visit WebsiteCustomer Rating:4.6/5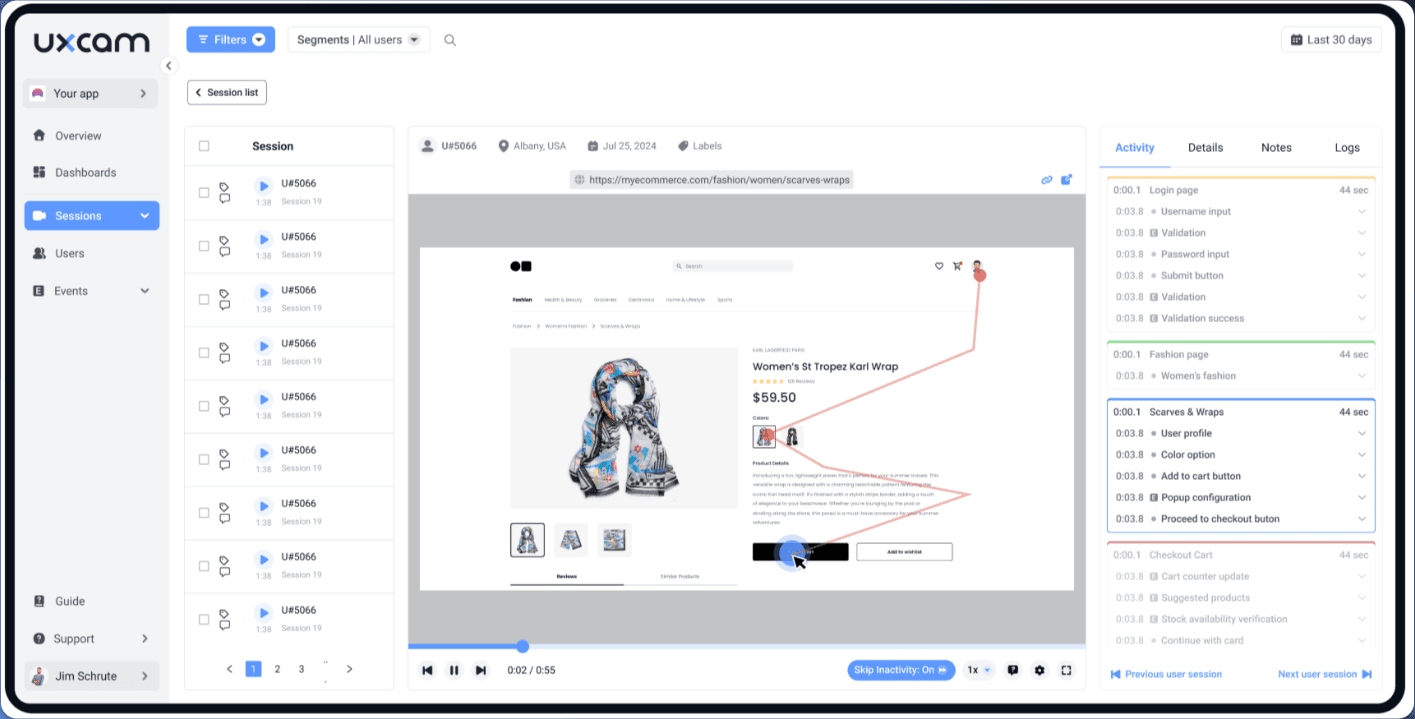
UXCam offers mobile app analytics for product managers and developers. UXCam is a mobile-first product analytics platform that combines session replay, touch and web heatmaps, funnel analysis, journey mapping, and AI-driven friction detection across native and cross-platform mobile apps and websites.
Who Is UXCam Best For?
UXCam is a strong fit for mobile product teams who need to understand in-app user behavior across iOS, Android, and cross-platform frameworks.
Why I Picked UXCam
UXCam earns its spot on my shortlist because no other tool I've tested matches its depth of mobile-native behavior analytics. I love how rage tap detection, UI freeze tracking, and Screen Flow journey mapping all feed directly into session replays, so when I see a drop-off in a funnel, I can click straight into the recordings of users who abandoned. Tara AI takes it further by surfacing the friction points I'd otherwise spend hours finding manually.
UXCam Key Features
- Smart Filters: Search sessions using natural-language queries like "sessions with crashes in the last 7 days" without manually setting up complex filter rules.
- Cross-platform SDK support: A single SDK covers native iOS, Android, React Native, Flutter, and other frameworks, capturing mobile behavior across all of them.
- Privacy masking controls: Automatically occludes passwords and detected PII patterns, with dashboard-configurable screen-blur rules that don't require a developer to update.
- Retention analytics: Track user cohorts over time and reuse saved cohorts as filters across funnels, dashboards, and other reports.
UXCam Integrations
UXCam has eight documented integrations, including Segment, Amplitude, Firebase Crashlytics, Firebase Google Analytics, Intercom, Survicate, Slack, and Microsoft Teams. Its Data Access API supports custom connections and exports raw and aggregated data.
Pros and Cons
Pros:
- Tara prioritizes friction by user impact
- Funnels connect drop-offs to session replays
- Mobile-native crash and freeze diagnostics
Cons:
- Dashboard can overwhelm with data
- Web performance monitoring remains limited
Learn more about UXCam: Best for product and funnel behavior analysis
- Free plan available
- From $250/month
Visit WebsiteCustomer Rating:4.5/5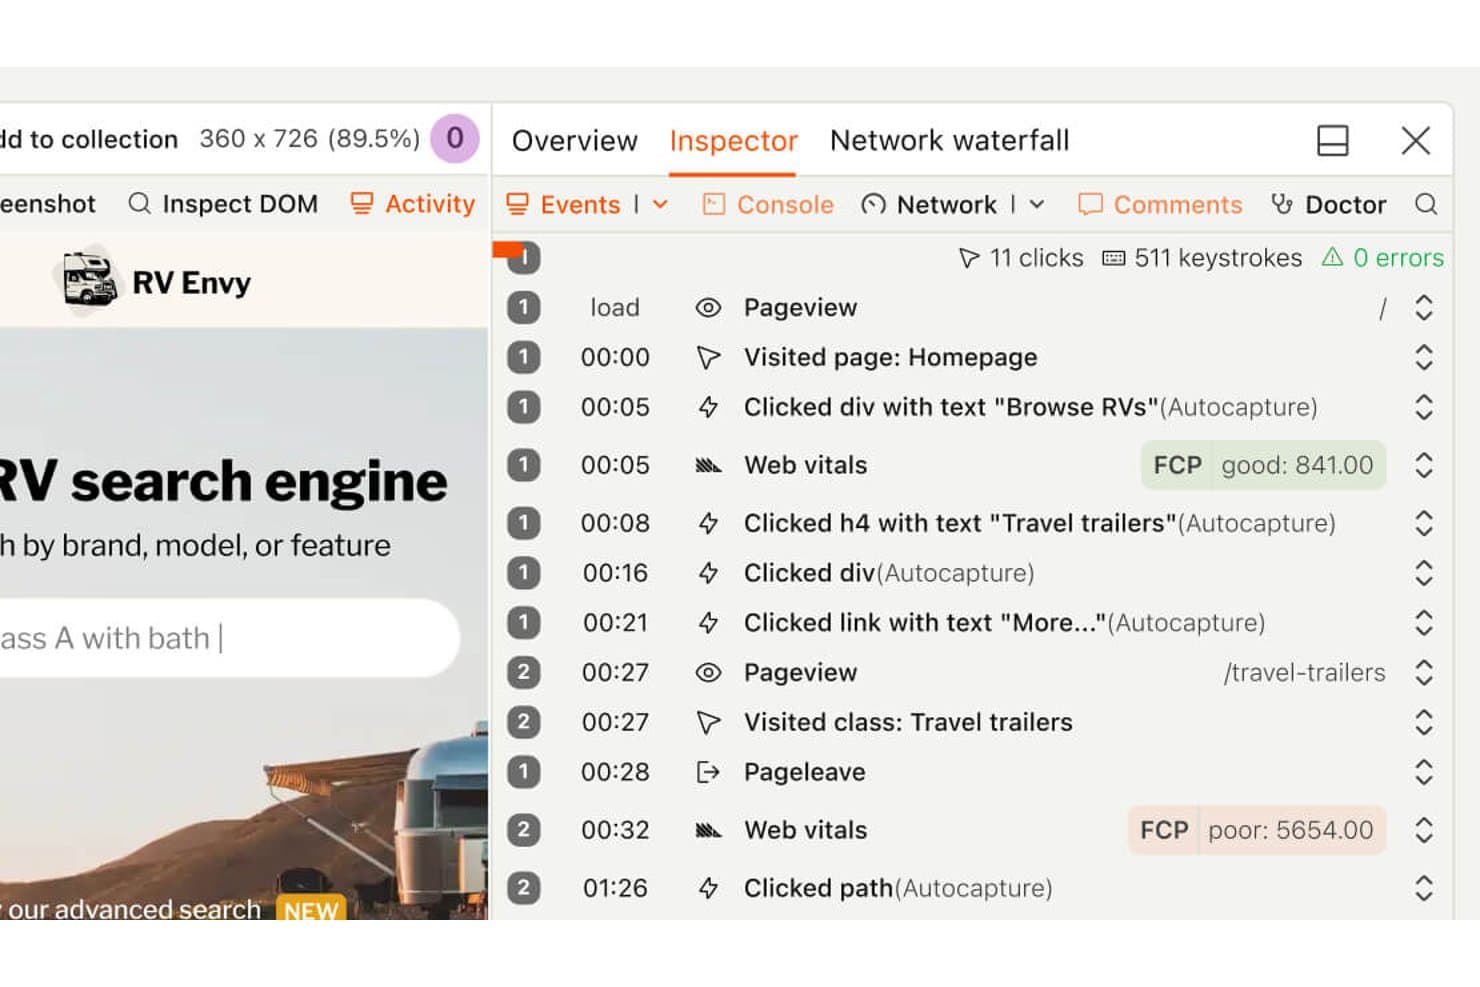
PostHog's session replay timeline tracks user clicks and page vitals. PostHog is a product analytics and user experience monitoring platform that combines session replay, heatmaps, funnel analysis, user paths, error tracking, and web vitals into a single connected toolset.
Who Is PostHog Best For?
PostHog is a strong fit for product managers and developers at tech-forward teams who want session replay, funnels, and behavioral analytics in one place without paying per seat.
Why I Picked PostHog
I picked PostHog as one of the best because its funnel and path analysis is the tightest I've seen in this category. When a funnel step shows drop-off, I can click directly into the sessions behind that cohort—no exporting, no switching tools. The correlation analysis then surfaces which user properties or events actually predict conversion, so I'm not just watching replays blindly.
PostHog Key Features
- Session replay with DevTools sync: Each recording includes a synced panel showing console logs, network requests, and errors at the exact moment they occurred in the session.
- Rage click and dead click autocapture: PostHog automatically captures rage clicks and dead clicks without manual instrumentation, flagging them as friction signals you can filter replays by.
- Replay Vision AI scanners: AI-powered scanners review recordings and classify sessions by user intent, frustration score, and outcome, storing results as queryable events you can alert on.
- Threshold and anomaly-detection alerts: Set alerts on trends, funnels, or SQL insights using statistical or machine-learning detectors, with notifications via Slack, email, Teams, Discord, or webhook.
PostHog Integrations
PostHog offers native integrations with GitHub, GitLab, Linear, Jira, Slack, Discord, and Microsoft Teams, plus dozens of real-time data destinations and webhook support. Its API and MCP server support custom workflows and AI coding tools.
Pros and Cons
Pros:
- Error tracking links issues to recordings
- Autocaptures rage clicks and dead clicks
- Funnels connect directly to session replays
Cons:
- Native frustration scoring requires Replay Vision
- Performance monitoring covers few web vitals
Learn more about PostHog: Best for revenue-tied friction prioritization
- Free demo available
- Pricing upon request
Visit WebsiteCustomer Rating:4.7/5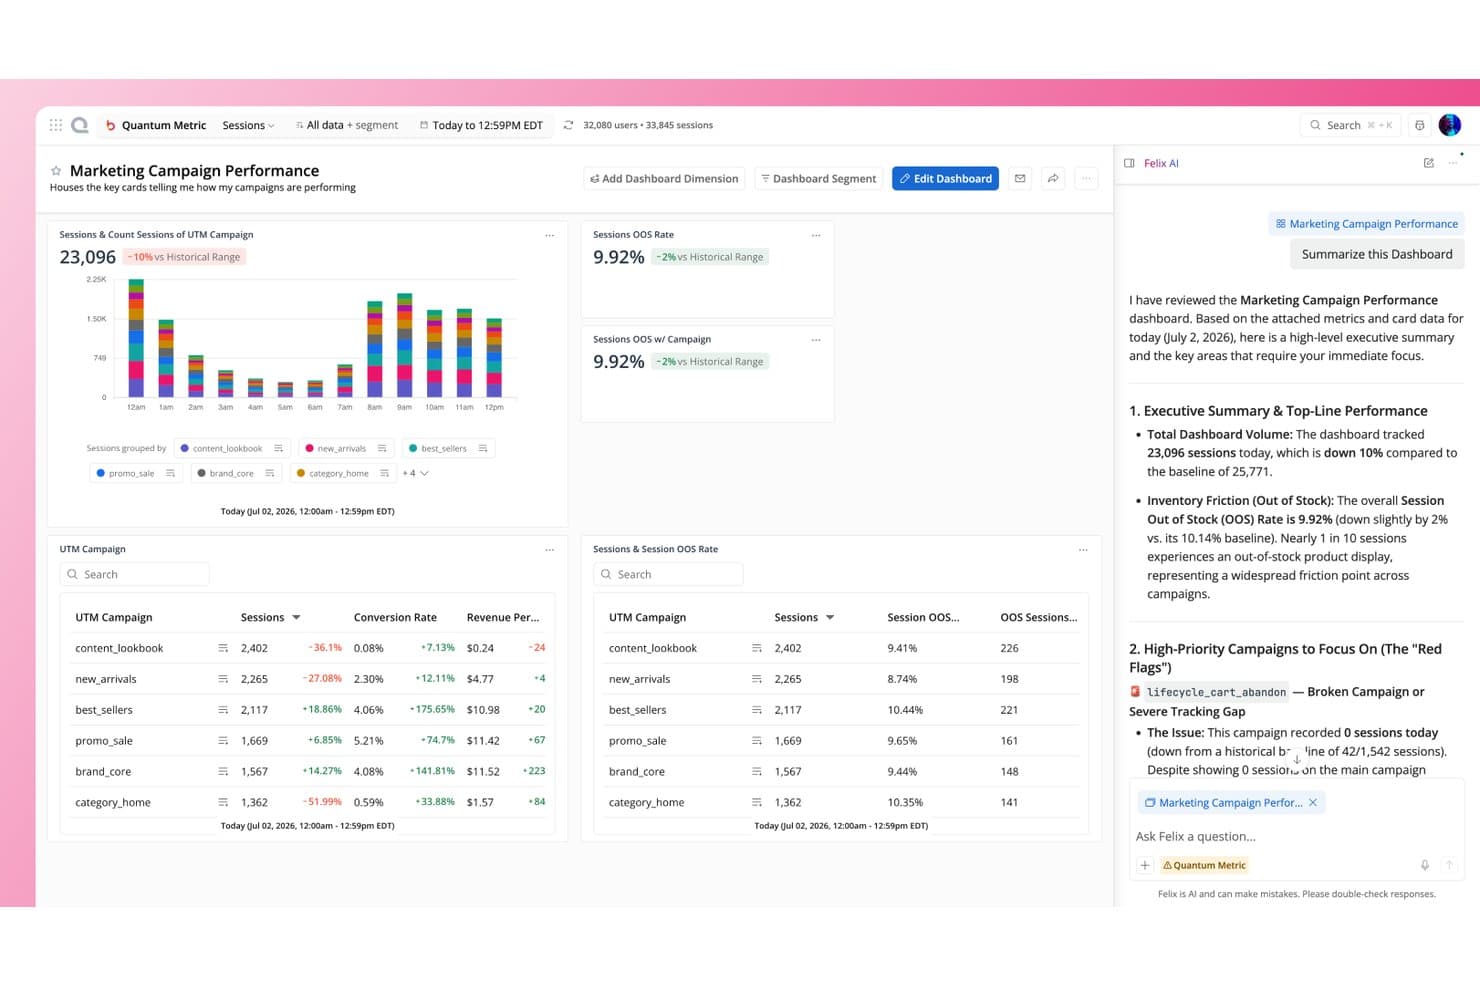
Quantum Metric's Felix AI summarizes campaign dashboards instantly. Quantum Metric is a digital experience analytics platform that combines session replay, heatmaps, journey analysis, friction detection, and AI-driven opportunity analysis across web, mobile, and kiosk.
Who Is Quantum Metric Best For?
Quantum Metric is a strong fit for enterprise product and digital teams who need to tie UX friction directly to revenue impact before deciding what to fix first.
Why I Picked Quantum Metric
Quantum Metric earns its spot on my shortlist because it's the only tool I've seen that automatically ranks friction points by revenue impact, so your team isn't guessing what to fix first. Its Opportunity Analysis does this out of the box: one click sizes the dollar cost of any issue across a funnel step, and it pulls up session replays of affected users instantly. Felix Agentic agents then monitor KPIs like funnel drop-off continuously and explain root causes in plain language.
Quantum Metric Key Features
- Felix AI session summarization: An AI layer built on Gemini Pro summarizes individual sessions and cross-session journeys, then answers follow-up questions in plain language.
- Experience Alerts: Pre-configured, anomaly-based alerts monitor frustration signals, conversion funnels, and page-speed drops in real time, with multi-channel delivery via email, Slack, or webhook.
- Autocapture with visual event editor: A single JS tag or SDK captures 60+ behavioral and friction indicators automatically, and non-engineers can define custom events through a point-and-click editor.
- Device-side PII encryption: Personal data is encrypted on the user's device using RSA 2048 and AES 256 before transmission, with only the customer holding the private key.
Quantum Metric Integrations
Quantum Metric offers integrations with Optimizely, AB Tasty, Split, Salesforce Service Cloud, Qualtrics, Medallia, Adobe Analytics, Looker, Splunk, Slack, and 50+ more. It also supports REST API access and webhooks for custom connectivity.
Pros and Cons
Pros:
- Mobile journeys support cross-device analysis
- Replays connect behavior with technical errors
- Revenue impact clarifies friction priorities
Cons:
- Mobile capture can reduce frame rates
- Search and segment loading can lag
Learn more about Quantum Metric: Best for enterprise feedback and behavior pairing
- Free demo available
- Pricing upon request
Visit WebsiteCustomer Rating:4.6/5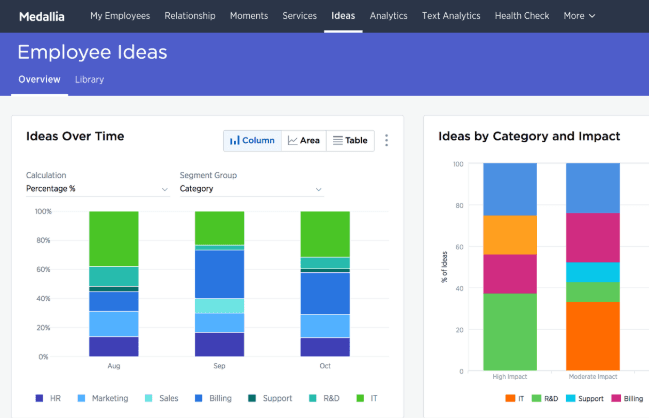
Medallia enhances business transformation for customers and employees. Medallia Digital Experience Analytics (DXA) is a user experience monitoring platform that captures session replays, heatmaps, funnel and journey analysis, real-time experience scoring, and in-app feedback—all paired with AI-driven behavioral insights across web and native mobile.
Who Is Medallia Best For?
Medallia DXA is built for enterprise teams that need to connect behavioral data—replays, heatmaps, and journey analysis—directly to voice-of-customer feedback programs.
Why I Picked Medallia
Medallia earns its spot on my shortlist because it's the only tool I've seen that genuinely closes the loop between what users do and what they say. I love how each Digital Feedback survey response pairs directly with its session replay, so you can watch the exact journey behind a frustrated score. The Digital Experience Score adds another layer, rating every session from 0 to 10 across five behavioral pillars and surfacing revenue-ranked pages so your team knows which friction points cost the most.
Medallia Key Features
- Sunburst journey visualization: Maps every unique path users take through your site or app, so you can see where sessions diverge and where drop-off happens.
- Multiple heatmap types: Offers behavioral, scroll and dot, attribution, and hybrid attention heatmaps, each surfacing a different layer of on-page interaction data.
- Real-time interaction triggers: Detects frustration or engagement signals as they happen and fires live chat, promotions, or surveys in response.
- Native mobile SDK support: Covers iOS, Android, Flutter, and React Native with session replay, heatmaps, crash reporting, and network error tracking built in.
Medallia Integrations
Medallia offers native integrations with Adobe Analytics, Adobe Target, Adobe Audience Manager, Adobe Experience Platform, Slack, and Invoca. It also supports open APIs, webhooks, data streams, Google Tag Manager, and marketplace connectivity through Medallia Xchange.
Pros and Cons
Pros:
- Scores sessions across five experience pillars
- Ranks friction by potential revenue impact
- Pairs feedback responses with session replays
Cons:
- Advanced replays require a Chrome extension
- Web performance lacks confirmed Core Web Vitals
Learn more about Medallia: Best for heatmap analytics
- Free plan + 15-day free trial + free demo available
- From $49/month
Visit WebsiteCustomer Rating:4.5/5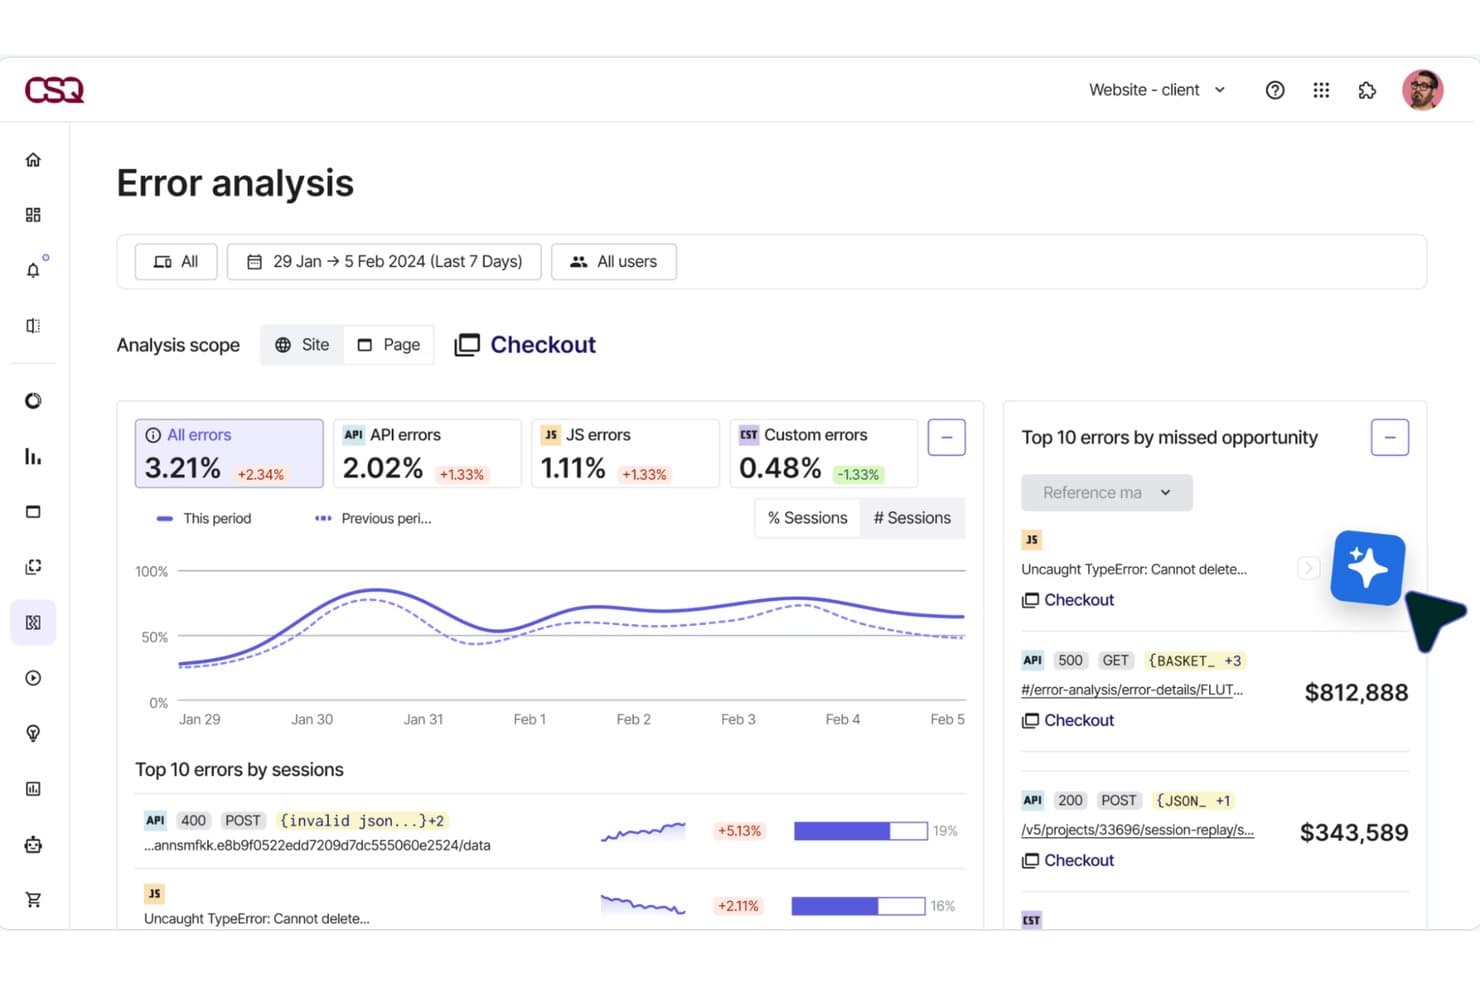
Hotjar (by Contentsquare) surfaces revenue lost to checkout errors. Hotjar (by Contentsquare) is a user experience monitoring platform that combines session replay, heatmaps, funnel analysis, friction detection, and frontend performance monitoring in a single tool.
Who Is Hotjar (by Contentsquare) Best For?
Hotjar is a strong fit for UX researchers and product managers who need visual behavior data—heatmaps, session replays, and funnel drop-off analysis—without a steep learning curve.
Why I Picked Hotjar (by Contentsquare)
Hotjar earns its spot on my shortlist because its heatmap capabilities go further than any other tool I've tested. Beyond standard click maps, it generates zone-based revenue heatmaps that show conversion rate and revenue per page element, so you can see exactly which CTA or product image is pulling its weight. I also love how one click takes you from a heatmap directly into the matching session replays, closing the loop between aggregate behavior and individual user context.
Hotjar (by Contentsquare) Key Features
- Frustration score: Automatically detects rage clicks, dead clicks, and repeated form field errors, then ranks each issue by its estimated business impact.
- Smart Capture: Records every user interaction automatically with no manual tagging, including privacy masking of sensitive input fields before data leaves the browser.
- Funnel analysis: Lets you build multi-step funnels without code and links each drop-off point directly to the matching session replays for immediate context.
- Sense AI summaries: Generates plain-language summaries of individual replays and heatmaps, with cross-session summaries available on Pro and Enterprise plans.
Hotjar (by Contentsquare) Integrations
Contentsquare lists 10+ integrations, including Google Analytics, Jira, Slack, Microsoft Teams, HubSpot, Segment, Mixpanel, Optimizely, Shopify, and Zapier. Pro plans include API access for custom integrations.
Pros and Cons
Pros:
- AI summaries reduce manual replay review
- Session replays connect friction to context
- Revenue-ranked heatmaps clarify UX priorities
Cons:
- Advanced error diagnostics require higher tiers
- Replay sampling limits full behavioral coverage
Learn more about Hotjar (by Contentsquare): Best for friction detection in regulated industries
- Free demo available
- Pricing upon request
Visit WebsiteCustomer Rating:4.7/5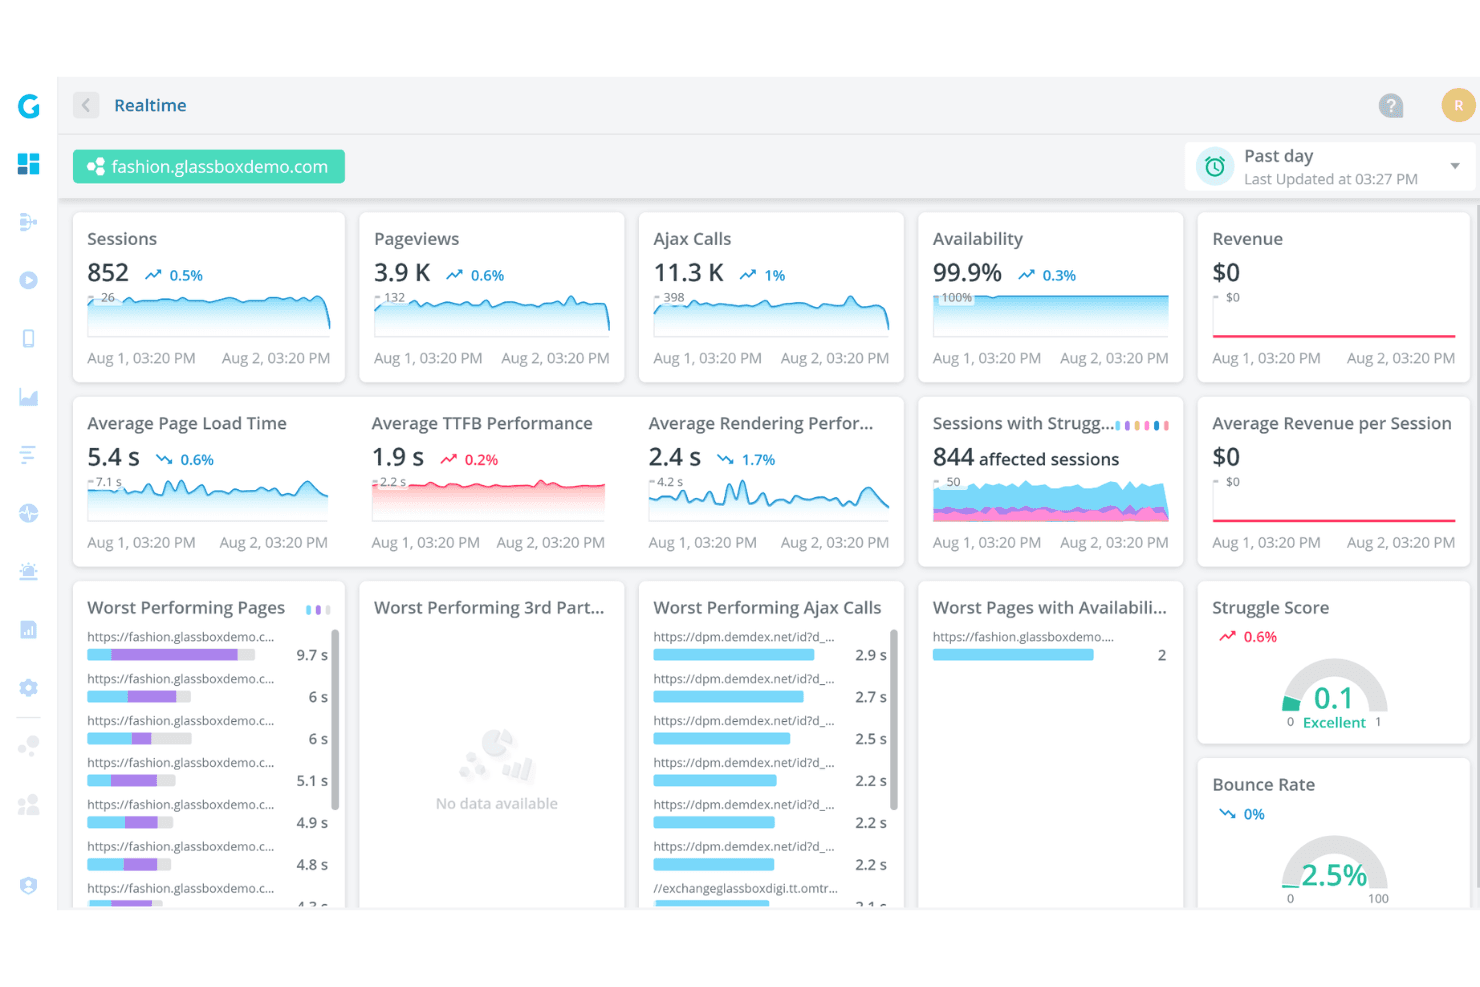
Glassbox offers a real-time analytics dashboard displaying sessions, pageviews, Ajax calls, availability, page load times, and struggle scores for a demo fashion website. Glassbox is a digital experience analytics platform that captures 100% of user sessions with tagless technology, combining session replay, interaction maps, funnel analysis, struggle detection, and real user monitoring across web and native mobile apps.
Who Is Glassbox Best For?
Glassbox is a strong fit for enterprise teams in regulated industries—like financial services and insurance—where compliance, privacy controls, and audit-ready session records are non-negotiable.
Why I Picked Glassbox
I picked Glassbox as one of the best because its Struggle Score and Session Vault combination is purpose-built for regulated industries where friction isn't just a UX problem—it's a compliance risk. The Struggle Score flags problem pages using patterns trained on trillions of sessions, while Session Vault stores time-stamped, tamper-proof session records for audit and complaint handling. I also like that its 30+ automatically detected struggle behaviors tie directly to revenue impact, so I can prioritize fixes with real business context.
Glassbox Key Features
- Tagless session capture: Records 1,000+ events per session automatically across web and native mobile apps, with no manual tagging required.
- Augmented Journey Map™: Visualizes cross-channel user journeys with 25+ dimensions, node-level flow analysis, and segmentation by VoC or A/B test data.
- GIA natural-language search: Lets you query sessions in plain language and get AI-generated summaries of sessions and reports through a chat interface.
- Interaction maps: Show click rate, focus time, errors, struggles, and revenue impact per page element, with side-by-side segment comparison tools.
Glassbox Integrations
Glassbox offers documented integrations with Jira, Slack, Microsoft Teams, AppDynamics, New Relic, Splunk, Adobe Analytics, Google Analytics, Qualtrics, and Optimizely. An open API supports custom integrations, and tag management connects through Google Tag Manager, Adobe Launch, and Tealium.
Pros and Cons
Pros:
- Preserves tamper-proof sessions for audits
- Links friction to revenue impact
- Captures every interaction without manual tagging
Cons:
- Filters and reports can confuse new users
- Replay coverage varies by package
Learn more about Glassbox: Best for full-stack frontend and backend correlation
- Free demo + 14-day free trial available
- From $2.50/1,000 sessions/month (billed annually)
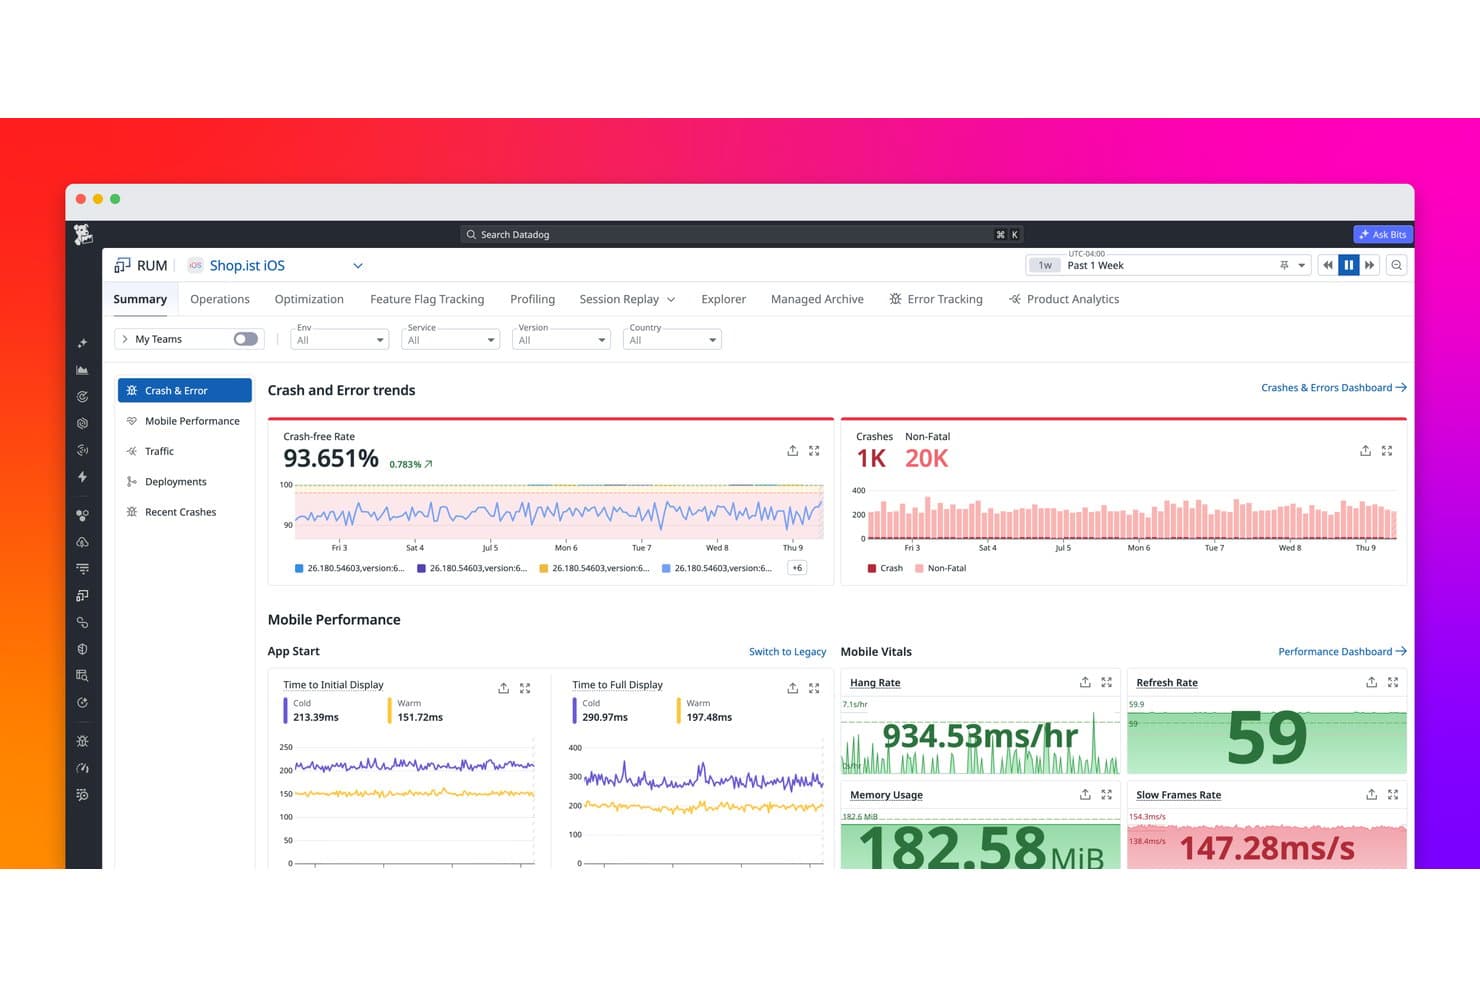
Datadog Real User Monitoring tracks crash rates, errors, and mobile performance metrics. Datadog Real User Monitoring is a digital experience monitoring platform that captures real user sessions, surfaces behavioral data through heatmaps and funnels, tracks frontend performance metrics, and connects user-facing signals directly to backend traces and logs.
Who Is Datadog Real User Monitoring Best For?
Datadog RUM is a strong fit for engineering and product teams that need to connect frontend user behavior directly to backend performance data in a single platform.
Why I Picked Datadog Real User Monitoring
Datadog RUM earns its spot on my shortlist because it's the only tool I've used where a rage click on a checkout button connects directly to a backend trace showing a slow database query. I love that RUM Without Limits lets you ingest every session, calculate performance metrics across all of them, and then selectively retain only the ones that matter, like sessions with errors or abandoned purchases. Watchdog Insights automatically surfaces outliers, flagging when a specific app version or browser is driving a spike in frustration signals.
Datadog Real User Monitoring Key Features
- RUM Without Limits: Ingest 100% of user sessions and use no-code retention filters to keep only the sessions that matter, such as those with errors or abandoned purchases.
- Frustration signals dashboard: Automatically collects rage clicks, dead clicks, and error clicks, and surfaces them in a dedicated dashboard with replay timeline markers.
- Mobile session replay: Captures native iOS and Android sessions as wireframe-based replays, with separate privacy controls for text, images, and touches.
- Error Tracking: Groups frontend errors into issues with source-mapped stack traces, crash reports, and visibility into which user segments are affected.
Datadog Real User Monitoring Integrations
Datadog RUM integrates natively with APM, Log Management, Synthetics, Error Tracking, Profiling, Feature Flags, Jira, Slack, and Confluence. It also offers a Zendesk Marketplace app, APIs for custom integrations, and access to more than 1,000 integrations across the Datadog platform.
Pros and Cons
Pros:
- Surfaces rage clicks and error outliers
- Captures every session before retention filtering
- Correlates frontend friction with backend traces
Cons:
- Requires manually building experience scores
- Heatmaps exclude mobile sessions
Learn more about Datadog Real User Monitoring:
Diğer Kullanıcı Deneyimi İzleme Araçları
Kısa listeme giremeyen ancak yine de göz atmaya değer bazı ek kullanıcı deneyimi izleme aracı seçenekleri şunlardır:
- 11LogRocketBest for AI-driven error and friction triage
- 12New Relic Browser MonitoringBest for engineering-led UX and frontend debugging
- 13Crazy EggBest for A/B testing with behavioral data
- 14SmartlookBest for web and mobile behavior analysis
- 15SplunkBest for visualizing UX data across full-stack traces
- 16OpenReplayBest for open-source session replay and debugging
- 17Microsoft ClarityBest for free, no-limit behavioral analytics
How I Evaluate User Experience Monitoring Tools
I split my evaluation into three parts. Core functionality—capturing real user sessions and visualizing behavior through heatmaps—carries the most weight. Then I look at distinguishing features like privacy masking controls, and finally consider onboarding speed and pricing value.
Core Functionality (Table Stakes For This List)
When I'm selecting tools for my list, I score each one on a scale from 0 (does not offer the functionality) to 5 (excels in this area) for each core functionality listed below. I then convert the total into a percentage to help assess each tool's overall fit, with extra weight on any functionalities I've deemed essential.
- Session Capture (Essential): I evaluate replay fidelity, search filters, and cross-device coverage to see if I can trace a single user's path from entry to drop-off.
- Behavioral Visualization (Essential): Heatmap variety matters here. I look for click, scroll, and movement maps with segment filtering so I can compare behavior across cohorts.
- Frontend Performance Monitoring: I check whether the tool ties page load times and latency back to specific user sessions, not just aggregate dashboards disconnected from real behavior.
- Friction and Error Detection: Rage clicks and dead clicks are table stakes. I look for tools that surface JavaScript errors alongside the session where they occurred.
- Funnel and Journey Analysis: I evaluate how easily I can build multi-step funnels and spot where users abandon a flow, like a checkout sequence or onboarding wizard.
- Experience Scoring and Alerting: Real-time alerts that flag experience degradations before users complain are what I'm after. Tools like Dynatrace and Contentsquare approach this differently.
Once I have a list of tools that meet the criteria, I consider what sets each platform apart.
Differentiating Factors (What Sets Vendors Apart)
Here's how I compare and contrast different vendors:
Standout Features
Privacy masking controls matter most when your product handles sensitive data. I evaluate how granularly each tool lets you redact PII—Hotjar and FullStory handle this differently, and the gap shows up fast in regulated industries. Cross-platform mobile support is the other dealbreaker. I check whether heatmaps and session replay extend to native iOS and Android apps, not just mobile web views. If your team ships across platforms, tools that only cover the browser leave major blind spots in your behavioral data.
Beyond Features
I evaluate how quickly a tool gets to first insight. Some platforms, like FullStory, offer tag-manager deployment that skips lengthy engineering cycles, while others require dedicated SDK work that can stall a rollout. Compliance alignment matters just as much—I check for built-in consent management and data residency options, especially for teams shipping products across multiple jurisdictions. I also look at native integrations with tools like Jira, Amplitude, and Slack, since behavioral insights lose value when they sit outside your team's actual workflow.
Kullanıcı Deneyimi İzleme Aracı Nasıl Seçilir?
Uzun özellik listeleri ve karmaşık fiyatlandırma yapıları içinde kaybolmak kolaydır. Kendinize özgü yazılım seçim sürecinizde ilerlerken odağınızı korumanıza yardımcı olmak için göz önünde bulundurmanız gereken faktörlerin kontrol listesi aşağıdadır:
| Faktör | Göz önünde bulundurulması gerekenler |
| Ölçeklenebilirlik | Aracın işletmenizle birlikte büyüyebildiğinden emin olun. Yavaşlamadan artan kullanıcı verilerini işleyip işleyemeyeceğini değerlendirin. |
| Entegrasyonlar | İş akışlarını kolaylaştırmak için aracın CRM, CMS veya analiz platformları gibi mevcut sistemlerinizle entegre olup olmadığını kontrol edin. |
| Özelleştirilebilirlik | Panoları ve raporları ekibinizin özel ihtiyaçlarına ve hedeflerine uyacak şekilde düzenleme seçenekleri sunan araçları arayın. |
| Kullanım Kolaylığı | Ekibinizin öğrenme süresini en aza indiren sezgisel bir arayüze sahip bir araç seçin. |
| Bütçe | Aracın parasının karşılığını verip vermediğini ve fiyatlandırmasının bütçe kısıtlamalarınıza uygun olup olmadığını değerlendirin. |
| Güvenlik Önlemleri | Aracın veri koruma düzenlemelerine uyduğundan ve kullanıcı verilerini korumak için gerekli önlemlere sahip olduğundan emin olun. |
| Destek | Canlı sohbet, e-posta ve telefon seçenekleri de dâhil olmak üzere müşteri desteğinin kalitesini ve kullanılabilirliğini değerlendirin. |
| Performans | Aracın gerçek zamanlı veri işlemede ne kadar iyi performans gösterdiğini ve sürekli izleme için ne kadar güvenilir olduğunu değerlendirin. |
Kullanıcı Deneyimi İzleme Araçlarındaki Trendler
Araştırmam sırasında farklı kullanıcı deneyimi izleme aracı sağlayıcılarının sayısız ürün güncellemesini, basın bültenini ve sürüm günlüğünü inceledim. Takip ettiğim yükselen trendlerden bazıları şunlar:
- Yapay Zekâ Destekli İçgörüler: Birçok araç, kullanıcı davranışına ilişkin daha derin içgörüler sunmak için artık yapay zekâ kullanıyor. Bu, ekiplerin kullanıcı ihtiyaçlarını öngörmesine ve deneyimleri buna göre uyarlamasına yardımcı oluyor. Dynatrace gibi sağlayıcılar, izleme yeteneklerini geliştirmek için yapay zekâdan yararlanıyor.
- Gerçek Zamanlı İş Birliği: Araçlar, ekiplerin kullanıcı verileri üzerinde gerçek zamanlı olarak iş birliği yapmasına olanak tanıyan özellikler ekliyor. Bu, daha hızlı karar alma ve sorun çözme süreçlerini destekliyor. Örneğin Fullstory, ekip iş akışlarını geliştirmek için gerçek zamanlı iş birliği özellikleri sunuyor.
- Gizlilik Odaklı Özellikler: Gizlilik endişeleri arttıkça araçlar, işletmelerin gizliliğe saygı gösterirken kullanıcı deneyimlerini izlemesine olanak tanıyan özellikleri entegre ediyor. Bu özellikler arasında kullanıcı verilerini anonimleştirme ve uyumluluk araçları sunma yer alıyor; bunlar birçok platformda standart hâle geliyor.
- Cihazlar Arası Analiz: Kullanıcı davranışını birden fazla cihazda anlamak giderek daha önemli hâle geliyor. Araçlar artık kullanıcı yolculuklarını kolayca izlemek için daha kapsamlı cihazlar arası analiz sunuyor. Nexthink, ayrıntılı cihazlar arası izlemeyi mümkün kılan özellikleri kullanıma sundu.
- Kullanıcı Yolculuğu Haritalama: Araçlar, kullanıcının attığı her adımı görselleştirmek için ayrıntılı kullanıcı yolculuğu haritaları sunmaya odaklanıyor. Bu, işletmelerin sorunlu noktaları belirlemesine ve kullanıcı deneyimini optimize etmesine yardımcı oluyor. Contentsquare gibi şirketler, gelişmiş yolculuk haritalama özellikleriyle öne çıkıyor.
Deneyim İzleme Aracı Nedir?
Kullanıcı deneyimi izleme araçları, kullanıcıların bir web sitesi veya uygulamayla nasıl etkileşim kurduğunu izlemek ve analiz etmek için tasarlanmış yazılım çözümleridir. Bu araçlar, kullanıcı memnuniyetini artırmak ve dijital deneyimleri optimize etmek için genellikle UX tasarımcıları, ürün yöneticileri ve dijital pazarlamacılar tarafından kullanılır. Gerçek zamanlı analizler, oturum tekrarları ve ısı haritaları, ekiplerin kullanıcı davranışını anlamasına ve iyileştirme alanlarını belirlemesine yardımcı olur. Genel olarak bu araçlar, geliştirilmiş kullanıcı deneyimlerine ve daha iyi iş sonuçlarına katkı sağlayan değerli içgörüler sunar.
Kullanıcı Deneyimi İzleme Araçlarının Özellikleri
- Gerçek zamanlı analizler: Performans ölçümlerini izleyin ve gecikme sorunlarını anında tespit edin; ekiplerin sorun giderme ve temel neden analizi yapmasına, ayrıca güncellemeler hakkında otomatik bildirimler almasına yardımcı olun.
- Oturum tekrarları & ısı haritaları: Etkileşimi etkileyen sorunlu noktaları ve performans darboğazlarını görselleştirerek davranışı son kullanıcının bakış açısından analiz edin.
- Yapay zekâ destekli içgörüler: Örüntüleri ortaya çıkarmak, davranışı öngörmek, karşılaştırma ölçütleri oluşturmak ve kullanıcı deneyimi ölçümlerini geliştirmek için yapay zekâ destekli analizlerden yararlanın.
- Cihazlar arası izleme: Sayfa yükleme sürelerini ve arka uç bağlantısını izlerken cihazlar arasında tutarlı bir kullanıcı deneyimi sağlayın.
- Özelleştirilebilir panolar: Uyarlanmış raporlamayla temel KPI'lara ve performans göstergelerine odaklanın.
- Gizlilik odaklı & uyumluluk özellikleri: Bulut tabanlı çözümler, anonimleştirme araçları ve mevzuata uyumluluk için yerleşik gözlemlenebilirlik özellikleriyle kullanıcı verilerini korur.
- İş birliği araçları: Verileri ilişkilendirmek ve karar alma süreçlerini geliştirmek için içgörüleri ekipler arasında paylaşın.
Kullanıcı Deneyimi İzleme Araçlarının Faydaları
Son kullanıcı deneyimi izleme (EUEM) araçlarının uygulanması, ekibiniz ve işletmeniz için çeşitli avantajlar sunar:
- Daha yüksek kullanıcı memnuniyeti: Bu tür bir izleme çözümü, sorunlu noktaların belirlenmesine ve düzeltilmesine yardımcı olmak için oturum tekrarlarına ve ısı haritalarına olanak tanır ve genel son kullanıcı deneyimini geliştirir.
- Veriye dayalı karar alma: Gerçek zamanlı analizler ve yapay zekâ destekli içgörüler sayesinde ekipler, performans verilerine ve kullanıcı davranışına dayalı bilinçli seçimler yapabilir.
- Geliştirilmiş web sitesi performansı: Performans izleme, daha hızlı sayfa yükleme süreleri sağlayarak hemen çıkma oranlarını azaltır ve etkileşimi artırır.
- Geliştirilmiş sorun giderme: Gözlemlenebilirlik araçlarıyla performans darboğazlarının temel nedenlerini belirleyerek sorunların daha hızlı giderilmesini sağlayın.
- Daha güçlü ekipler arası iş birliği: İş birliği araçları, bulguların paylaşılmasını kolaylaştırarak DevOps, pazarlama ve BT ekipleri arasındaki uyumu geliştirir.
- Daha yüksek dönüşüm oranları: Gerçek etkileşim verilerine dayalı kullanıcı yolculuklarını optimize etmek, dönüşüm oranlarını ve geliri artırabilir.
- Gizlilik uyumluluğu: Yerleşik gizlilik kontrolleri, kullanıcı güvenini korurken mevzuata uyumluluğun sürdürülmesine yardımcı olur.
- Cihazlar arasında tutarlı deneyim: Son kullanıcı izleme, kullanıcıların tüm cihazlarda ve platformlarda sorunsuz bir deneyim yaşamasını sağlar.
Kullanıcı Deneyimi İzleme Araçlarının Maliyetleri ve Fiyatlandırması
Kullanıcı deneyimi izleme araçlarını seçmek, mevcut çeşitli fiyatlandırma modellerinin ve planların anlaşılmasını gerektirir. Maliyetler özelliklere, ekip büyüklüğüne, eklentilere ve diğer unsurlara göre değişir. Aşağıdaki tablo, kullanıcı deneyimi izleme aracı çözümlerinde yaygın planları, bunların ortalama fiyatlarını ve genellikle sunulan özellikleri özetlemektedir:
Kullanıcı Deneyimi İzleme Araçları için Plan Karşılaştırma Tablosu
| Plan Türü | Ortalama Fiyat | Yaygın Özellikler |
| Ücretsiz Plan | $0 | Temel analizler, sınırlı oturum tekrarları ve minimum veri depolama. |
| Kişisel Plan | $5-$25 /kullanıcı /ay | Gelişmiş analizler, ısı haritaları, oturum tekrarları ve e-posta desteği. |
| İşletme Planı | $30-$100 /kullanıcı /ay | Kapsamlı analizler, kullanıcı yolculuğu haritalama, öncelikli destek ve özel API entegrasyonları. |
| Kurumsal Plan | $100+ /kullanıcı/ay | Özelleştirilebilir panolar, özel hesap yönetimi, tam veri erişimi ve SLA destekli destek. |
Kullanıcı Deneyimi İzleme Araçları SSS
Kullanıcı deneyimi izleme araçlarıyla ilgili yaygın soruların bazı yanıtları aşağıdadır:
Bir uygulama veya web sitesi kullanılırken kullanıcının deneyimini izlemek için hangi izleme aracı kullanılır?
Gerçek Kullanıcı İzleme (RUM) araçları, bir yazılım uygulamasındaki her kullanıcı etkileşimini gerçek zamanlı olarak yakalamak ve analiz etmek için kullanılır. Kullanıcıları simüle eden sentetik izleme araçlarının aksine, gerçek kullanıcıların deneyimlerine ilişkin içgörüler sağlarlar. RUM, gerçek dünyadaki kullanıcı etkileşimlerini anlamanıza ve uygulama deneyimini iyileştirmenize yardımcı olur.
APM ile dijital deneyim izleme arasındaki fark nedir?
Uygulama Performans Yönetimi (APM), uygulama performansını teknik açıdan izlemeye ve teknoloji yığınını optimize etmeye odaklanır. Dijital Deneyim İzleme (DEM), uygulama performansının kullanıcı üzerindeki etkisini ölçer. Performans sorunlarının kullanıcı memnuniyetini ve etkileşimini nasıl etkilediğine ilişkin içgörüler sağlar.
Son kullanıcının deneyimini nasıl ölçersiniz?
Son kullanıcı deneyimini ölçmek, hem nicel hem de nitel verilerin analiz edilmesini gerektirir. Nicel ölçümler arasında görev tamamlama oranları, hata oranları ve görevler için harcanan süre yer alır. Bu ölçümler, kullanılabilirliği ve verimliliği anlamanıza yardımcı olarak kullanıcıların uygulamanızla nasıl etkileşim kurduğuna ilişkin içgörüler sağlar.
Kullanıcı deneyimi izleme işletmeme nasıl katkı sağlayabilir?
Kullanıcı deneyimi izleme, sorun yaşanan alanları ve iyileştirme fırsatlarını belirleyerek işletmenize yardımcı olur. Kullanıcı davranışını anlayarak dijital ürünlerinizi memnuniyeti artıracak ve dönüşüm oranlarını yükseltecek şekilde optimize edebilirsiniz. Bu, daha iyi müşteri sadakati ve genel işletme büyümesi sağlar.
Kullanıcı deneyimi izleme araçlarını uygulamadaki zorluklar nelerdir?
Zorluklar arasında araçların mevcut sistemlerle entegre edilmesi, veri gizliliğinin sağlanması ve büyük miktarlardaki verilerin işlenmesi yer alır. Ekibinizin teknik uzmanlığı ve altyapısıyla uyumlu bir araç seçmek önemlidir. Doğru uygulama, izleme araçlarından en yüksek değeri elde etmenizi sağlar.
Gizlilik düzenlemeleri kullanıcı deneyimi izlemeyi nasıl etkiler?
Gizlilik düzenlemeleri, kullanıcı verilerini sorumlu bir şekilde işlemenizi gerektirir. İzleme araçları, verilerin anonimleştirilmesini ve güvenli bir şekilde saklanmasını sağlayarak GDPR gibi yasalara uymalıdır. Bu, kullanıcı gizliliğini korurken kullanıcı deneyimlerini iyileştirmek için gereken içgörüleri toplamanıza olanak tanır.