

Mixpanel-recension: Fördelar, nackdelar, funktioner och priser förklarade
Mixpanel utmärker sig genom sin intuitiva analys och flexibla händelsespårning, vilket gör plattformen idealisk för datadrivna team, men den kan vara mindre lämpad för dem som söker enkel rapportering som fungerar direkt från start.

We review tools independently, and commissions help fund our testing. See our transparency policy, our methodology, or suggest a tool.
Mixpanel is a free product analysis tool built for product teams that need to track user behavior, analyze conversion funnels, and measure retention across digital products. I'd consider it over Google Analytics if your questions are product-specific—like which features drive activation or where users drop off in a flow—rather than marketing traffic-focused. Mixpanel's event-based data model makes it a better fit for answering those product questions directly, without needing to work around a tool designed for web traffic reporting.
Mixpanel Evaluation Summary
4.5/5
- From $120/month (billed annually)
- Free plan available
Varför du kan lita på våra programvarurekommendationer
6,700+
Reviews
20
Industry experts
16+
Evaluation factors
14
Years
Vårt team har testat och recenserat programvara sedan 2012. Som produktchefer själva vet vi hur svårt — och viktigt — det är att välja rätt programvara.
För den här guiden utvärderade vi verktyg genom praktisk testning och oberoende research, och betygsatte verktygen enligt våra urvalskriterier.
Våra recensioner speglar vårt mänskliga redaktionella omdöme, inte ett säljbudskap.
- Andrew LumbySenior TPM
- Cristiano ValimSenior UI/UX Lead
Mixpanel Overview
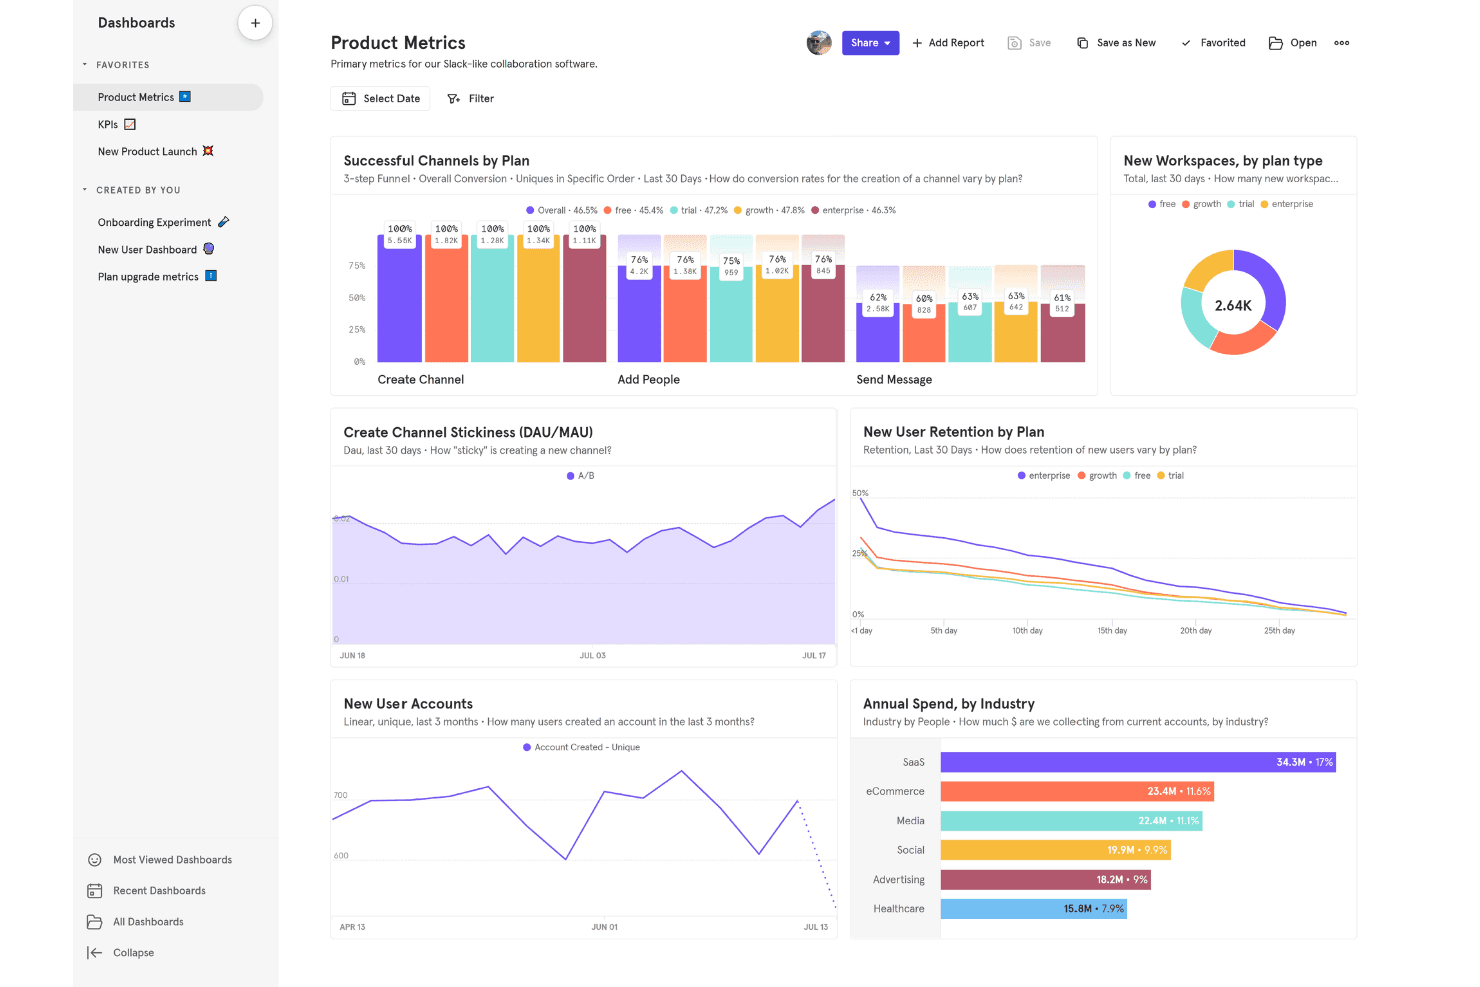
Mixpanel offers advanced event tracking, flexible reporting, and robust analytics capabilities that make it a top choice for teams prioritizing deep product insights. Its pricing is competitive for growth-stage SaaS companies, and onboarding is straightforward with strong documentation. While some integrations require extra setup and support can be slow for free plans, Mixpanel’s customizable dashboards and real-time data analytics outperform many alternatives. It’s best for teams that want to compare user journeys, judge feature adoption, and select a tool that balances power with usability. For example, product managers can quickly determine which features drive retention.
Pros
- Granular event tracking supports detailed user journey analysis
- Real-time reporting enables fast decision-making for product teams
- Customizable dashboards allow tailored views for different stakeholders
Cons
- Advanced analysis features require manual setup and configuration
- Free plan limits data history and core functionality
- Some users report slow response times from customer support
Is Mixpanel Right For Your Needs?
Who Would be a Good Fit for Mixpanel?
Mixpanel is a powerful tool that’s best suited for teams and organizations that need granular, event-based analytics to drive product decisions and optimize user experiences. Its strengths in real-time reporting, customizable dashboards, and detailed cohort analysis make it a strong choice for digital-first businesses, especially those with complex user journeys or rapid product iteration cycles. Mixpanel’s flexibility and depth are especially valuable for SaaS, ecommerce, and mobile-first companies, as well as product and growth teams that need to compare feature adoption and retention metrics.
- SaaS StartupsMixpanel’s event tracking and cohort analysis help SaaS startups understand user activation and retention patterns.
- Mobile App DevelopersMobile teams benefit from Mixpanel’s real-time analytics and funnel tracking for app engagement.
- Ecommerce CompaniesEcommerce teams use Mixpanel to analyze purchase funnels and optimize conversion rates.
- Product Management TeamsProduct managers leverage Mixpanel’s customizable dashboards to monitor feature adoption and user flows.
- Growth Marketing DepartmentsGrowth marketers use Mixpanel’s segmentation tools to test and compare campaign performance.
- Fintech PlatformsFintech companies track user onboarding and transaction flows with Mixpanel’s detailed event analytics.
Who Would be a Bad Fit for Mixpanel?
Mixpanel is less suitable for organizations that need simple, out-of-the-box reporting or those with limited technical resources for setup and maintenance. Companies with basic analytics needs, heavy offline operations, or strict data residency requirements may find Mixpanel’s advanced features unnecessary or difficult to implement. Teams looking for all-in-one marketing analytics or those with minimal digital touchpoints may not realize the full value of Mixpanel’s capabilities.
- Small Local BusinessesLocal businesses with limited digital presence won’t benefit from Mixpanel’s advanced analytics.
- Nonprofit OrganizationsNonprofits with basic reporting needs may find Mixpanel’s features excessive.
- Traditional RetailersRetailers focused on in-store sales lack the digital events Mixpanel tracks.
- HR DepartmentsHR teams rarely need the user journey analytics Mixpanel specializes in.
- Manufacturing CompaniesManufacturers with offline processes won’t use Mixpanel’s event-based tracking.
- Legal FirmsLegal practices typically lack the digital product flows Mixpanel is designed to analyze.
How We Test & Score Tools
We’ve spent years building, refining, and improving our software testing and scoring system. The rubric is designed to capture the nuances of software selection and what makes a tool effective, focusing on critical aspects of the decision-making process.
Below, you can see exactly how our testing and scoring works across seven criteria. It allows us to provide an unbiased evaluation of the software based on core functionality, standout features, ease of use, onboarding, customer support, integrations, customer reviews, and value for money.
Core Functionality (25% of final scoring)
The starting point of our evaluation is always the core functionality of the tool. Does it have the basic features and functions that a user would expect to see? Are any of those core features locked to higher-tiered pricing plans? At its core, we expect a tool to stand up against the baseline capabilities of its competitors.
Standout Features (25% of final scoring)
Next, we evaluate uncommon standout features that go above and beyond the core functionality typically found in tools of its kind. A high score reflects specialized or unique features that make the product faster, more efficient, or offer additional value to the user.
We also evaluate how easy it is to integrate with other tools typically found in the tech stack to expand the functionality and utility of the software. Tools offering plentiful native integrations, 3rd party connections, and API access to build custom integrations score best.
Ease of Use (10% of final scoring)
We consider how quick and easy it is to execute the tasks defined in the core functionality using the tool. High scoring software is well designed, intuitive to use, offers mobile apps, provides templates, and makes relatively complex tasks seem simple.
Onboarding (10% of final scoring)
We know how important rapid team adoption is for a new platform, so we evaluate how easy it is to learn and use a tool with minimal training. We evaluate how quickly a team member can get set up and start using the tool with no experience. High scoring solutions indicate little or no support is required.
Customer Support (10% of final scoring)
We review how quick and easy it is to get unstuck and find help by phone, live chat, or knowledge base. Tools and companies that provide real-time support score best, while chatbots score worst.
Customer Reviews (10% of final scoring)
Beyond our own testing and evaluation, we consider the net promoter score from current and past customers. We review their likelihood, given the option, to choose the tool again for the core functionality. A high scoring software reflects a high net promoter score from current or past customers.
Value for Money (10% of final scoring)
Lastly, in consideration of all the other criteria, we review the average price of entry level plans against the core features and consider the value of the other evaluation criteria. Software that delivers more, for less, will score higher.
Core Features
Event Tracking
Track every user action in your product, from clicks to purchases. Define custom events to analyze specific behaviors and measure engagement.
Funnel Analysis
Visualize user drop-off at each step of a workflow or conversion path. Identify bottlenecks and optimize onboarding or checkout flows.
Cohort Analysis
Group users by shared behaviors or attributes to compare retention and engagement over time. Monitor how product changes impact specific user segments.
Custom Dashboards
Build tailored dashboards with charts and metrics relevant to your team. Share real-time insights across departments for faster decision-making.
Segmentation
Filter and break down data by user properties, actions, or timeframes. Uncover trends and patterns among different user groups.
A/B Testing Analytics
Measure the impact of experiments on user behavior directly within Mixpanel. Quickly see which product changes drive better outcomes.
Ease of Use
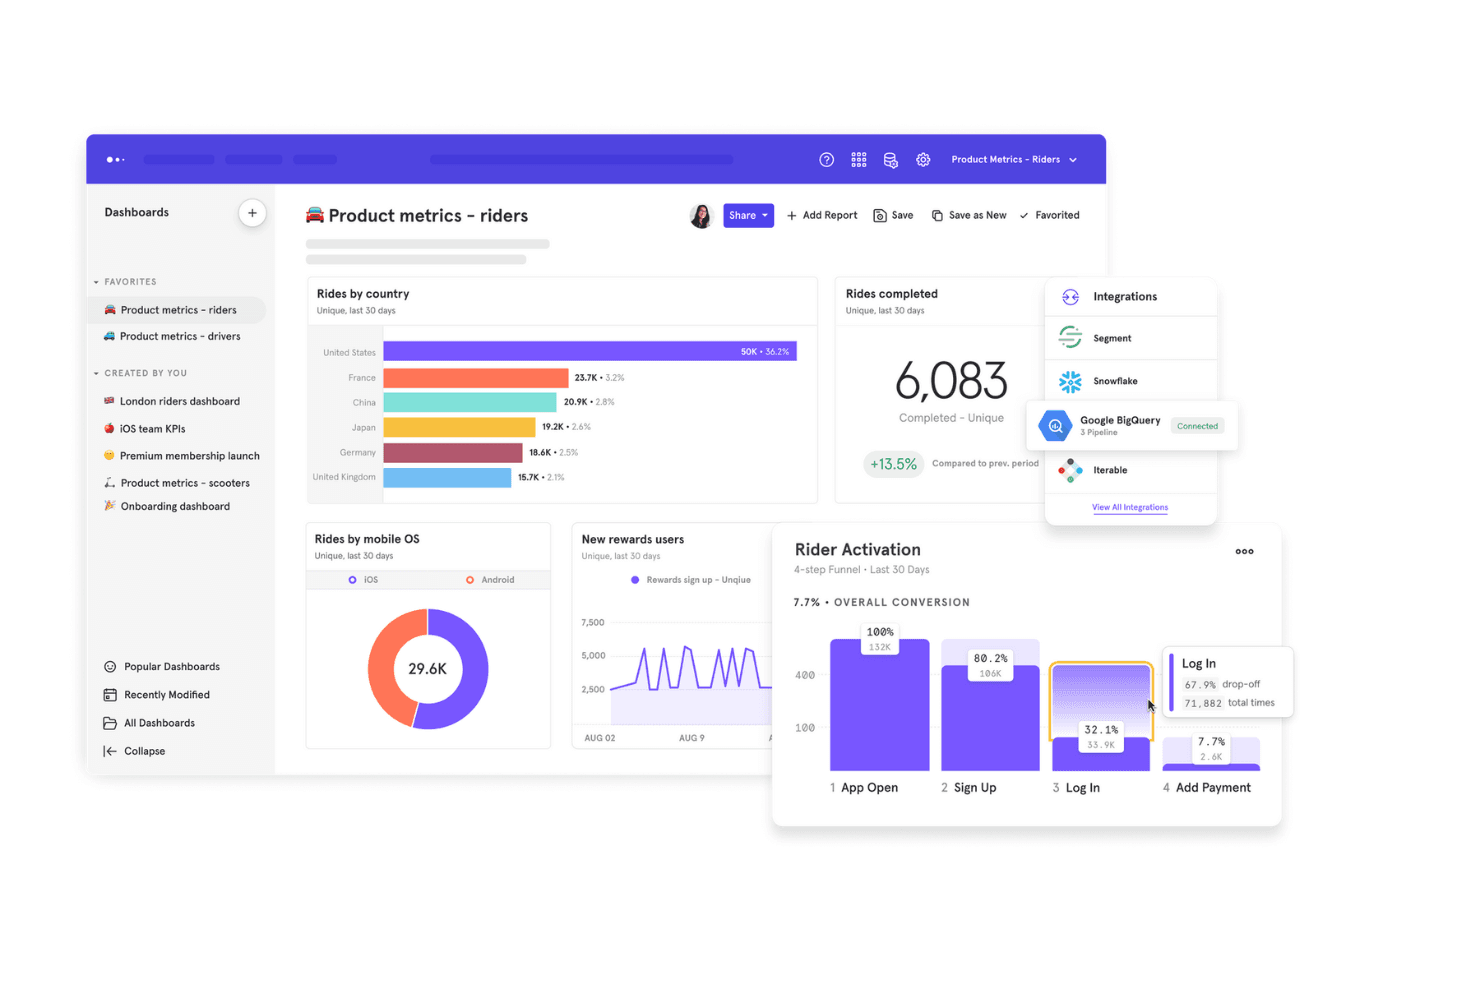
Mixpanel offers a clean, intuitive interface that makes exploring data and building reports straightforward for most users. Its drag-and-drop dashboard builder and guided setup help teams get started quickly, even without deep analytics experience. However, advanced features like custom event tracking and data modeling may require technical input, which some users find challenging. Overall, Mixpanel balances accessibility with depth, making it user-friendly for product teams while still supporting complex analysis.
Integrations
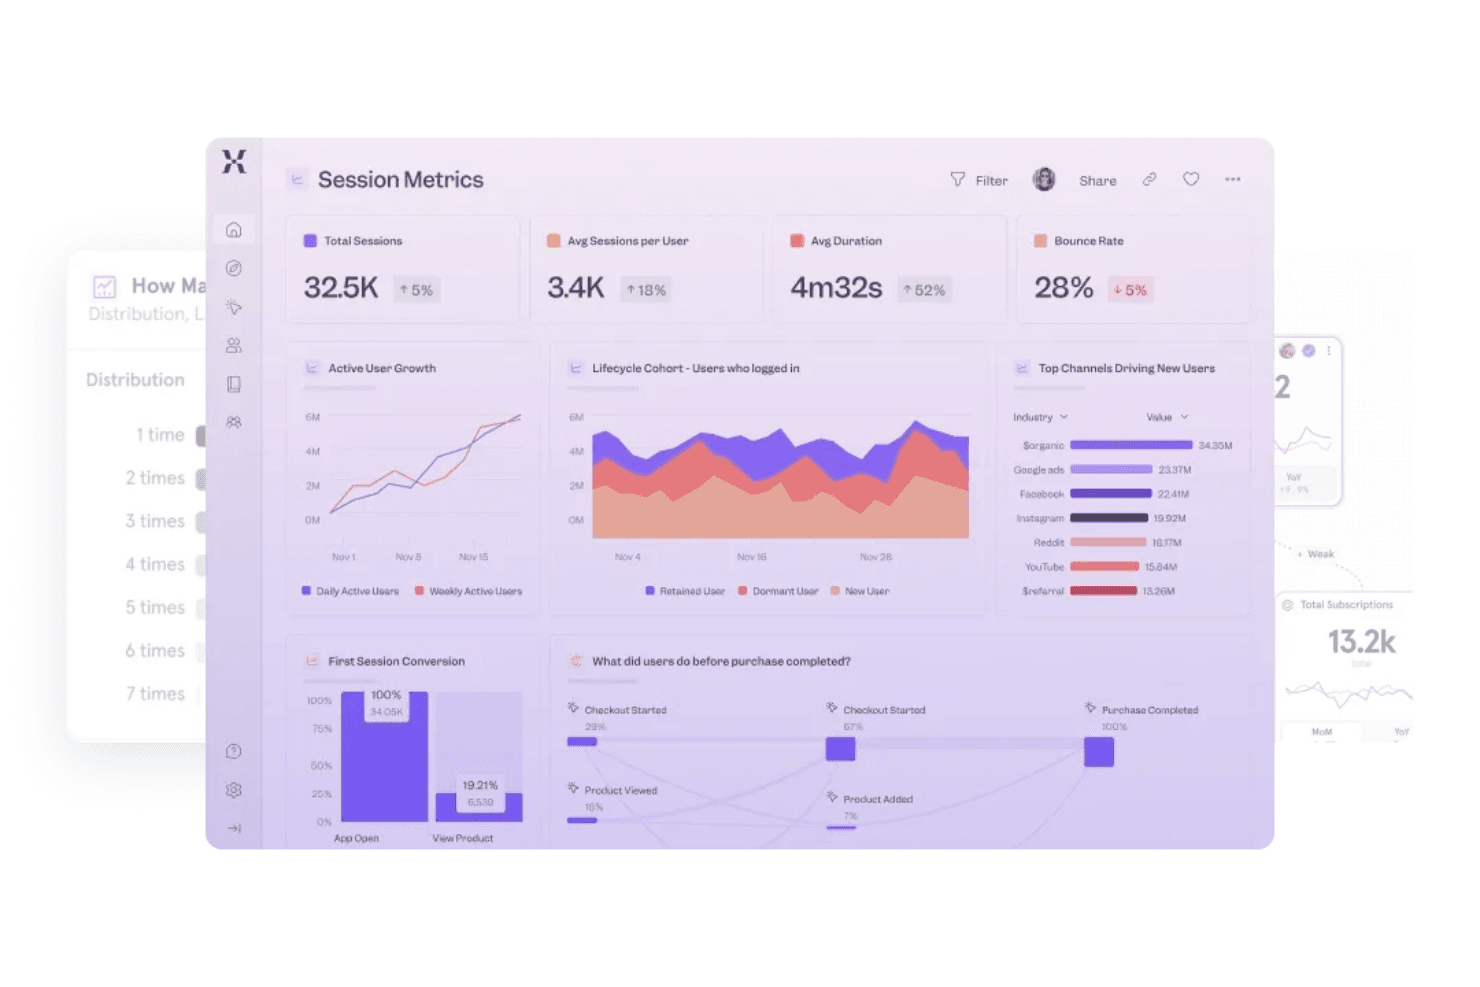
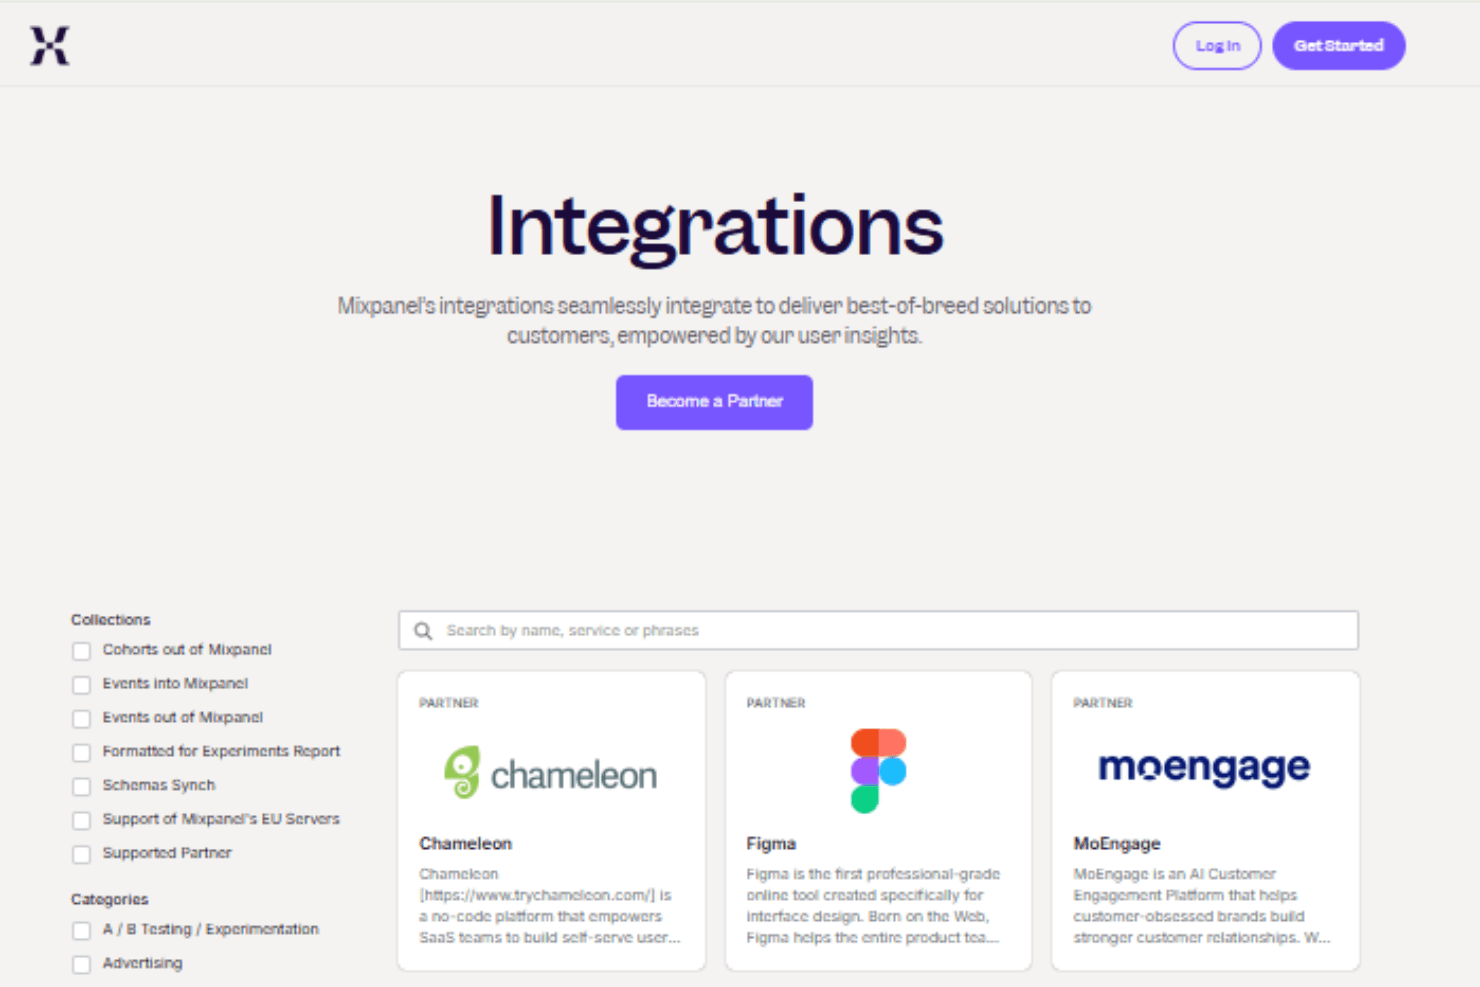
Mixpanel integrates with tools like Segment, Zoho, Mailchimp, Facebook Ads, and Workato, among others.
It also offers APIs and supports third-party integration platforms for custom workflows and data synchronization.
Mixpanel Specs
- A/B Testing: Yes
- AI Integration: Yes
- Analytics: Yes
- API: Yes
- Comparative Reporting: Yes
- Conversion Tracking: Yes
- Custom Reports: Yes
- Dashboard: Yes
- Dashboards: Yes
- Data Export: Yes
- Data Import: Yes
- Data Mining: Yes
- Data Visualization: Yes
- External Integrations: Yes
- Feedback Management: Yes
- Forecasting: Yes
- Historical Data Analysis: Yes
- Keyword Tracking: Yes
- Link Tracking: Yes
- Multi-Site: Yes
- Multi-User: Yes
- Notifications: Yes
- Process Reporting: Yes
- Real-time Alerts: Yes
- Referral Tracking: Yes
- Reports: Yes
- Scenario Planning: Yes
- SEO: Yes
- Time Series Modeling: Yes
- Visualization: Yes
- Workflow Management: Yes


