

Uma alternativa sólida ao Adobe Analytics oferece ferramentas fiáveis de análise da UX, acompanhamento de sessões, informações sobre conversões e visibilidade real do percurso do utilizador — sem exigir a escala ou o compromisso do ecossistema da Adobe. Se está à procura de alternativas ao Adobe Analytics, é provável que procure plataformas que ofereçam uma recolha de dados flexível, relatórios relevantes e métricas da experiência do utilizador adaptadas ao seu fluxo de trabalho. Escolher a ferramenta certa permite à sua equipa identificar pontos de fricção, validar alterações ao produto e definir prioridades de melhoria com confiança. Neste guia, encontrará uma comparação atualizada das principais alternativas ao Adobe Analytics, com foco na usabilidade no mundo real e na profundidade da análise de produtos, para que possa tomar uma decisão informada neste 2026.
O que é o Adobe Analytics?
O Adobe Analytics é uma plataforma de análise digital para acompanhar, medir e analisar as interações dos utilizadores em websites, aplicações e canais digitais. Ajuda as empresas a recolher dados em tempo real, criar relatórios personalizados e visualizar o percurso do cliente desde a primeira visita até à conversão. As equipas utilizam o Adobe Analytics para identificar tendências, segmentar públicos e apoiar a tomada de decisões com base em dados fiáveis sobre o comportamento e as conversões.
Tabela de comparação: alternativas ao Adobe Analytics
Esta tabela de comparação resume os detalhes dos preços das minhas principais escolhas de alternativas ao Adobe Analytics.
| Tool | Best For | Trial Info | Price | ||
|---|---|---|---|---|---|
| 1 | Best for unified web and app session tracking | Free plan available | From $50,000/year (billed annually) | Website | |
| 2 | Best for real-time cross-device experience data | Free demo available | Pricing upon request | Website | |
| 3 | Best for event-based behavioural insights | Free plan available | From $120/month (billed annually) | Website | |
| 4 | Best for pinpointing friction points visually | Free plan available | Pricing upon request | Website | |
| 5 | Best for product feature usage analysis | Free plan + free demo available | Pricing upon request | Website | |
| 6 | Best for visualizing digital user journeys | Free demo available | Pricing upon request | Website | |
| 7 | Best for individual-level customer journey analysis | Free demo + 30-day free trial available | From $999/month | Website | |
| 8 | Best for open-source deployment flexibility | Free plan available | Pricing upon request | Website | |
| 9 | Best for processing intent via session replays | Free plan + free demo + 15-day free trial available | From $39/month (billed annually) | Website | |
| 10 | Best for privacy-focused hosting control | Free plan + free trial available | From €275/month | Website |


Why Trust Our Software Recommendations
6,700+
Reviews
20
Industry experts
16+
Evaluation factors
14
Years
Our team has been testing and reviewing software since 2012. As product managers ourselves, we know how difficult—and important—it is to choose the right software.
For this guide, we evaluated tools using hands-on testing and independent research, scoring tools using our selection criteria.
Our reviews reflect our human editorial judgment, not a sales pitch.
Expert reviewers:
- Andrew LumbySenior TPM
- Cristiano ValimSenior UI/UX Lead


Avaliações das melhores alternativas ao Adobe Analytics
Abaixo encontram-se os meus resumos detalhados das melhores alternativas ao Adobe Analytics que entraram na minha seleção. As minhas avaliações apresentam uma análise detalhada das funcionalidades, dos melhores casos de utilização e das integrações de cada plataforma, para o ajudar a encontrar a melhor opção para si.
 Best for unified web and app session tracking
- Free plan available
- From $50,000/year (billed annually)
Visit WebsiteCustomer Rating:4.6/5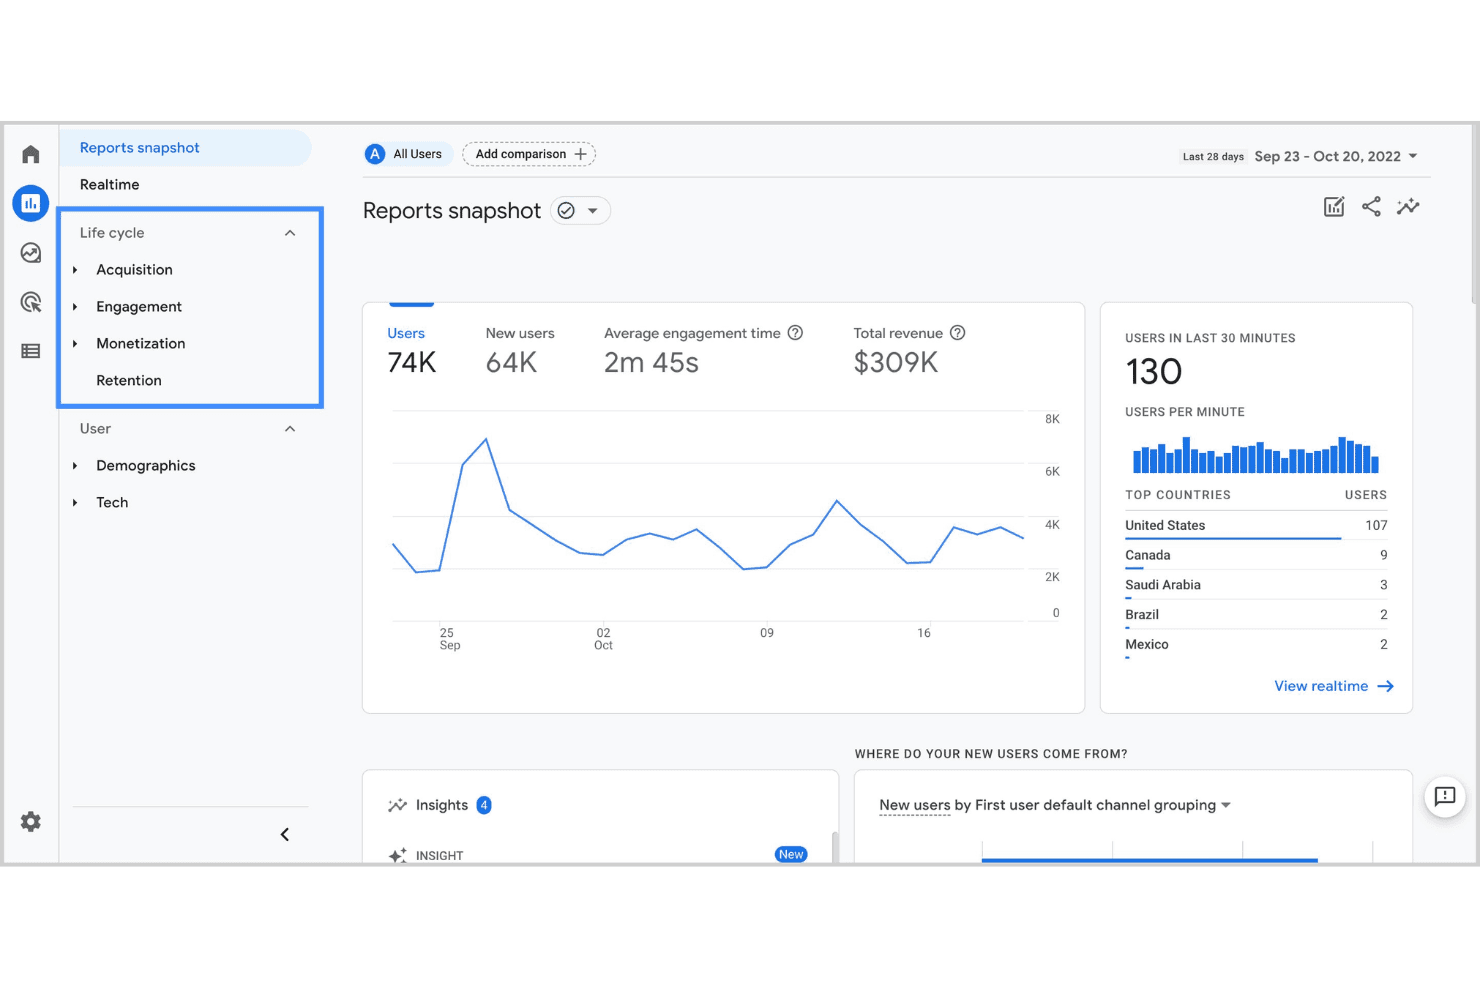
Google Analytics dashboard for unified web and app performance tracking. Google Analytics is a web and app analytics platform from Google that helps marketing and product teams track user sessions, measure traffic sources, and understand how visitors interact with their digital properties.
Who Is Google Analytics Best For?
Google Analytics is a strong fit for small to mid-sized businesses that need accessible, free web analytics without heavy technical setup.
Why Google Analytics Is a Good Adobe Analytics Alternative
I picked Google Analytics as one of the best because its cross-platform session tracking covers both web and app data in a single property. I especially like the Path Exploration feature, which lets me trace exactly how users move across my site and app before converting. The Funnel Exploration report adds another layer, letting me spot where users drop off and validate changes against real session data.
Google Analytics Key Features
- Real-time reporting: Monitor active users, live events, and page activity as they happen across your site or app.
- Audience segmentation: Build custom segments based on user behaviour, demographics, device type, or traffic source.
- Custom event tracking: Define and track specific user interactions, like button clicks or video plays, beyond default pageview data.
- Attribution modelling: Compare multiple attribution models to understand which channels and touchpoints contribute to conversions.
Google Analytics Integrations
Google Analytics offers native integrations with Google Ads, Shopify, HubSpot, and Squarespace, as well as Google Search Console, Google Cloud, Firebase, and Google Sheets. It also works alongside Microsoft Clarity for session-level UX insights. An API is available for custom integrations, and it connects with Zapier.
Pros and Cons
Pros:
- Flexible event-based tracking setup
- Deep integration with Google marketing tools
- Real-time data updates for active monitoring
Cons:
- Lacks native support for offline data sources
- No built-in customer journey visualization
Learn more about Google Analytics: Best for real-time cross-device experience data
- Free demo available
- Pricing upon request
Visit WebsiteCustomer Rating:4.7/5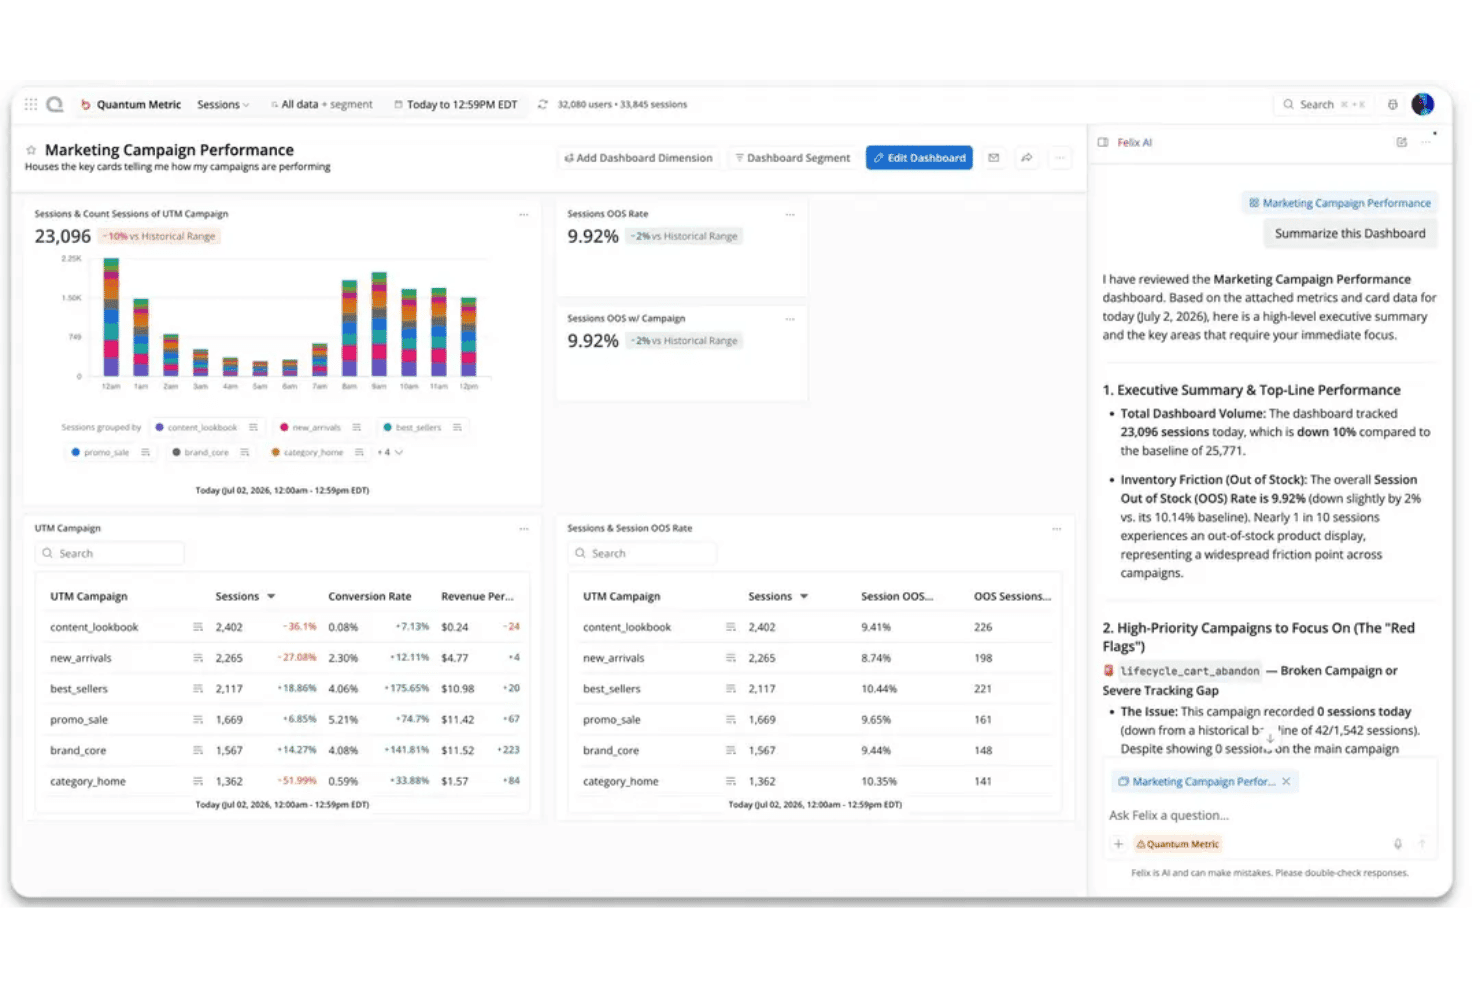
Quantum Metric dashboard with AI insights for real-time experience monitoring. Quantum Metric is a digital experience analytics platform for product and ecommerce teams that helps reveal customer friction across web journeys, making it Best for real-time cross-device experience data.
Who Is Quantum Metric Best For?
Quantum Metric suits product and ecommerce teams at digital businesses that need behavioral insights to diagnose website and app journey issues.
Why Quantum Metric Is a Good Adobe Analytics Alternative
I picked Quantum Metric for its Best for real-time cross-device experience data focus. It combines behavioral insights with web journey analysis, so I can trace where customers encounter friction as they move between devices. I use those patterns to identify specific journey steps for product investigation.
Quantum Metric Key Features
- Heatmaps: Visualize clicks, taps, and scrolling on page elements.
- Cohort retention: Compare how user groups return over time.
- Custom metrics: Define metrics and attributes through the platform interface.
- Technical error tracking: Capture errors and slow-loading elements.
Quantum Metric Integrations
Quantum Metric lists integrations with Adobe Analytics, Google Analytics, Optimizely, Salesforce Service Cloud, Slack, Qualtrics, ServiceNow, Looker, and Tealium. These connections can add experience data to analytics and customer service workflows, or support experimentation and collaboration.
Pros and Cons
Pros:
- Cross-device journeys connect web and app behavior
- Session replays reveal friction behind user behavior
- Real-time monitoring surfaces experience issues quickly
Cons:
- Replay review takes time at scale
- Replay search can miss sessions
Learn more about Quantum Metric: Best for event-based behavioural insights
- Free plan available
- From $120/month (billed annually)
Visit WebsiteCustomer Rating:4.5/5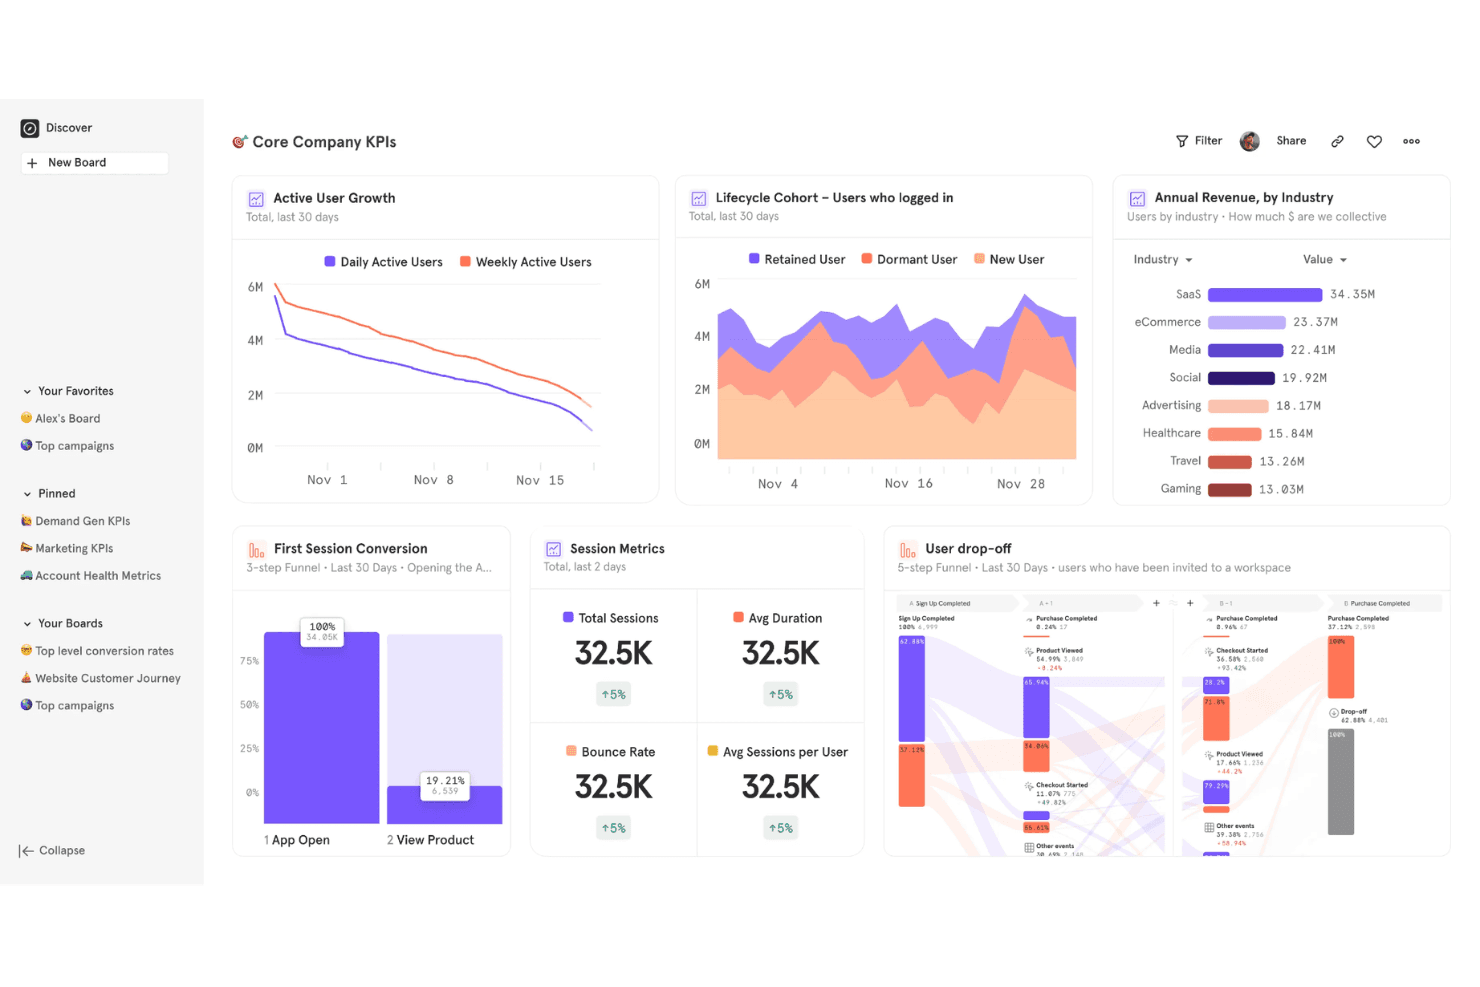
Mixpanel offers a Core Company KPIs dashboard featuring active user growth, lifecycle cohort analysis, annual revenue by industry, session metrics, and user drop-off funnels. Mixpanel is a product analytics platform that tracks how users interact with your product at the event level, giving product and growth teams granular visibility into feature adoption, retention, and conversion behaviour.
Who Is Mixpanel Best For?
Mixpanel is a strong fit for product managers and growth teams at B2B SaaS and mobile app companies who need to analyze user behaviour beyond pageviews.
Why Mixpanel Is a Good Adobe Analytics Alternative
I picked Mixpanel because event-based tracking is genuinely where it excels over Adobe Analytics. Every user action gets captured as a discrete event, so I can build funnel reports that show exactly where users drop off between specific interactions, not just between pages. I also use its retention charts to see which features keep cohorts coming back week over week, with filters I can apply without writing a single query.
Mixpanel Key Features
- User flows: Visualize the paths users take through your product after any starting or ending event.
- Custom dashboards: Build shared dashboards that combine multiple reports into a single view for your team.
- Behavioural segmentation: Filter any report by user properties, device type, or prior actions without SQL.
- Lexicon data dictionary: Centrally manage, define, and hide tracked events and properties across your entire project.
Mixpanel Integrations
Mixpanel offers native integrations with Braze, Segment, Google Ads, Facebook Ads, Mailchimp, Salesforce Marketing Cloud, mParticle, Intercom, Appcues, and VWO. An API is available for custom integrations, and it connects with Zapier.
Pros and Cons
Pros:
- Group analytics for B2B account tracking
- Built-in A/B test reporting for experiments
- Retroactive funnel building without code changes
Cons:
- Limited prebuilt dashboards
- Requires event instrumentation for full value
 Best for pinpointing friction points visually
- Free plan available
- Pricing upon request
Visit WebsiteCustomer Rating:4.5/5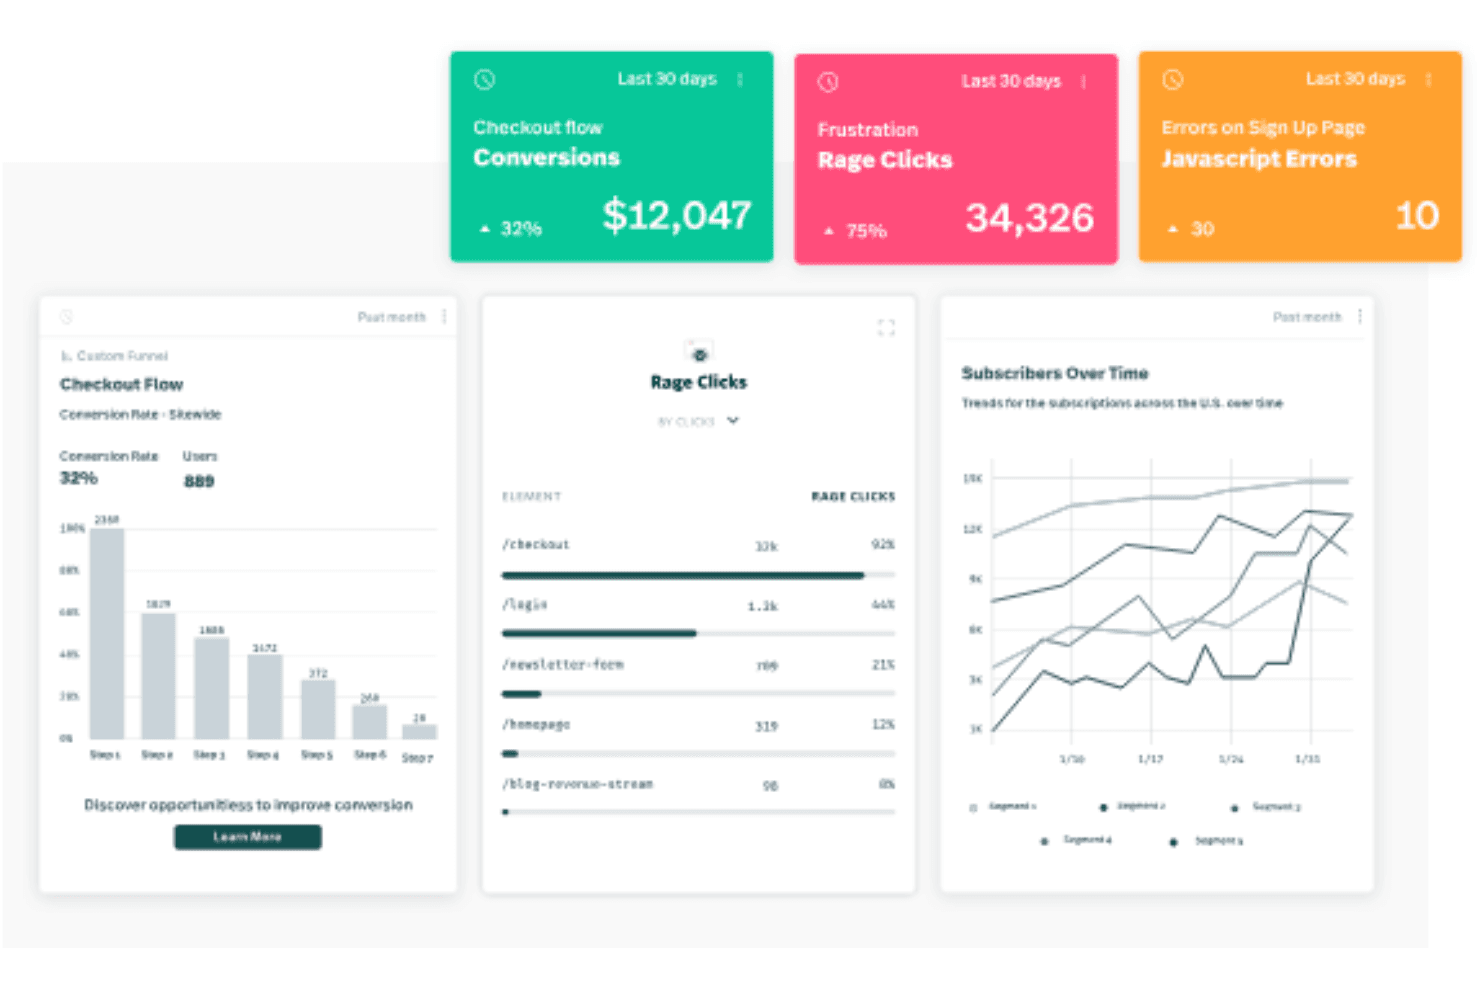
Fullstory offers an analytics dashboard displaying checkout flow conversions, rage clicks, JavaScript errors, funnel steps, and subscriber trends over time. For product managers and UX teams who need to understand exactly where digital experiences break down, FullStory combines session replay, autocapture, and behavioural analytics in one platform.
Who Is FullStory Best For?
FullStory suits ecommerce and SaaS companies that need granular visibility into user behaviour across high-traffic digital products.
Why FullStory Is a Good Adobe Analytics Alternative
I've included FullStory in my top picks because it surfaces friction in a way that raw event data simply can't. Where Adobe Analytics tells you that users dropped off a funnel step, FullStory's heatmaps and session replay show you exactly what happened visually: the rage clicks, the cursor thrashing, the hesitation before abandonment. I also appreciate Sentiment Signals, which automatically flags frustration patterns across sessions without requiring you to set up manual event tracking first.
FullStory Key Features
- Autocapture: Automatically records every user interaction on your site or app without requiring manual event instrumentation upfront.
- Conversion funnel analysis: Lets you build funnels from any captured event to see where users drop off across multi-step flows.
- User journey mapping: Visualizes the full path a user takes across sessions, including page visits, clicks, and form interactions.
- Dev Tools integration: Captures JavaScript errors and network requests alongside session replays so engineers can debug issues in context.
FullStory Integrations
FullStory offers native integrations with Slack, Jira, Trello, Intercom, Google Analytics, Google Tag Manager, Optimizely, Segment, Salesforce, and Microsoft Teams. An API is available for custom integrations, and it connects with Zapier.
Pros and Cons
Pros:
- Conversion funnels visualize multi-step drop-offs
- Rage click detection highlights frustration points
- Session replay shows exact user interactions
Cons:
- Lacks multi-domain tracking capability
- Mobile app analytics are less advanced
Learn more about Fullstory: Best for product feature usage analysis
- Free plan + free demo available
- Pricing upon request
Visit WebsiteCustomer Rating:4.5/5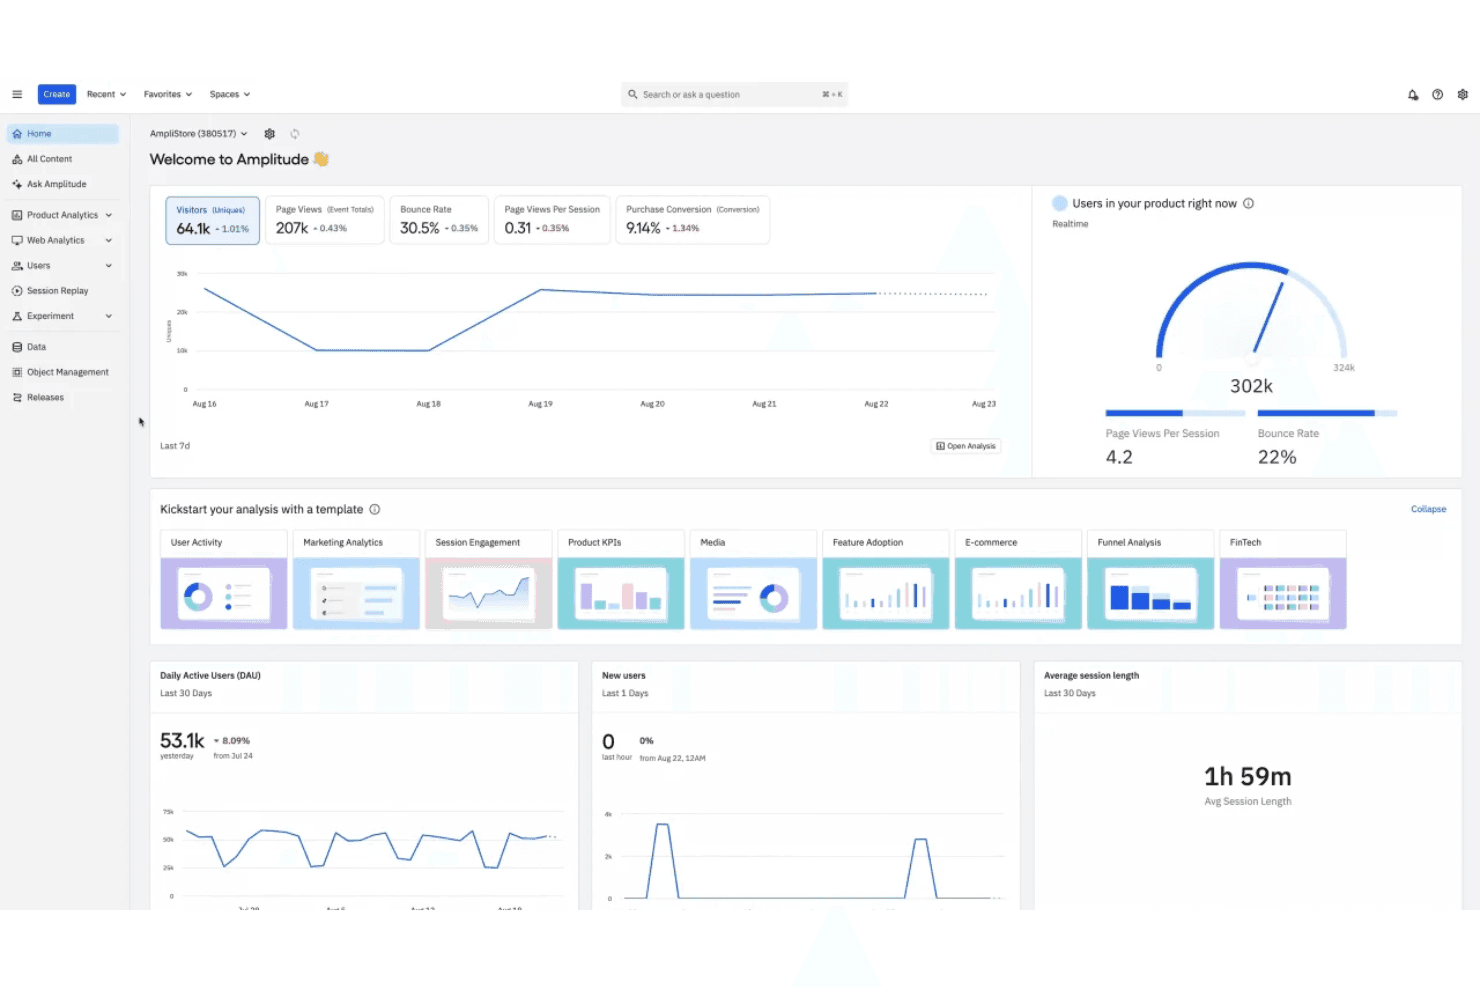
Amplitude offers a comprehensive analytics dashboard displaying real-time user metrics, traffic trends, DAU, session length, and template-based analysis tools. Amplitude is a product analytics platform built for product and growth teams who need to understand how users engage with specific features across web and mobile apps.
Who Is Amplitude Best For?
Amplitude is a strong fit for mid-size to enterprise SaaS companies with dedicated product teams running ongoing feature experimentation and retention analysis.
Why Amplitude Is a Good Adobe Analytics Alternative
I picked Amplitude because its Feature Adoption chart lets me track exactly which features users activate, return to, or abandon over time. I also rely on Amplitude's Compass chart to identify which behaviours correlate with long-term retention, something Adobe Analytics doesn't surface natively. Together, those two views give my product team a clear read on where to invest next in the product roadmap.
Amplitude Key Features
- Funnel analysis: Map multi-step conversion flows to see exactly where users drop off between key actions.
- Cohort builder: Group users by shared behaviours or properties to compare how different segments move through your product.
- Session replay: Watch individual user sessions with synced event data to see exactly what happened before and after a key interaction.
- A/B experiment analysis: Run and measure product experiments with built-in statistical significance tracking across user segments.
Amplitude Integrations
Amplitude offers 138+ built-in integrations, including Twilio Segment, Braze, Snowflake, HubSpot, Slack, AWS S3, Google Ads, Salesforce, Intercom, and WordPress. It also connects with Zapier, and an API is available for custom integrations.
Pros and Cons
Pros:
- Built-in A/B test analytics
- Real-time product usage dashboards
- Advanced cohort analysis for user segmentation
Cons:
- Fewer out-of-the-box marketing integrations
- Requires manual setup for custom events
Learn more about Amplitude: Best for visualizing digital user journeys
- Free demo available
- Pricing upon request
Visit WebsiteCustomer Rating:4.7/5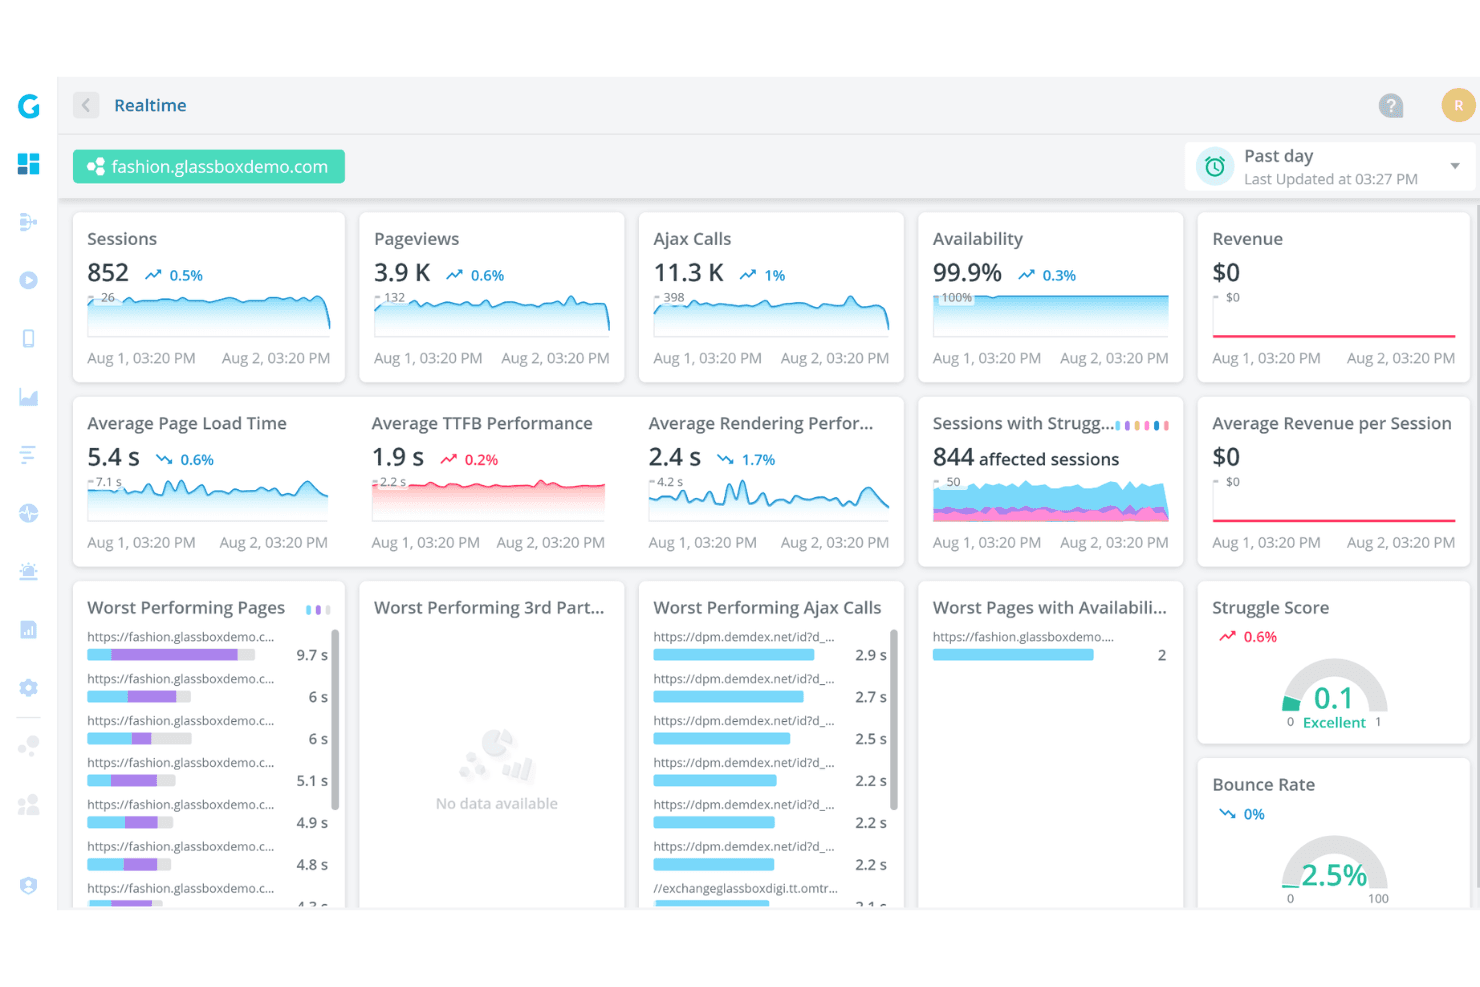
Glassbox offers a real-time analytics dashboard displaying sessions, pageviews, Ajax calls, availability, page load times, and struggle scores for a demo fashion website. Glassbox is a digital experience analytics platform built for enterprise teams in regulated industries who need deep visibility into how customers interact with their web and mobile apps.
Who Is Glassbox Best For?
Glassbox is a strong fit for enterprise teams in financial services, insurance, and retail who need session-level visibility across web and native mobile apps.
Why Glassbox Is a Good Adobe Analytics Alternative
I picked Glassbox because its Augmented Journey Map gives me a single visual of every step across a digital journey, from acquisition through conversion, without piecing together separate reports. I can see drop-offs, struggles, and errors in one view, then jump directly into a session replay from that same screen. What I find especially useful is the built-in revenue impact metric, which assigns a dollar value to friction at each journey step so I can prioritize fixes by actual business cost.
Glassbox Key Features
- Heatmaps: Aggregate click, scroll, and hover activity across any page to show where attention concentrates or drops off.
- Form analytics: Tracks field-level interactions inside forms, including hesitation, abandonment, and re-entry behaviour.
- Mobile app session recording: Captures and replays native iOS and Android app sessions, including crash moments.
- Struggle detection: Automatically flags rage clicks, dead clicks, and repeated error clicks without manual event configuration.
Glassbox Integrations
Glassbox offers native integrations with Adobe Analytics, Google Analytics, Google Tag Manager, Tealium, Qualtrics, Jira, Slack, Firebase, AB Tasty, Adobe Target, Optimizely, and VWO. An API is available for custom integrations.
Pros and Cons
Pros:
- Visual journey mapping highlights conversion barriers
- Integrates with major analytics and monitoring tools
- Real-time alerts for user experience issues
Cons:
- Mobile analytics features require separate setup
- Fewer advanced segmentation options than Adobe
Learn more about Glassbox: Best for individual-level customer journey analysis
- Free demo + 30-day free trial available
- From $999/month
Visit WebsiteCustomer Rating:4.4/5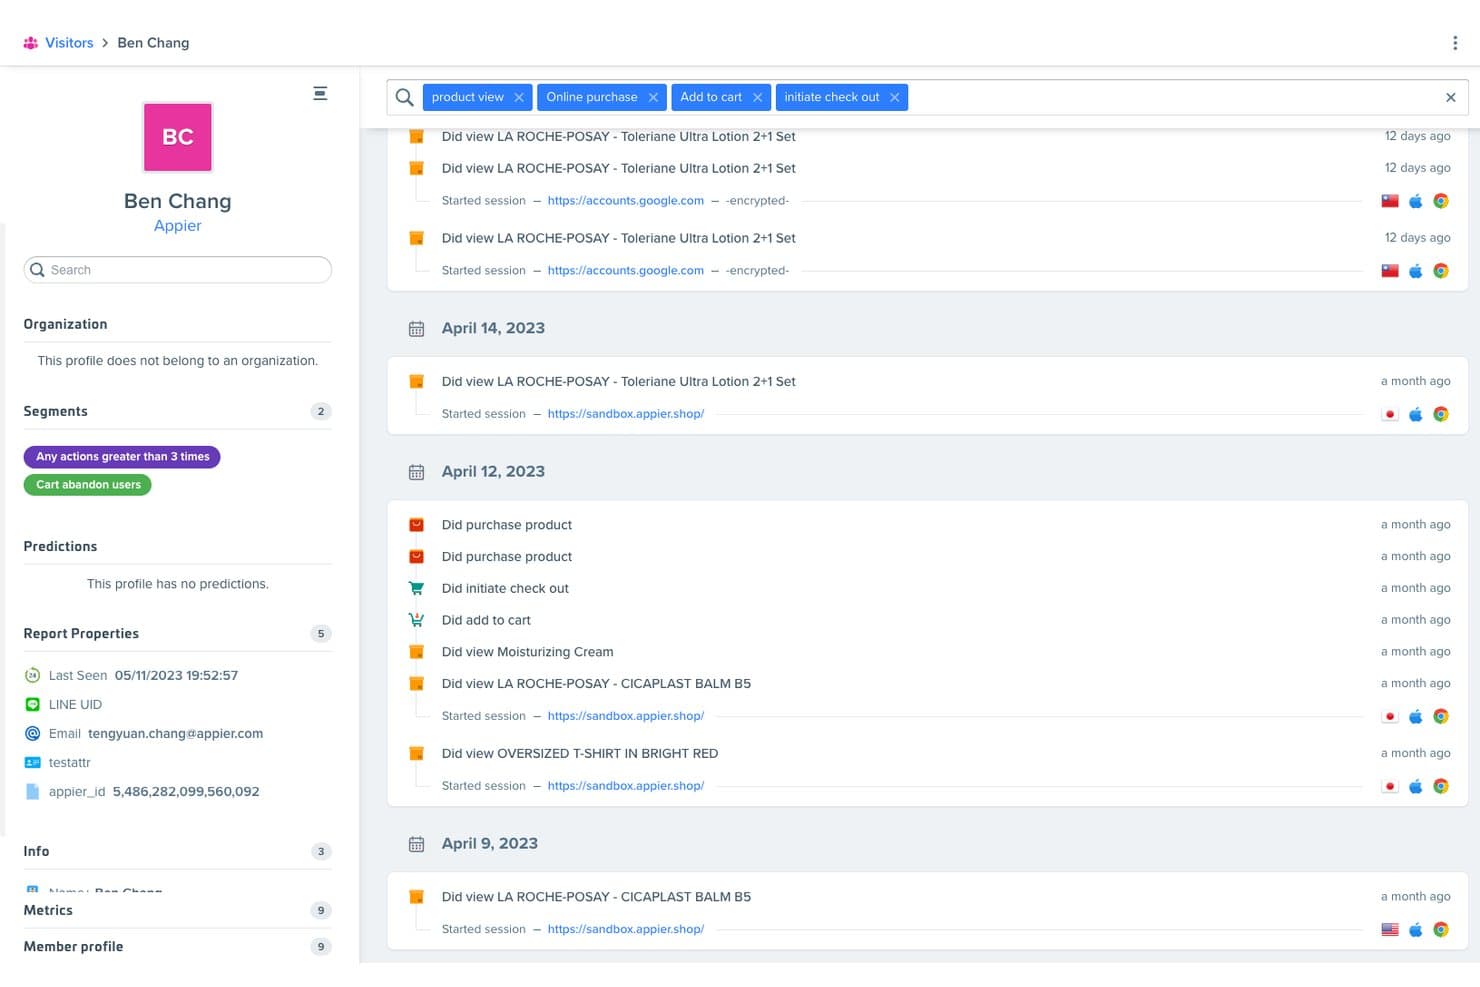
Woopra tracks individual user behavior and activity timelines in detail. Woopra is a customer analytics platform for digital product and growth teams, connecting website and app behavior with customer records to help diagnose conversion friction and improve experiences.
Who Is Woopra Best For?
Woopra suits product and growth teams that need to examine individual customer journeys and pinpoint where users drop off.
Why I Picked Woopra
I picked Woopra as an Adobe Analytics alternative because it’s Best for individual-level customer journey analysis. I like that it connects website and app behavior with customer records, so I can follow a person’s path across touchpoints. When users abandon a conversion flow, that view helps me locate where the journey breaks down.
Woopra Key Features
- Trends reports: Track event metrics over time and compare performance across customer groups.
- Retention reports: Measure how often users return to perform selected actions.
- Custom event schemas: Define events and properties to organize, segment, and analyze product data.
- Behavioral triggers: Run custom scripts or actions in connected apps when events or user attributes meet set conditions.
Woopra Integrations
Woopra supports 60+ integrations, including Salesforce, HubSpot, Marketo, Slack, Shopify, Segment, Google Ads, and Zapier. Its SDKs also support tracking through JavaScript, Android, iOS, Node.js, Python, Java, and PHP.
Pros and Cons
Pros:
- Reviewers praise real-time behavioral insights
- Pinpoints journey and funnel drop-offs
- Unifies individual behavior across customer touchpoints
Cons:
- Reviewers report bugs and slow-loading views
- Complex formulas and data setup challenge beginners
Learn more about Woopra: Best for open-source deployment flexibility
- Free plan available
- Pricing upon request
Visit WebsiteCustomer Rating:4.5/5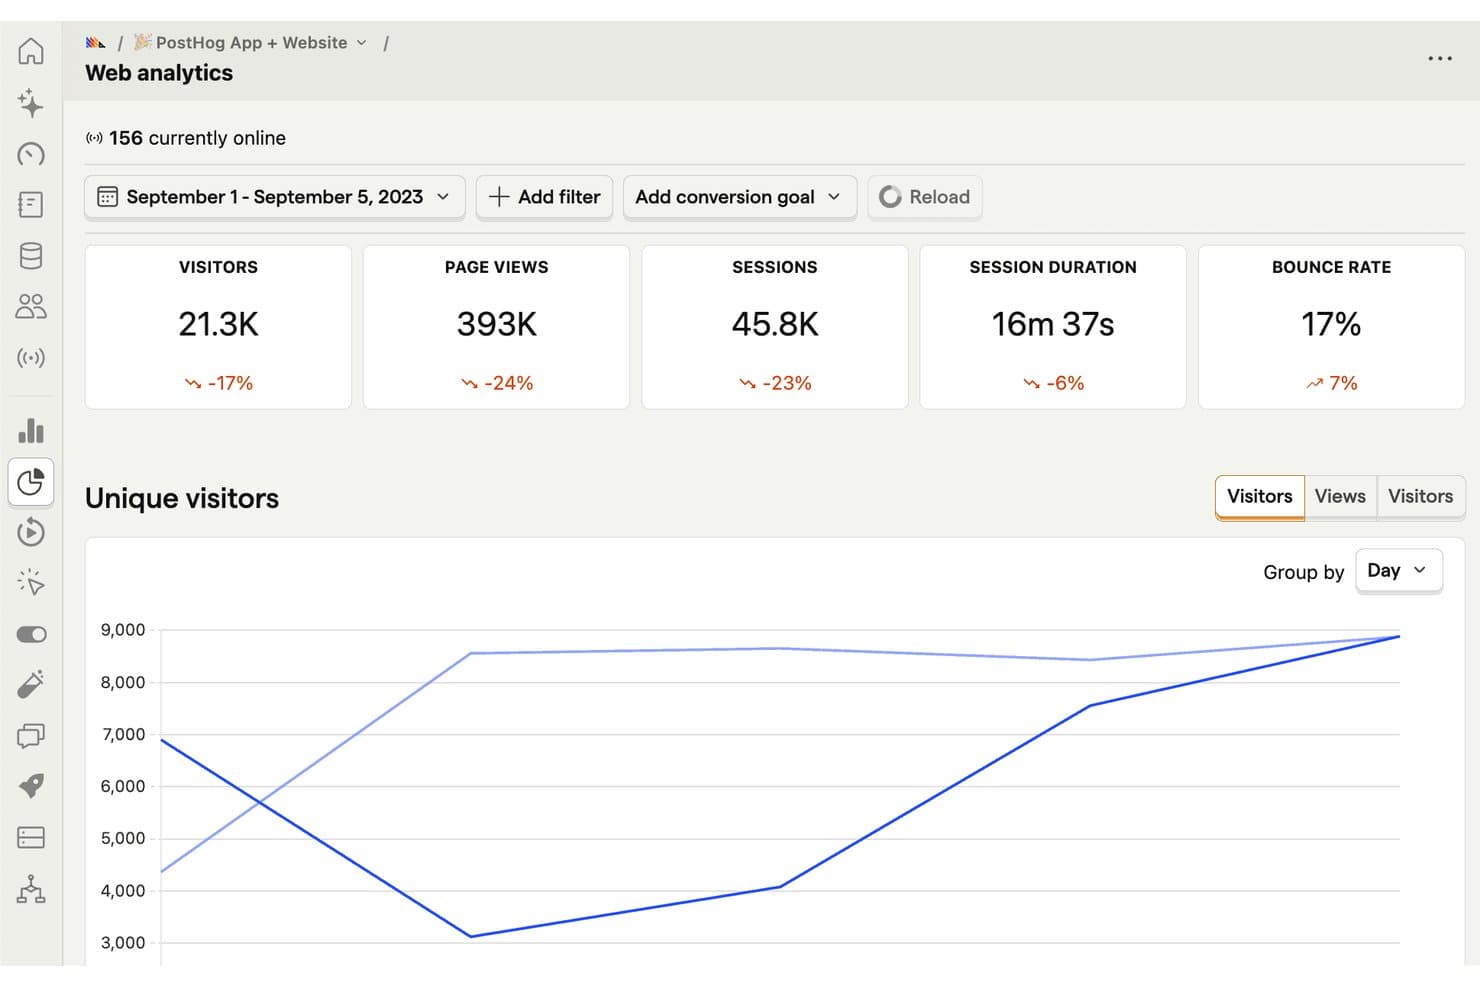
PostHog tracks visitors, sessions, and bounce rates in real time. For product teams considering alternatives to Adobe Analytics, PostHog is a product analytics platform that helps web businesses understand user behavior, spot friction, and guide product decisions.
Who Is PostHog Best For?
PostHog suits product and engineering teams that want to analyze user behavior while choosing how to deploy their analytics stack.
Why PostHog Is a Good Adobe Analytics Alternative
I picked PostHog for its open-source deployment flexibility: I can self-host it when my team needs control over where analytics data lives. Its product analytics tracks events and funnels, while session replay helps me investigate where users drop off.
PostHog Key Features
- Traffic overview: View visitors, pageviews, sessions, bounce rate, and top pages.
- Acquisition reporting: Break down traffic by channel, referrer, and UTM tags.
- Live traffic feed: Watch website events arrive in real time.
- Web vitals: Review LCP, CLS, INP, and FCP by page.
PostHog Integrations
PostHog integrates with GitHub, GitLab, Linear, and Jira to connect errors and session replays with issue tracking; it also offers a Slack app and a Slack destination for event-based messages. PostHog provides an API for custom integrations.
Pros and Cons
Pros:
- Session replays add behavioral context
- Funnels connect events to drop-offs
- Self-hosting offers deployment control
Cons:
- Interface can feel overwhelming initially
- Self-hosting can demand substantial server resources
Learn more about PostHog: Best for processing intent via session replays
- Free plan + free demo + 15-day free trial available
- From $39/month (billed annually)
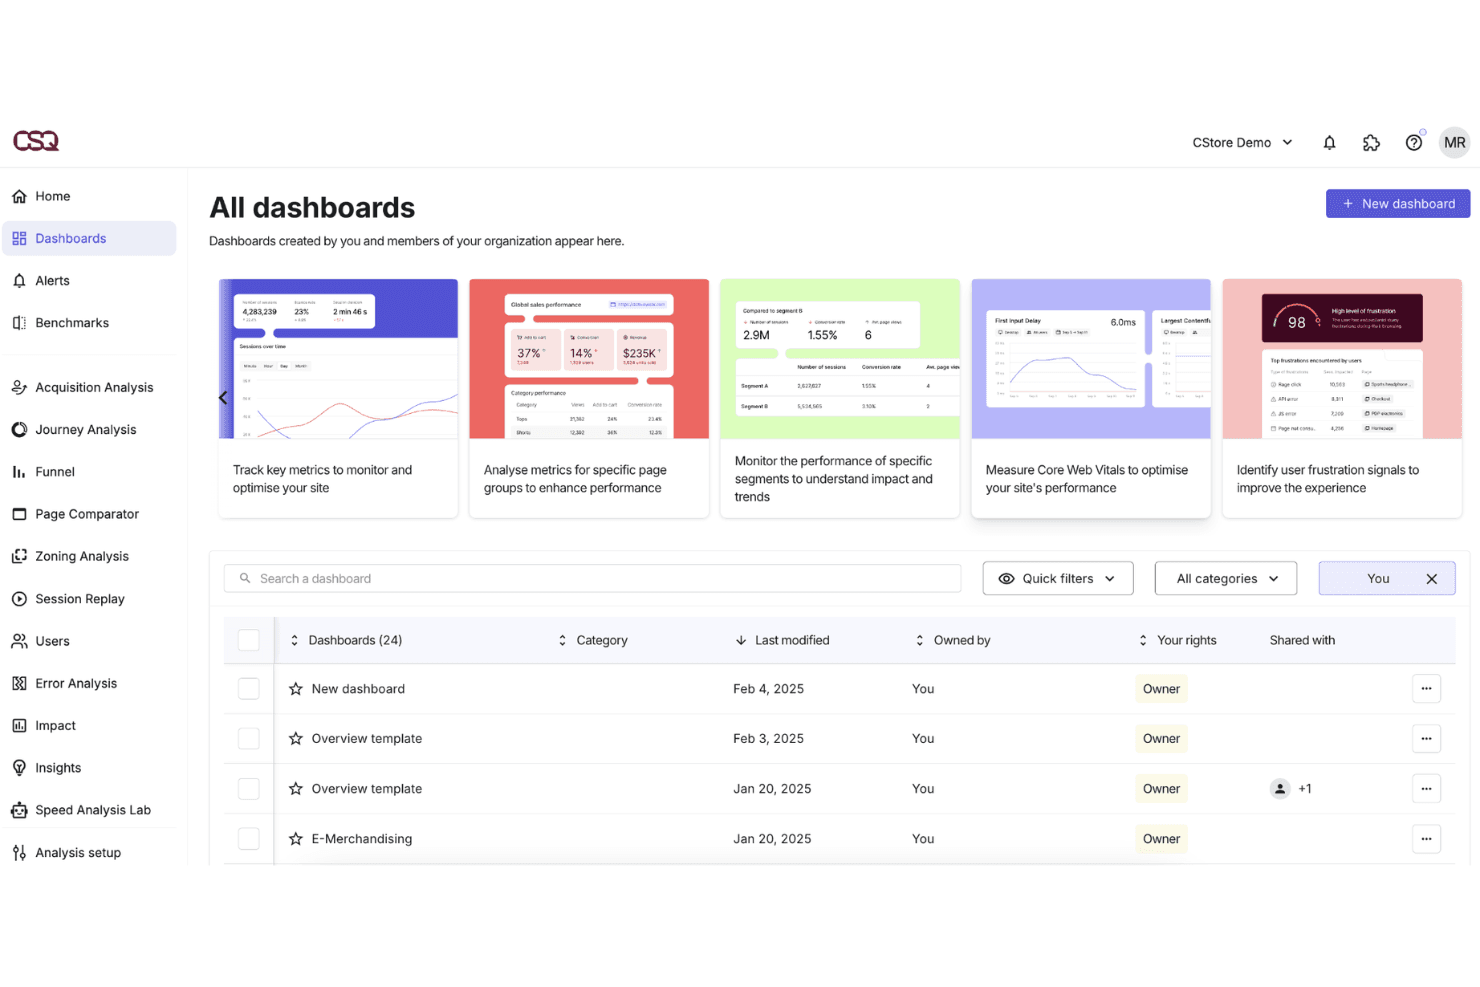
Contentsquare offers an 'All Dashboards' view where users can manage, filter, and access customized analytics dashboards for site performance monitoring. For product and digital teams at ecommerce and media companies, Contentsquare connects quantitative behavioural data with visual experience analysis to diagnose exactly where and why users disengage across web and mobile.
Who Is Contentsquare Best For?
Contentsquare suits UX researchers and digital analysts who need to connect behavioural data to business outcomes without relying on engineering support for instrumentation.
Why Contentsquare Is a Good Adobe Analytics Alternative
Contentsquare earns its spot on my shortlist because session replays are enriched with behavioural metrics like exposure rate and recurrence, adding intent context that raw video playback can't provide. I also like filtering replays by specific page errors or CSS selectors, which lets my team isolate problem sessions fast. You can even layer in voice-of-customer feedback timestamps so qualitative responses map directly to the moment of friction in a recording.
Contentsquare Key Features
- Impact quantification: Scores UX issues by their estimated revenue impact using behavioural and conversion data.
- Mobile app analytics: Tracks touch gestures, swipe depth, and screen transitions on native iOS and Android apps.
- CS Live: A browser extension that overlays live behavioural metrics directly onto any page without opening the dashboard.
- Segment comparison: Compares behavioural data across custom audience segments like new versus returning visitors.
Contentsquare Integrations
Contentsquare offers native integrations with AB Tasty, Adobe Target, Optimizely, Monetate, Kameleoon, VWO, Google Analytics 4, Mixpanel, Adobe Analytics, Shopify, Snowflake, and AWS. An API is available for custom integrations.
Pros and Cons
Pros:
- Mobile app analytics included for cross-device tracking
- Privacy compliance tools support GDPR requirements
- Visual heatmaps show granular user interactions
Cons:
- Some integrations require custom development work
- Offers a flexible reporting widget library
Learn more about Contentsquare:
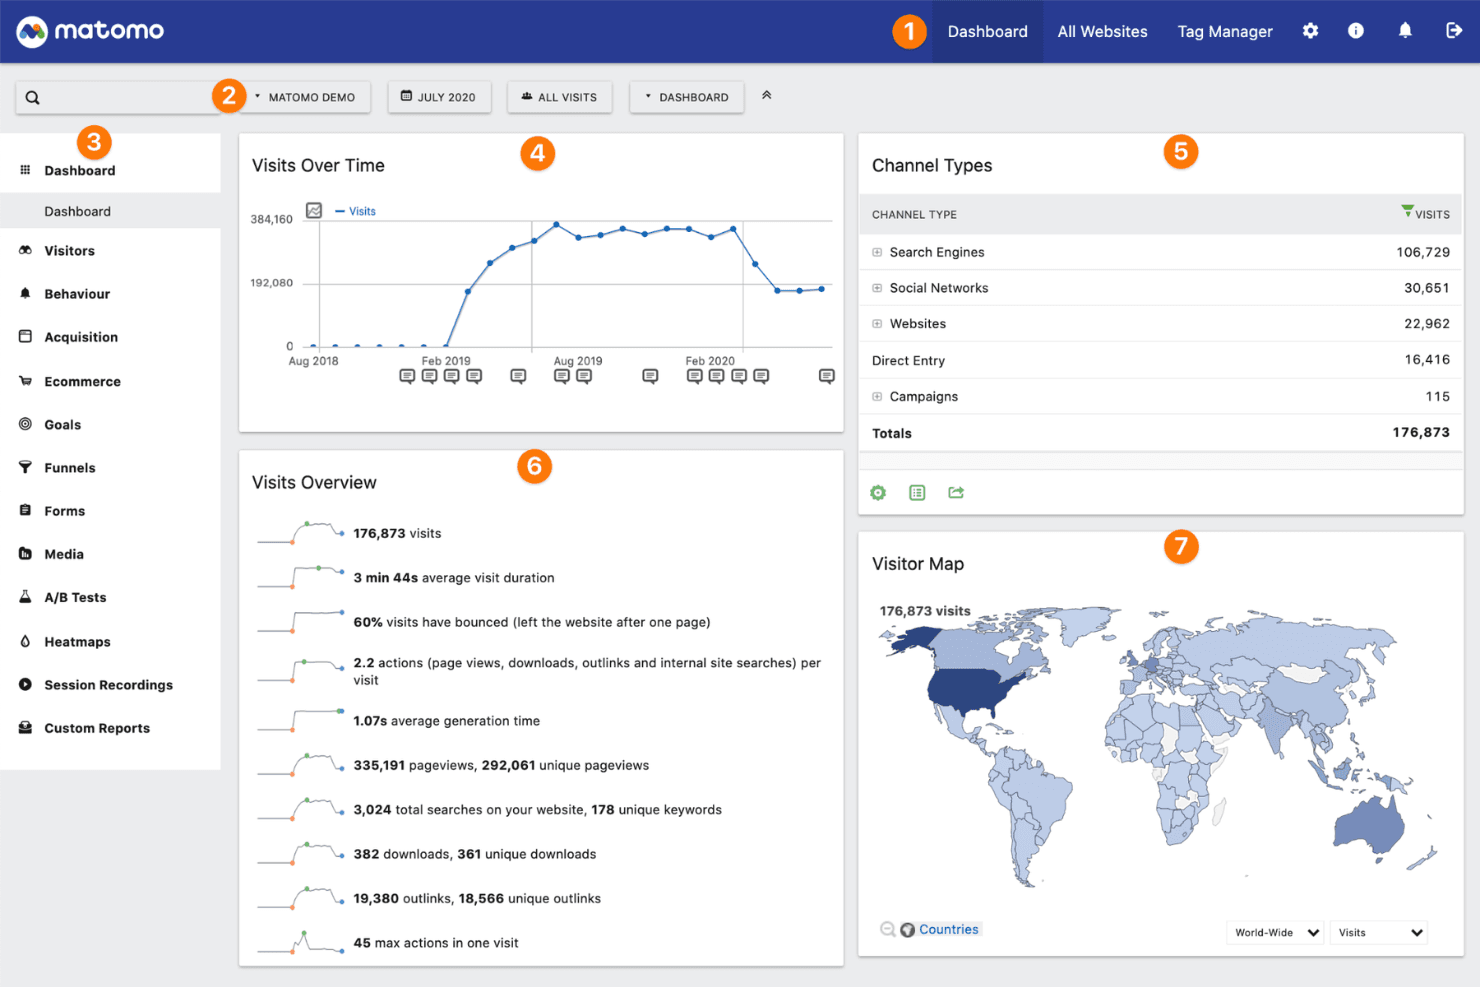
Matomo offers a comprehensive analytics dashboard displaying visits over time, channel types, visits overview metrics, and a global visitor map. Matomo is an open-source web analytics platform built for organizations that need full ownership of their visitor data, with on-premise and cloud hosting options that keep data off third-party servers.
Who Is Matomo Best For?
Matomo is a strong fit for privacy-conscious organizations in regulated industries like healthcare, finance, and government that can't send user data to third-party platforms.
Why Matomo Is a Good Adobe Analytics Alternative
I picked Matomo because it gives me something Adobe Analytics can't: complete ownership of where my data lives. With Matomo's self-hosted option, I deploy the platform on my own server, so visitor data never touches a third-party system. I also use its built-in GDPR Manager to configure consent settings, anonymize IPs, and set data retention rules directly in the interface, without patching together compliance workarounds.
Matomo Key Features
- Heatmaps: Visualize where users click, scroll, and hover on any page without sampling your data.
- Session recordings: Replay individual user sessions to review navigation patterns and page interactions.
- Goals and funnels: Define conversion goals and track where users exit multi-step flows before completing them.
- Custom reports: Build reports using any combination of dimensions and metrics from your tracked data.
Matomo Integrations
Matomo offers native integrations with WordPress, Drupal, Joomla, WooCommerce, Shopify, Google Looker Studio, Microsoft Power BI, Snowflake, Tableau, and Slack. An API is available for custom integrations.
Pros and Cons
Pros:
- Cookie-less tracking for privacy-conscious sites
- Built-in GDPR and privacy compliance tools
- On-premise deployment for full data ownership
Cons:
- Needs server maintenance knowledge
- Smaller integration ecosystem than Adobe Analytics
Learn more about Matomo:
Outras alternativas ao Adobe Analytics
Estas são algumas alternativas adicionais ao Adobe Analytics que não entraram na minha seleção, mas que ainda vale a pena conhecer:
- 11SnowplowBest for warehouse-native behavioral data ownership
- 12Piano AnalyticsBest for GDPR-exempt analytics without consent gaps
- 13KissmetricsBest for tracking user conversion funnels
- 14CountlyBest for self-hosted, privacy-first event tracking
- 15Piwik PROBest for analytics in regulated industries
- 16UXCam Best for mobile app user behaviour tracking
- 17CleverTapBest for automated lifecycle push sequences
- 18PendoBest for in-app guides tied to usage data
- 19LogRocketBest for linking session replays to funnel drop-offs
- 20StatsigBest for feature flag experimentation
How I Evaluate Adobe Analytics Alternatives
I split my evaluation into three parts. First, core functionality: can the tool capture custom behavioral events and build tailored reports and dashboards? That carries the most weight. Second, I look for product analytics depth as a differentiator. Third, I consider pricing transparency and onboarding complexity.
Core Functionality (Table Stakes For This List)
When I'm selecting tools for my list, I score each one on a scale from 0 (does not offer the functionality) to 5 (excels in this area) for each core functionality listed below. I then convert the total into a percentage to help assess each tool's overall fit, with extra weight on any functionalities I’ve deemed essential.
- Behavioral Event Tracking (Essential): I look for configurable events and properties across web and mobile, such as signup steps, feature clicks, and completed purchases.
- Custom Reports & Dashboards (Essential): I assess whether teams can build reports around their own questions, such as comparing feature adoption by user segment.
- Segmentation & Funnels: I check for custom audience segments and multi-step funnels that reveal where users abandon onboarding or checkout.
- Cross-Platform Integration: I consider how the tool brings web, app, CRM, and marketing data together to show a connected customer journey.
- Data Freshness: I look at how quickly events appear in reports, especially when teams need to investigate a sudden change in signups.
- Data Export & API: I assess whether teams can export analysis or access data through an API for use in BI tools or a data warehouse.
Once I have a list of tools that meet the criteria, I consider what sets each platform apart.
Differentiating Factors (What Sets Vendors Apart)
Here's how I compare and contrast different vendors:
Standout Features
I look for predictive and AI-driven insights that surface anomalies or churn signals without requiring a data science team to build models from scratch. Session replay paired with heatmaps is another key differentiator. When a funnel shows drop-off, I want to watch real sessions at that step and see where clicks cluster. I also evaluate governance tools like schema enforcement and tracking plan validation, since inconsistent event naming quietly erodes trust in reports as teams scale.
Beyond Features
I evaluate total cost of ownership beyond the license fee. Migration from Adobe Analytics means re-tagging properties and rebuilding tracking plans, so I check whether a vendor offers migration tooling or a partner ecosystem to reduce that switching cost. Data privacy support matters just as much. I look for first-party collection, cookieless tracking options, and flexible data residency so teams in regulated industries can meet GDPR or CCPA requirements without bolting on extra tools. I also consider cross-functional usability—role-based permissions and shared metric definitions prevent the reporting gaps that surface when marketing and product teams run separate dashboards.
How I Evaluate Adobe Analytics Alternatives
I split my evaluation into three parts. First, core functionality: can the tool capture custom behavioral events and build tailored reports and dashboards? That carries the most weight. Second, I look for product analytics depth as a differentiator. Third, I consider pricing transparency and onboarding complexity.
Core Functionality (Table Stakes For This List)
When I'm selecting tools for my list, I score each one on a scale from 0 (does not offer the functionality) to 5 (excels in this area) for each core functionality listed below. I then convert the total into a percentage to help assess each tool's overall fit, with extra weight on any functionalities I’ve deemed essential.
- Behavioral Event Tracking (Essential): I look for configurable events and properties across web and mobile, such as signup steps, feature clicks, and completed purchases.
- Custom Reports & Dashboards (Essential): I assess whether teams can build reports around their own questions, such as comparing feature adoption by user segment.
- Segmentation & Funnels: I check for custom audience segments and multi-step funnels that reveal where users abandon onboarding or checkout.
- Cross-Platform Integration: I consider how the tool brings web, app, CRM, and marketing data together to show a connected customer journey.
- Data Freshness: I look at how quickly events appear in reports, especially when teams need to investigate a sudden change in signups.
- Data Export & API: I assess whether teams can export analysis or access data through an API for use in BI tools or a data warehouse.
Once I have a list of tools that meet the criteria, I consider what sets each platform apart.
Differentiating Factors (What Sets Vendors Apart)
Here's how I compare and contrast different vendors:
Standout Features
I look for predictive and AI-driven insights that surface anomalies or churn signals without requiring a data science team to build models from scratch. Session replay paired with heatmaps is another key differentiator. When a funnel shows drop-off, I want to watch real sessions at that step and see where clicks cluster. I also evaluate governance tools like schema enforcement and tracking plan validation, since inconsistent event naming quietly erodes trust in reports as teams scale.
Beyond Features
I evaluate total cost of ownership beyond the license fee. Migration from Adobe Analytics means re-tagging properties and rebuilding tracking plans, so I check whether a vendor offers migration tooling or a partner ecosystem to reduce that switching cost. Data privacy support matters just as much. I look for first-party collection, cookieless tracking options, and flexible data residency so teams in regulated industries can meet GDPR or CCPA requirements without bolting on extra tools. I also consider cross-functional usability—role-based permissions and shared metric definitions prevent the reporting gaps that surface when marketing and product teams run separate dashboards.
How I Evaluate Adobe Analytics Alternatives
I split my evaluation into three parts. First, core functionality: can the tool capture custom behavioral events and build tailored reports and dashboards? That carries the most weight. Second, I look for product analytics depth as a differentiator. Third, I consider pricing transparency and onboarding complexity.
Core Functionality (Table Stakes For This List)
When I'm selecting tools for my list, I score each one on a scale from 0 (does not offer the functionality) to 5 (excels in this area) for each core functionality listed below. I then convert the total into a percentage to help assess each tool's overall fit, with extra weight on any functionalities I’ve deemed essential.
- Behavioral Event Tracking (Essential): I look for configurable events and properties across web and mobile, such as signup steps, feature clicks, and completed purchases.
- Custom Reports & Dashboards (Essential): I assess whether teams can build reports around their own questions, such as comparing feature adoption by user segment.
- Segmentation & Funnels: I check for custom audience segments and multi-step funnels that reveal where users abandon onboarding or checkout.
- Cross-Platform Integration: I consider how the tool brings web, app, CRM, and marketing data together to show a connected customer journey.
- Data Freshness: I look at how quickly events appear in reports, especially when teams need to investigate a sudden change in signups.
- Data Export & API: I assess whether teams can export analysis or access data through an API for use in BI tools or a data warehouse.
Once I have a list of tools that meet the criteria, I consider what sets each platform apart.
Differentiating Factors (What Sets Vendors Apart)
Here's how I compare and contrast different vendors:
Standout Features
I look for predictive and AI-driven insights that surface anomalies or churn signals without requiring a data science team to build models from scratch. Session replay paired with heatmaps is another key differentiator. When a funnel shows drop-off, I want to watch real sessions at that step and see where clicks cluster. I also evaluate governance tools like schema enforcement and tracking plan validation, since inconsistent event naming quietly erodes trust in reports as teams scale.
Beyond Features
I evaluate total cost of ownership beyond the license fee. Migration from Adobe Analytics means re-tagging properties and rebuilding tracking plans, so I check whether a vendor offers migration tooling or a partner ecosystem to reduce that switching cost. Data privacy support matters just as much. I look for first-party collection, cookieless tracking options, and flexible data residency so teams in regulated industries can meet GDPR or CCPA requirements without bolting on extra tools. I also consider cross-functional usability—role-based permissions and shared metric definitions prevent the reporting gaps that surface when marketing and product teams run separate dashboards.
Por que procurar uma alternativa ao Adobe Analytics?
Embora o Adobe Analytics seja uma boa escolha de plataforma de análise digital, existem vários motivos pelos quais alguns utilizadores procuram soluções alternativas. Pode estar à procura de uma alternativa ao Adobe Analytics porque…
- Precisa de uma solução de análise que privilegie a privacidade ou que não utilize cookies
- A plataforma é demasiado complexa para as necessidades da sua equipa
- Os preços não são transparentes ou estão fora do seu orçamento
- Pretende uma configuração mais rápida e uma integração inicial mais simples
- Precisa de análise para websites ou projetos de menor dimensão
- A integração com a sua pilha tecnológica existente é limitada
Se alguma destas situações lhe parece familiar, veio ao sítio certo. A minha lista contém várias opções de plataformas de análise digital mais adequadas para equipas que enfrentam estes desafios com o Adobe Analytics e procuram soluções alternativas.
Principais funcionalidades do Adobe Analytics
Eis algumas das principais funcionalidades do Adobe Analytics para ajudar a contrastar e comparar o que as soluções alternativas oferecem:
- Recolha de dados em tempo real: Capta e processa as interações dos utilizadores à medida que acontecem, permitindo às equipas monitorizar picos de tráfego, o desempenho de campanhas ou incidentes técnicos sem atrasos.
- Segmentação avançada: Agrupa os utilizadores por comportamentos, dados demográficos ou propriedades personalizadas específicas, permitindo uma análise direcionada e comparações aprofundadas entre coortes em várias dimensões.
- Modelos de atribuição: Acompanha todos os pontos de contacto na jornada do cliente e atribui mérito a cada canal de marketing ou interação, ajudando as equipas a distribuir os orçamentos de forma mais eficaz.
- Relatórios e painéis personalizados: Permitem criar relatórios e visualizações adaptados, para que as partes interessadas se possam concentrar nos KPI e nas tendências mais relevantes para as suas funções.
- Análise de percursos: Mapeia os fluxos dos utilizadores no seu site ou aplicação, tornando possível identificar pontos de bloqueio e otimizar os percursos de conversão ou a colocação de conteúdos com base no comportamento real.
- Criação e ativação de públicos: Permite criar segmentos de público personalizados que podem ser exportados ou associados a plataformas de publicidade para remarketing e otimização de campanhas.
- Análise preditiva: Utiliza IA para prever tendências, assinalar anomalias e sugerir ações, identificando padrões que, de outra forma, poderiam passar despercebidos nos dados.
- Gestão de etiquetas: Simplifica a adição, edição ou remoção de códigos de acompanhamento através de uma interface de utilizador, em vez de alterações ao código, reduzindo a dependência dos recursos de engenharia.
- Conectores de dados: Integra-se com um vasto ecossistema de ferramentas e armazéns de dados, facilitando a ligação dos conhecimentos obtidos através da análise a plataformas de automatização de marketing, CRM ou BI.
- Controlos de acesso baseados em funções: Permitem definir autorizações granulares, garantindo que os membros da equipa apenas veem e editam os dados e painéis relevantes para o seu trabalho.