

Navegar pelas complexidades da visualização de dados pode ser assustador. Se considera que o Tableau não está a responder às suas necessidades, não está sozinho. Muitos gestores de produto procuram alternativas que ofereçam uma melhor personalização, maior facilidade de utilização ou funcionalidades específicas para responder aos desafios únicos das suas equipas.
Com base na minha experiência, a ferramenta certa pode transformar a forma como interpreta os dados, tornando-os acessíveis e úteis para a sua equipa. Testei e analisei de forma independente vários programas para encontrar as melhores alternativas ao Tableau, adequadas a diferentes necessidades.
Neste artigo, vou apresentar-lhe as minhas principais escolhas, com foco na forma como cada opção pode responder aos seus desafios específicos. Vamos encontrar a solução certa para a jornada orientada por dados da sua equipa.
O que é o Tableau?
O Tableau é um programa de inteligência empresarial e visualização de dados que ajuda a sua equipa a compreender dados complexos. É normalmente utilizado por analistas de dados, profissionais de inteligência empresarial e gestores de produto que precisam de obter informações claras a partir dos seus dados. A funcionalidade de arrastar e largar, a análise de dados em tempo real e os painéis interativos ajudam a transformar dados brutos em informações úteis. De um modo geral, o Tableau oferece à sua equipa uma forma eficaz de visualizar dados, conduzindo a decisões informadas.
Tabela de comparação das alternativas ao Tableau
Esta tabela de comparação destaca os detalhes de preços das minhas principais alternativas ao Tableau.
| Tool | Best For | Trial Info | Price | ||
|---|---|---|---|---|---|
| 1 | Best for embedded analytics | 30-day free trial | Pricing upon request | Website | |
| 2 | Best for governed metrics across every BI tool | Free demo available | Pricing upon request | Website | |
| 3 | Best for governed enterprise analytics at scale | 14-day free trial | Pricing upon request | Website | |
| 4 | Best for associative data exploration | 30-day free trial | Pricing upon request | Website | |
| 5 | Best for Microsoft integration | Free plan available | From $14/user/month (billed annually) | Website | |
| 6 | Best for embedding analytics into customer products | 7-day free trial + free demo available | Pricing upon request | Website | |
| 7 | Best for real-time insights | 14-day free trial + free demo available | From $25/user/month (billed annually) | Website | |
| 8 | Best for per-tenant embedded dashboard licensing | Free demo available | Pricing upon request | Website | |
| 9 | Best for spreadsheet-style warehouse analytics | Free trial + free demo available | Pricing upon request | Website | |
| 10 | Best for natural-language queries on AWS data | 30-day free trial available | From $3/user/month | Website |


Why Trust Our Software Recommendations
6,700+
Reviews
20
Industry experts
16+
Evaluation factors
14
Years
Our team has been testing and reviewing software since 2012. As product managers ourselves, we know how difficult—and important—it is to choose the right software.
For this guide, we evaluated tools using hands-on testing and independent research, scoring tools using our selection criteria.
Our reviews reflect our human editorial judgment, not a sales pitch.
Expert reviewers:
- Andrew LumbySenior TPM
- Cristiano ValimSenior UI/UX Lead


Análises das melhores alternativas ao Tableau
Apresento abaixo os meus resumos detalhados das alternativas ao Tableau que entraram na minha lista restrita. As minhas análises apresentam uma visão detalhada das principais funcionalidades, vantagens e desvantagens, integrações e casos de utilização ideais de cada ferramenta, para o ajudar a encontrar a melhor opção para si.
 1Best for embedded analytics
Domo
- 30-day free trial
- Pricing upon request
Visit WebsiteCustomer Rating:4.4/5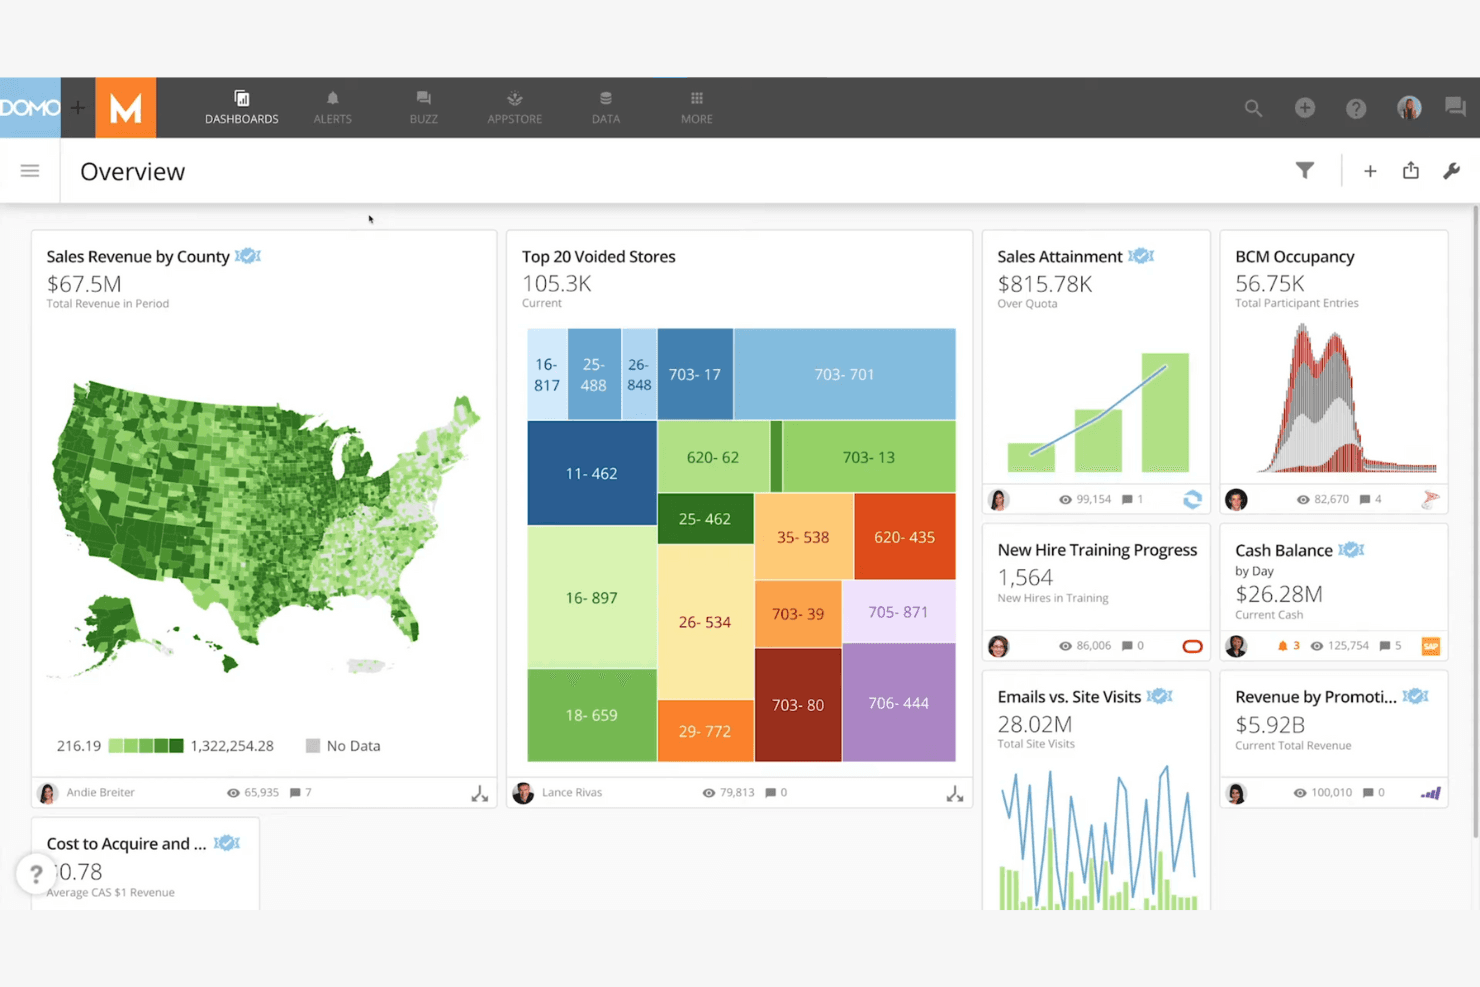
Domo displays interactive dashboards with maps, graphs, and real-time KPIs. Domo is a cloud-based business intelligence platform for product, operations, and executive teams that unifies data from multiple sources into dashboards, reports, and collaborative decision workflows.
Who Is Domo Best For?
Domo suits product and engineering teams that need to embed dashboards, reports, and data insights into customer-facing applications.
Why Domo Is a Good Tableau Alternative
I picked Domo because its embedded analytics capabilities put live dashboards and reports inside customer-facing applications. I use Domo Everywhere to support branded analytics experiences, while its APIs and SDKs help teams fit insights into existing products. This works well when product teams need customers to explore metrics without leaving the application.
Domo Key Features
- Data connectors: Connects to databases, cloud services, spreadsheets, and business applications.
- Magic ETL: Builds data transformation workflows through a visual, no-code interface.
- Data governance: Applies permissions, policies, and metadata across datasets and content.
- Alerts: Sends notifications when selected metrics reach defined thresholds.
Domo Integrations
Domo offers 1,000+ pre-built data connectors, including Salesforce, Google Sheets, Snowflake, BigQuery, and SQL Server. It also provides APIs and Connector Dev Studio for custom integrations.
Pros and Cons
Pros:
- Governance permissions support embedded deployments
- Visual Magic ETL reduces dependence on engineers
- Customer-facing dashboards through Domo Everywhere
Cons:
- Dashboard resizing frustrates some reviewers
- Large datasets can cause performance issues
Learn more about Domo: Best for governed metrics across every BI tool
- Free demo available
- Pricing upon request
Visit WebsiteCustomer Rating:4.2/5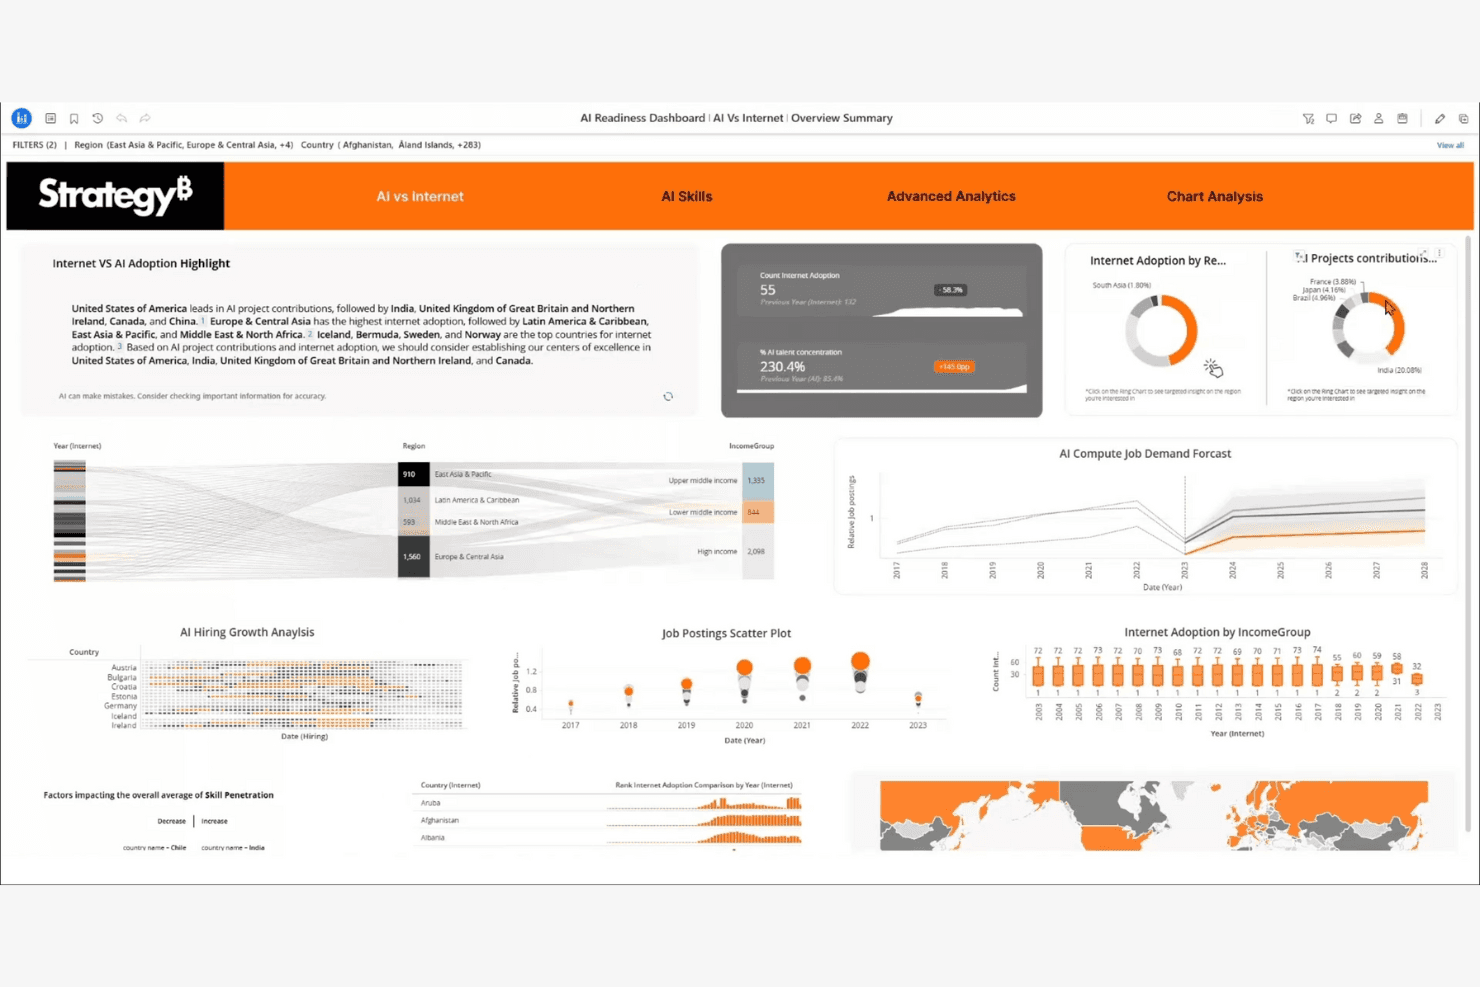
StrategyB visualizes AI readiness metrics across regions and skills. Strategy is a business intelligence platform for leaders and product teams that connects strategic goals, performance data, and initiatives to clarify priorities and track execution across the organization.
Who Is Strategy Best For?
Strategy suits organizations that need executive dashboards to connect strategic goals, performance metrics, and initiatives across teams.
Why Strategy Is a Good Tableau Alternative
I picked Strategy because its executive dashboards connect KPIs with strategic objectives and initiatives. I use scorecards to show whether teams are advancing priority outcomes, then drill into performance data during leadership reviews. That makes Strategy a strong choice for strategy execution dashboards when Tableau alternatives need to link reporting with action.
Strategy Key Features
- Data connectors: Connect cloud, database, and enterprise data sources.
- Self-service authoring: Build reports and visualizations without coding.
- Mobile access: View and interact with analytics from mobile devices.
- Embedded analytics: Add interactive analytics to business applications.
Strategy Integrations
Strategy offers 200+ pre-built data connectors, including Snowflake, Databricks, Salesforce, ServiceNow, Jira, Zendesk, Splunk, and Google BigQuery. It also provides flexible APIs for custom integrations and embedded analytics.
Pros and Cons
Pros:
- Offers broad enterprise data connectivity
- Supports executive scorecards and initiative tracking
- Links strategic goals to measurable KPIs
Cons:
- Administration may require specialized platform expertise
- Dashboard authoring can feel technically demanding
Learn more about Strategy: Best for governed enterprise analytics at scale
- 14-day free trial
- Pricing upon request
Visit WebsiteCustomer Rating:4.3/5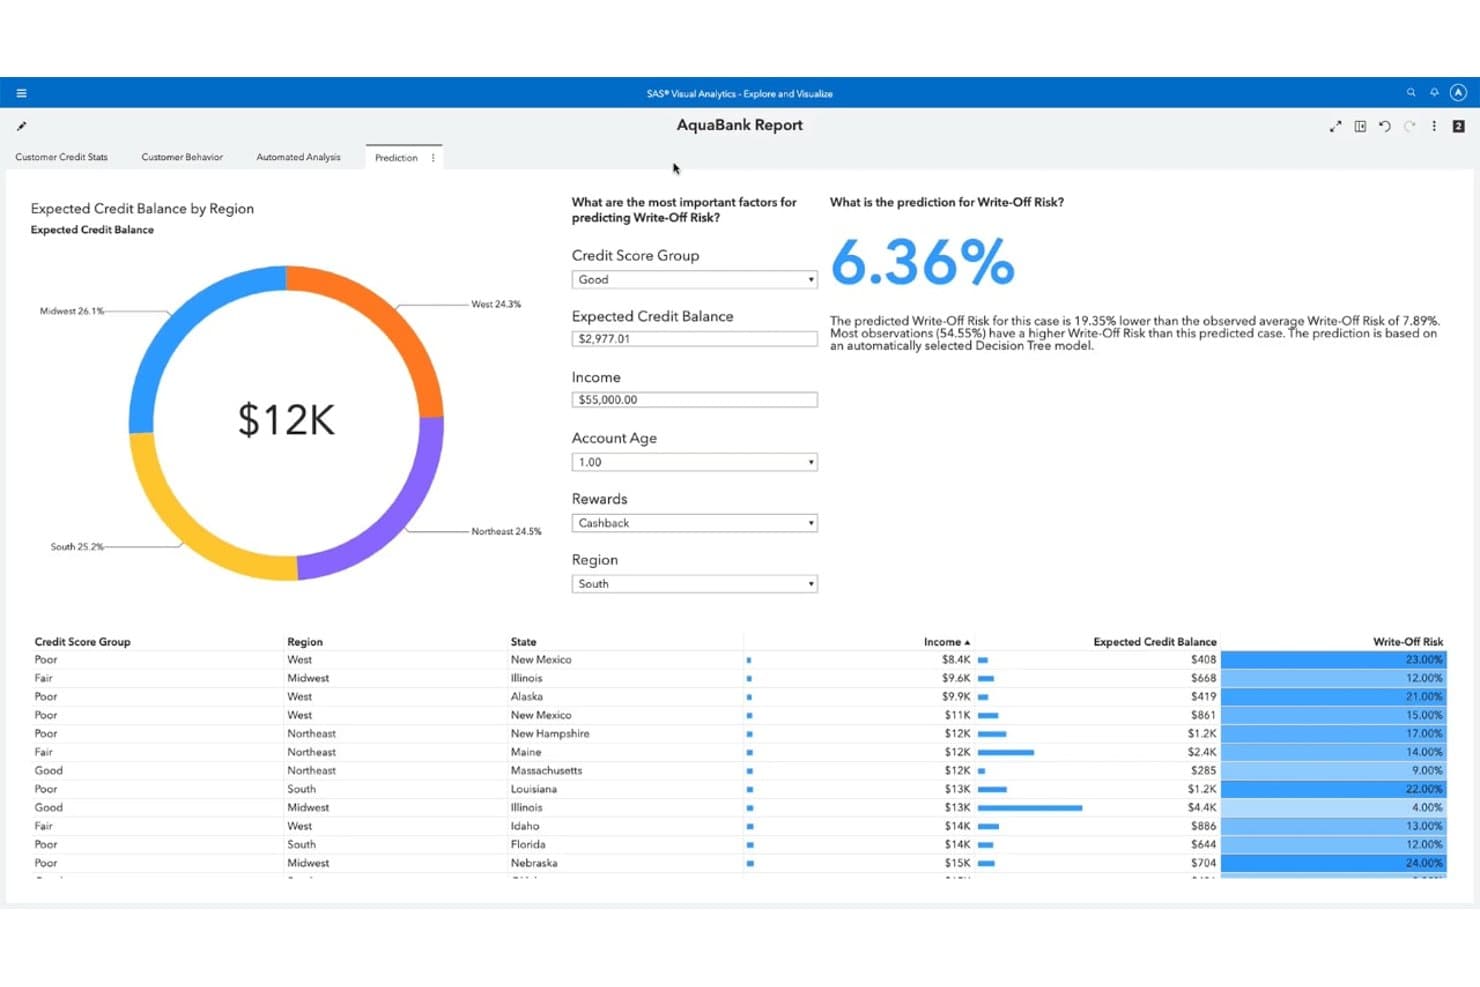
SAS Viya predicts write-off risk using a decision tree model. SAS Viya is an AI and analytics platform for enterprise teams that need governed reporting, visual analysis, and predictive insights across complex data environments.
Who Is SAS Viya Best For?
SAS Viya suits analytics, data science, and IT teams in regulated enterprises that need governed AI and reporting.
Why SAS Viya Is a Good Best Tableau Alternatives Reviewed
I picked SAS Viya because it combines governed visual analytics with predictive modeling for enterprise reporting. I use its role-based access, audit trails, and centralized model management when teams need controlled analysis across regulated data. Visual Analytics dashboards and Model Studio support reporting and forecasting without separating governance from delivery.
SAS Viya Key Features
- Data preparation: Clean, transform, and profile data before analysis.
- Data connectors: Connect to cloud, database, and file-based data sources.
- Natural language queries: Ask questions about data using conversational prompts.
- Open APIs: Access analytics capabilities through REST APIs and Python.
SAS Viya Integrations
SAS Viya supports connections to data sources including Microsoft SQL Server, Oracle, and MySQL through SAS/ACCESS connectors. It also provides REST APIs and Python support for custom integrations.
Pros and Cons
Pros:
- Supports hybrid enterprise deployment
- Predictive modeling alongside visual reporting
- Governed experimentation across analytics teams
Cons:
- Custom dashboards can feel clunky
- Dashboard refreshes can take too long
Learn more about SAS Viya:
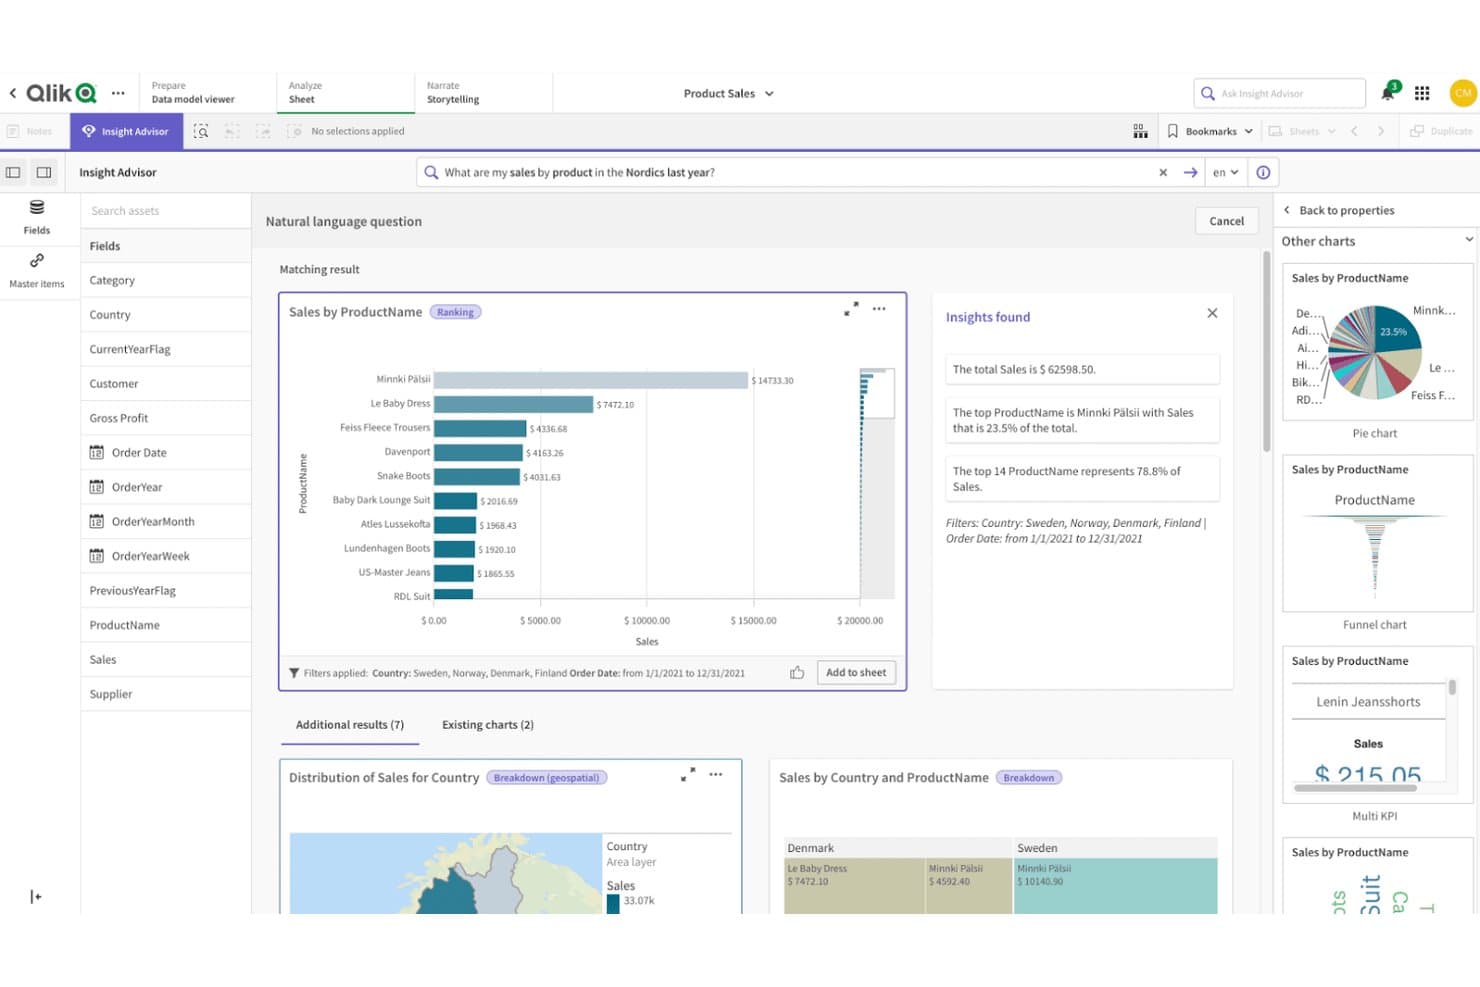
Qlik Sense lets users query product sales data visually using natural language. Qlik Sense is a business intelligence platform for product, operations, and executive teams that need self-service analytics, interactive dashboards, and faster decisions from complex business data.
Who Is Qlik Sense Best For?
Qlik Sense suits product and operations teams that need to explore connected data freely and uncover relationships beyond predefined dashboard views.
Why Qlik Sense Is a Good Tableau Alternative
I picked Qlik Sense because its associative engine lets my team explore relationships across product, customer, and operational data without following a fixed dashboard path. Its selection states reveal connected and excluded values, while associative insights surface unexpected patterns. We use it to investigate why a product metric changed across segments, regions, and channels.
Qlik Sense Key Features
- Drag-and-drop authoring: Build dashboards and visualizations without coding.
- Natural language search: Ask questions about your data using conversational queries.
- Data storytelling: Create guided presentations from charts and dashboard snapshots.
- Embedded analytics: Add Qlik Sense visualizations to external applications.
Qlik Sense Integrations
Qlik Sense offers official connectors for Salesforce, SAP, Microsoft Dynamics 365, Microsoft SQL Server, Oracle, Google BigQuery, MongoDB, and REST APIs. It also provides public APIs for custom connectors, mashups, custom visualizations, and integrations.
Pros and Cons
Pros:
- Supports fast exploratory dashboard analysis
- Handles changing data structures gracefully
- Associative selections expose hidden data relationships
Cons:
- Grid layouts limit pixel-level dashboard control
- Requires careful data modeling at scale
Learn more about Qlik Sense: Best for Microsoft integration
- Free plan available
- From $14/user/month (billed annually)
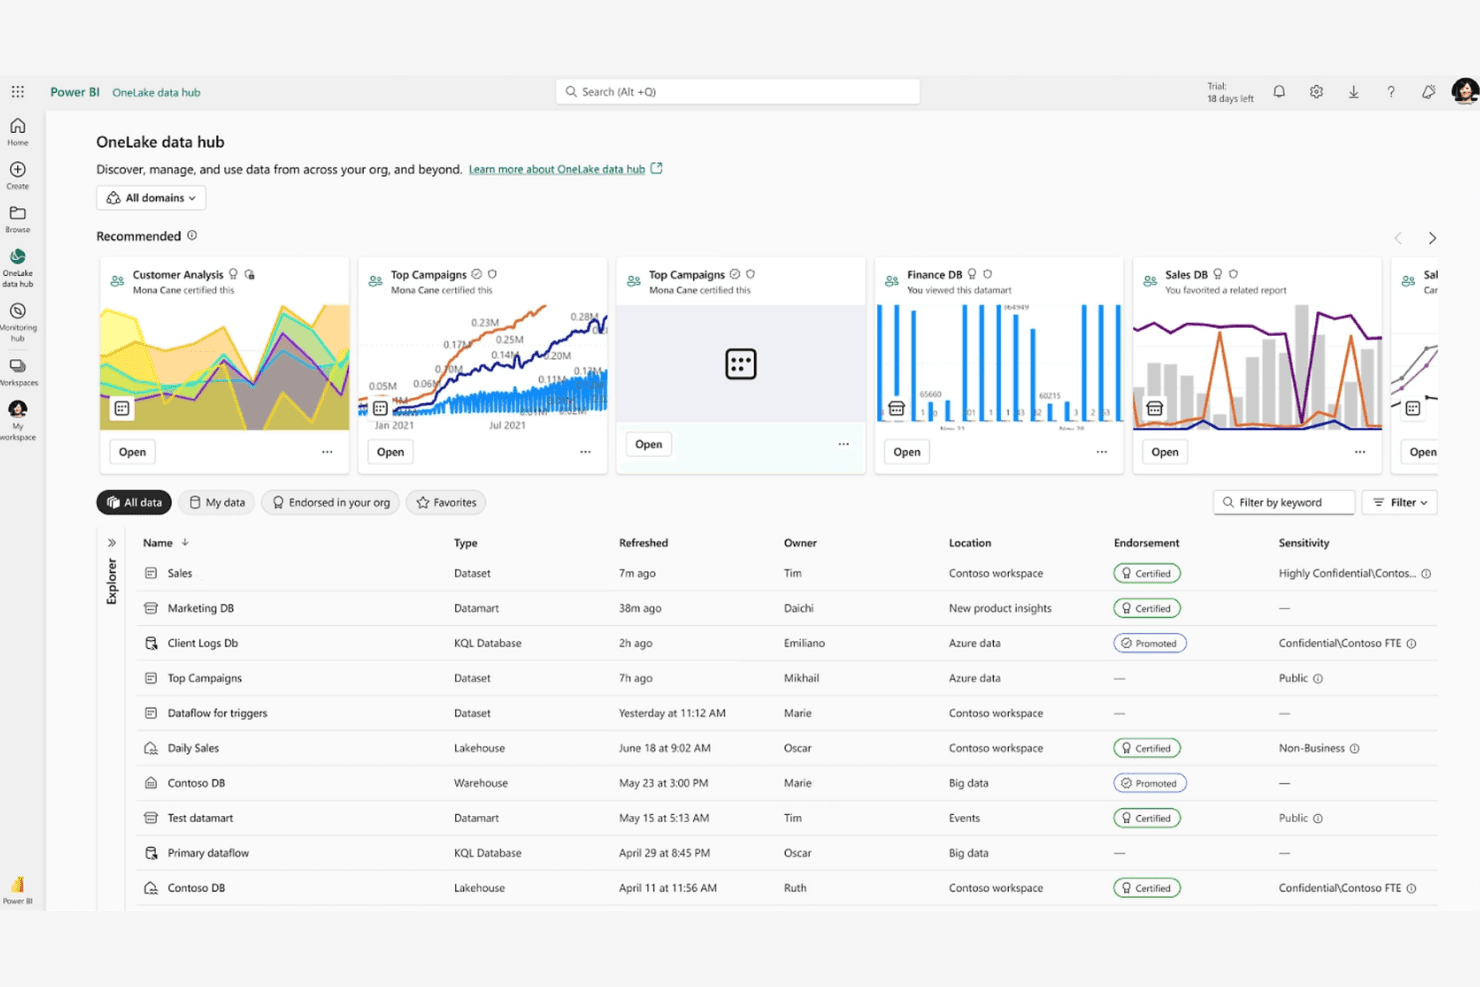
Power BI integrates with Microsoft tools for precise, AI-driven data analysis. Power BI is a business intelligence platform for analysts and product teams that need to connect data, build interactive reports, and replace manual spreadsheet analysis with self-service insights.
Who Is Power BI Best For?
Power BI suits product and operations teams already working in Microsoft 365, Excel, Azure, or Teams who need shared dashboards and governed reporting.
Why Power BI Is a Good Tableau Alternative
I picked Power BI because my team can shape Excel and Azure data with Power Query, then build governed semantic models with DAX. We publish role-based dashboards in Teams, giving product and operations stakeholders shared metrics without leaving Microsoft 365.
Power BI Key Features
- Data alerts: Set notifications when dashboard metrics reach defined thresholds.
- Natural language Q&A: Ask questions about report data using everyday language.
- Drillthrough pages: Open detailed pages filtered to a selected data point.
- Paginated reports: Create print-ready reports with precise page layouts.
Power BI Integrations
Power BI has native integrations across the Microsoft ecosystem, including Microsoft 365, Azure, Excel, SharePoint, and Microsoft Teams. It also connects to SQL Server, Salesforce, and Google Analytics, with REST APIs available for custom integrations.
Pros and Cons
Pros:
- Drillthrough and paginated reports cover operational detail
- Power Query handles varied data preparation
- Strong semantic models support governed metrics
Cons:
- Complex reports can slow without optimization
- DAX measures require substantial modeling expertise
Learn more about Power BI: Best for embedding analytics into customer products
- 7-day free trial + free demo available
- Pricing upon request
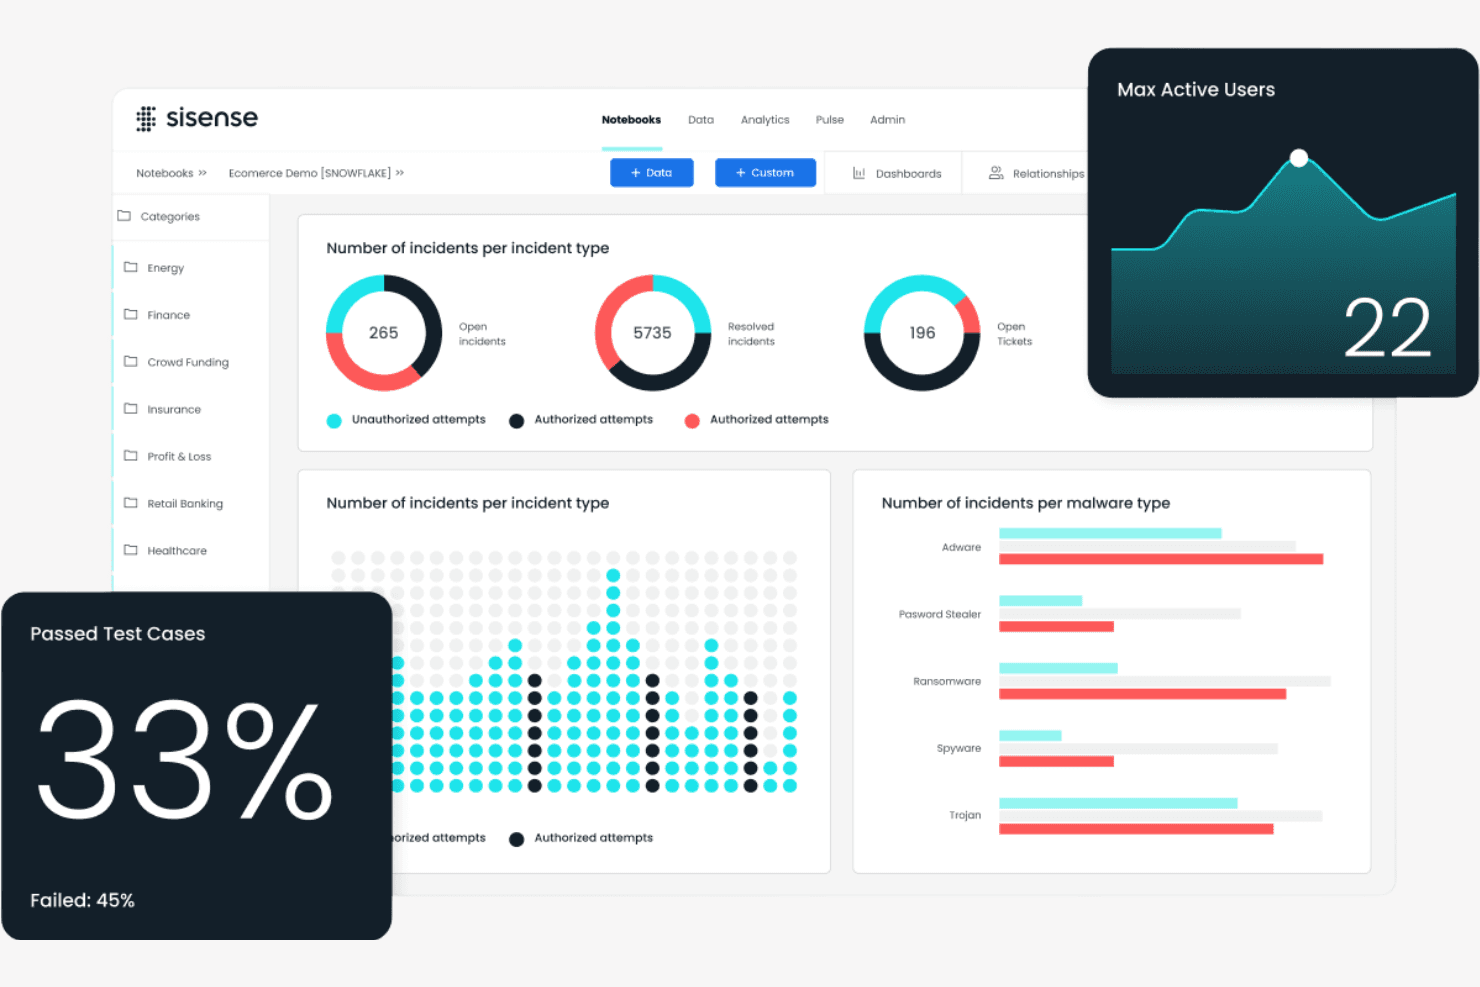
Sisense provides security dashboards with incidents, malware, and test metrics. Sisense is a business intelligence platform for product, data, and analytics teams that transforms complex data into accessible insights for better decisions and more engaging customer experiences.
Who Is Sisense Best For?
Sisense suits product and data teams that need to embed interactive analytics into customer-facing applications and portals.
Why Sisense Is a Good Tableau Alternative
I picked Sisense because it’s built for embedding analytics into customer products. I use its APIs, SDKs, and white-label dashboards to place interactive reporting inside SaaS portals without sending customers to a separate BI tool. Its governed data models also help product teams deliver consistent metrics across embedded experiences.
Sisense Key Features
- Data connectors: Connect to SQL databases, cloud warehouses, files, and business apps.
- Data preparation: Clean, blend, and model data before analysis.
- Drill-down analysis: Move from summary metrics into underlying dimensions and records.
- Data alerts: Set threshold-based notifications for changes in selected metrics.
Sisense Integrations
Sisense offers 17+ native data connectors, including Snowflake, Salesforce, Google BigQuery, Google Sheets, Microsoft SQL Server, PostgreSQL, MySQL, Oracle, MongoDB, and Amazon Redshift. It also supports partner-certified connectors such as HubSpot, Jira, Shopify, ServiceNow, SAP, Stripe, and REST, plus REST APIs and SDKs for custom integrations.
Pros and Cons
Pros:
- APIs and SDKs enable tailored product experiences
- Governed data models support consistent customer metrics
- Strong embedded analytics and white-label capabilities
Cons:
- Some users report bugs and dashboard issues
- Large datasets can slow dashboard performance
Learn more about Sisense : Best for real-time insights
- 14-day free trial + free demo available
- From $25/user/month (billed annually)
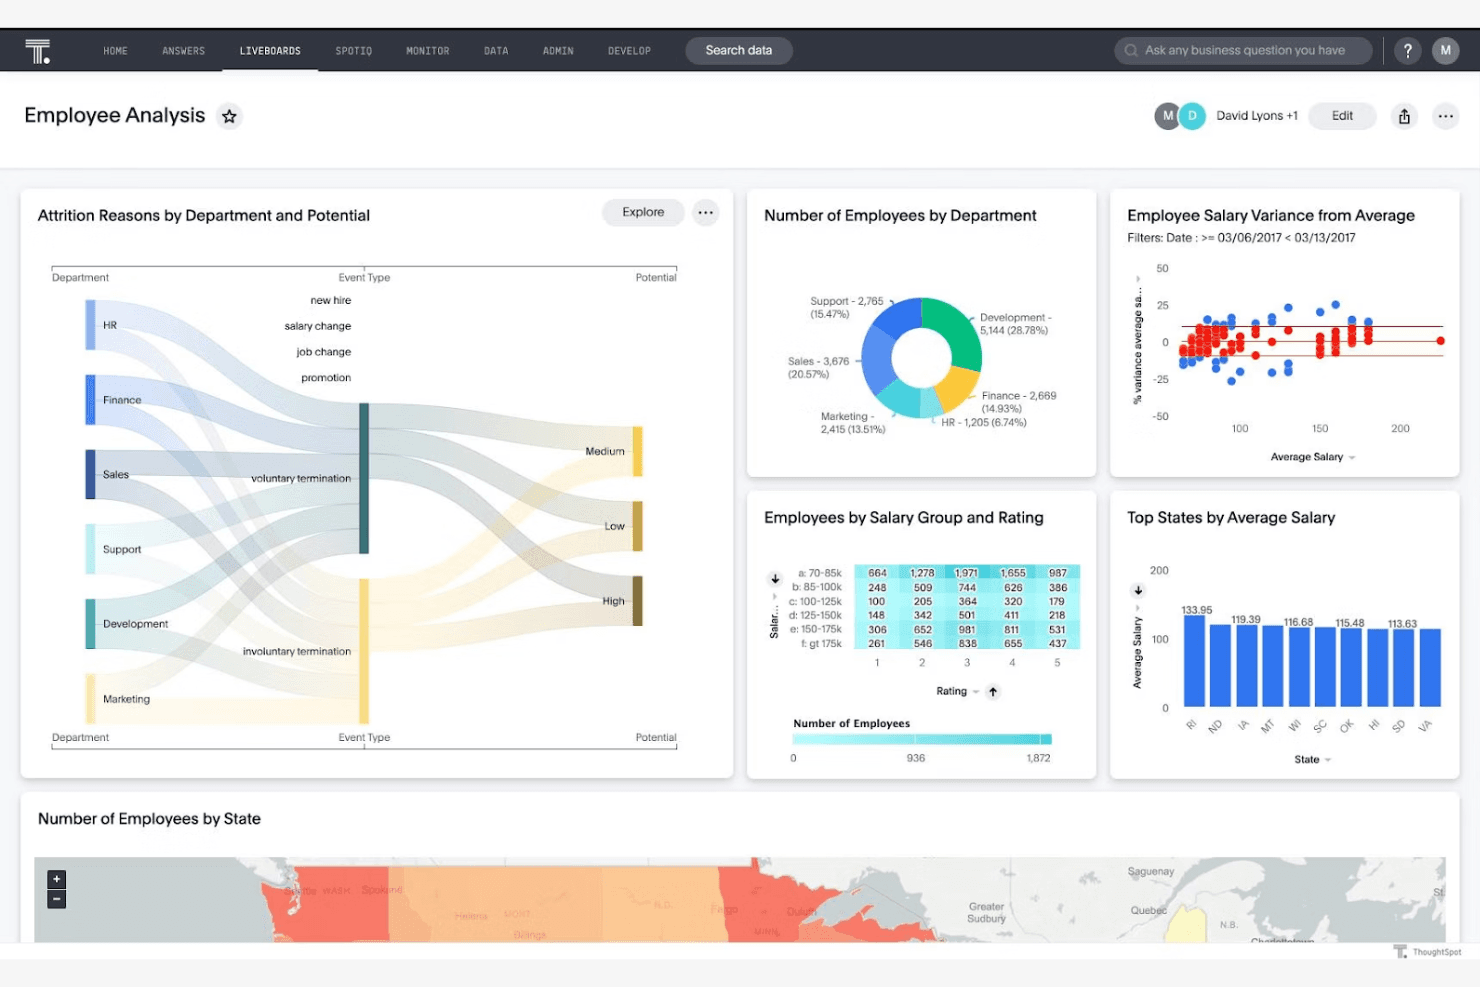
ThoughtSpot provides dashboards with diverse charts for employee analytics. ThoughtSpot is a self-service business intelligence platform for product, data, and business teams that need accessible analytics, faster decisions, and fewer dashboard bottlenecks than traditional Tableau workflows.
Who Is ThoughtSpot Best For?
Product, data, and business teams that need self-service analytics and real-time insights from live business data.
Why ThoughtSpot Is a Good Tableau Alternative
I picked ThoughtSpot because I can query live business data instead of waiting for scheduled dashboard refreshes. Its search experience and Liveboards help my team investigate changing metrics, such as revenue or activation, during product reviews. SpotIQ adds automated analysis that surfaces unexpected trends for deeper investigation.
ThoughtSpot Key Features
- Data source connectors: Connect cloud warehouses and business applications.
- Row-level security: Apply user-specific rules to control data access.
- Embedded analytics: Add ThoughtSpot analytics to products with APIs and SDKs.
- Worksheets: Build reusable models with formulas, joins, and governed data.
ThoughtSpot Integrations
ThoughtSpot offers native data connections with Snowflake, Google BigQuery, Amazon Redshift, Databricks, Oracle, SAP HANA, ClickHouse, Dremio, Looker, and Trino. It also provides connection APIs and Python support for custom integrations with SaaS applications and other data sources.
Pros and Cons
Pros:
- SpotIQ surfaces unexpected trends automatically
- Liveboards support near-real-time operational monitoring
- Natural language search speeds metric exploration
Cons:
- Complex visualizations trail Tableau’s authoring depth
- Search quality depends on semantic modeling
Learn more about ThoughtSpot: Best for per-tenant embedded dashboard licensing
- Free demo available
- Pricing upon request
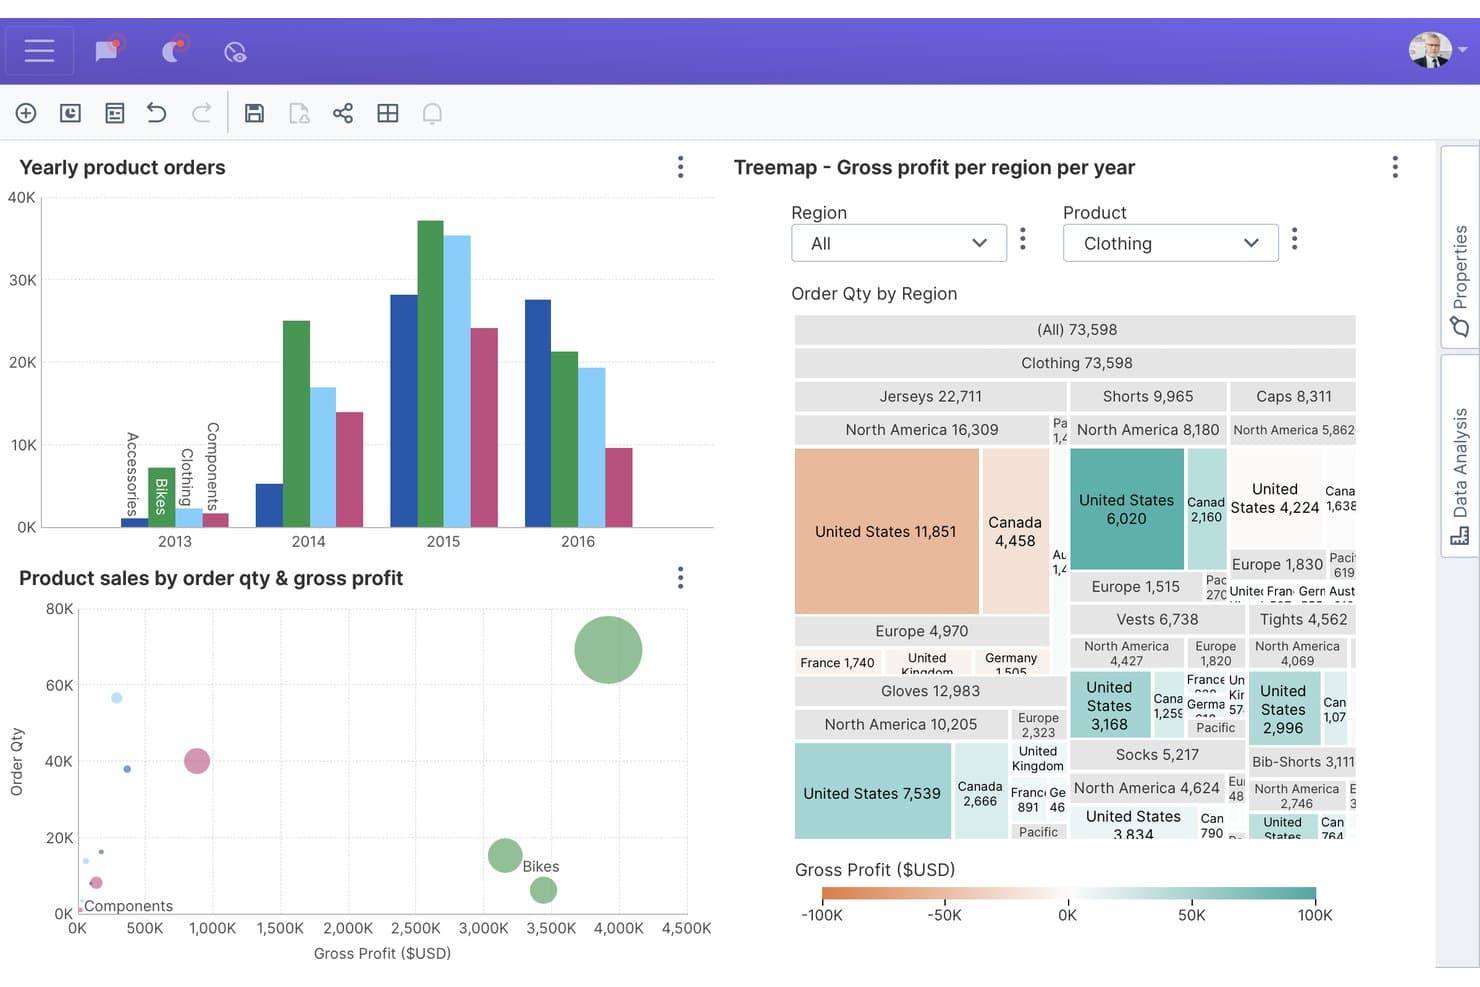
Dundas BI lets users explore sales data with interactive charts and treemaps. Dundas BI is an embedded analytics and business intelligence platform for software teams and data-driven organizations that need customizable dashboards, reporting, and data visualization within customer-facing applications.
Who Is Dundas BI Best For?
Dundas BI suits software companies embedding customizable dashboards with separate analytics experiences and licensing for each customer tenant.
Why Dundas BI Is a Good Tableau Alternative
I picked Dundas BI because its embedded analytics model fits SaaS products that need separate dashboard experiences for each customer tenant. I use customizable dashboards and per-tenant embedded dashboard licensing to give each account relevant KPIs without exposing another customer’s data. This setup suits teams embedding BI into customer-facing applications.
Dundas BI Key Features
- Data connectors: Connect to SQL databases, cloud services, spreadsheets, and other data sources.
- Data cubes: Build reusable semantic models for governed analysis and reporting.
- ETL tools: Prepare, blend, and transform data through visual workflows.
- Mobile apps: View and interact with reports on supported mobile devices.
Dundas BI Integrations
Dundas BI offers native data connectors for Microsoft SQL Server, Azure SQL, Azure Synapse, Microsoft Excel, Google Sheets, Google Analytics, Salesforce, Snowflake, Amazon Redshift, and Microsoft SharePoint. It also supports REST APIs, OData, ODBC, and JDBC connections, with REST and .NET APIs available for custom integrations.
Pros and Cons
Pros:
- Visual ETL handles blended reporting workflows
- Reusable data cubes support governed metrics
- Per-tenant embedding fits SaaS customer portals
Cons:
- Interface customization can require specialist skills
- Dashboard authoring feels dated to some users
Learn more about Dundas BI: Best for spreadsheet-style warehouse analytics
- Free trial + free demo available
- Pricing upon request
Visit WebsiteCustomer Rating:4.6/5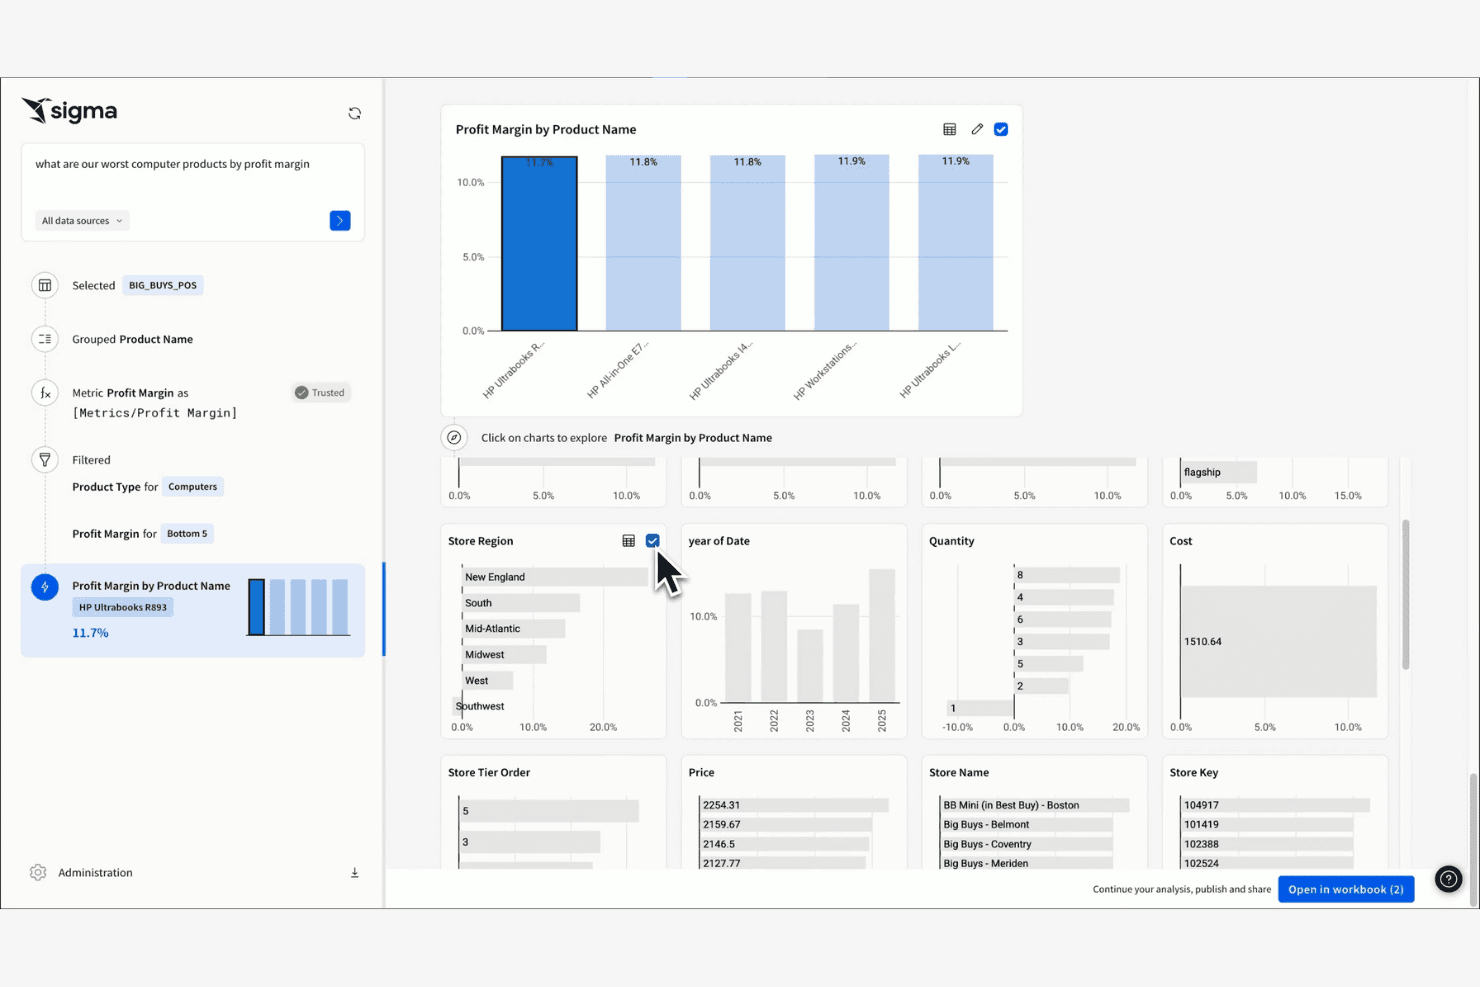
Sigma shows interactive dashboards with in-depth profit analyses. Sigma is a business intelligence platform for product, finance, and operations teams that need to explore warehouse data, answer business questions, and share insights without relying on analysts for every request.
Who Is Sigma Best For?
Sigma suits product, finance, and operations teams that need spreadsheet-style analysis directly on cloud warehouse data.
Why Sigma Is a Good Tableau Alternative
Sigma earns its place on my shortlist because it combines spreadsheet-style analysis with direct access to cloud warehouse data. I use workbook formulas, drill-downs, and visualizations to investigate product adoption or revenue trends without exporting datasets. That makes Sigma a strong choice for spreadsheet-style warehouse analytics when Tableau feels too dashboard-focused.
Sigma Key Features
- Input tables: Add, edit, validate, and track data within analyses.
- Scheduled exports: Send data exports to email or connected destinations.
- Row-level security: Restrict records according to each viewer’s attributes.
- Data alerts: Trigger notifications when selected data conditions occur.
Sigma Integrations
Sigma connects directly to Snowflake, BigQuery, Amazon Redshift, Databricks, PostgreSQL, AlloyDB, MySQL, Azure SQL Database, Starburst, and SQL Server. It also provides a REST API for custom integrations and workflow automation.
Pros and Cons
Pros:
- Input tables support collaborative data adjustments
- Queries warehouse data without exporting datasets
- Spreadsheet interface feels familiar to analysts
Cons:
- Workbook performance depends on warehouse configuration
- Advanced visualizations trail Tableau’s breadth
Learn more about Sigma: Best for natural-language queries on AWS data
- 30-day free trial available
- From $3/user/month
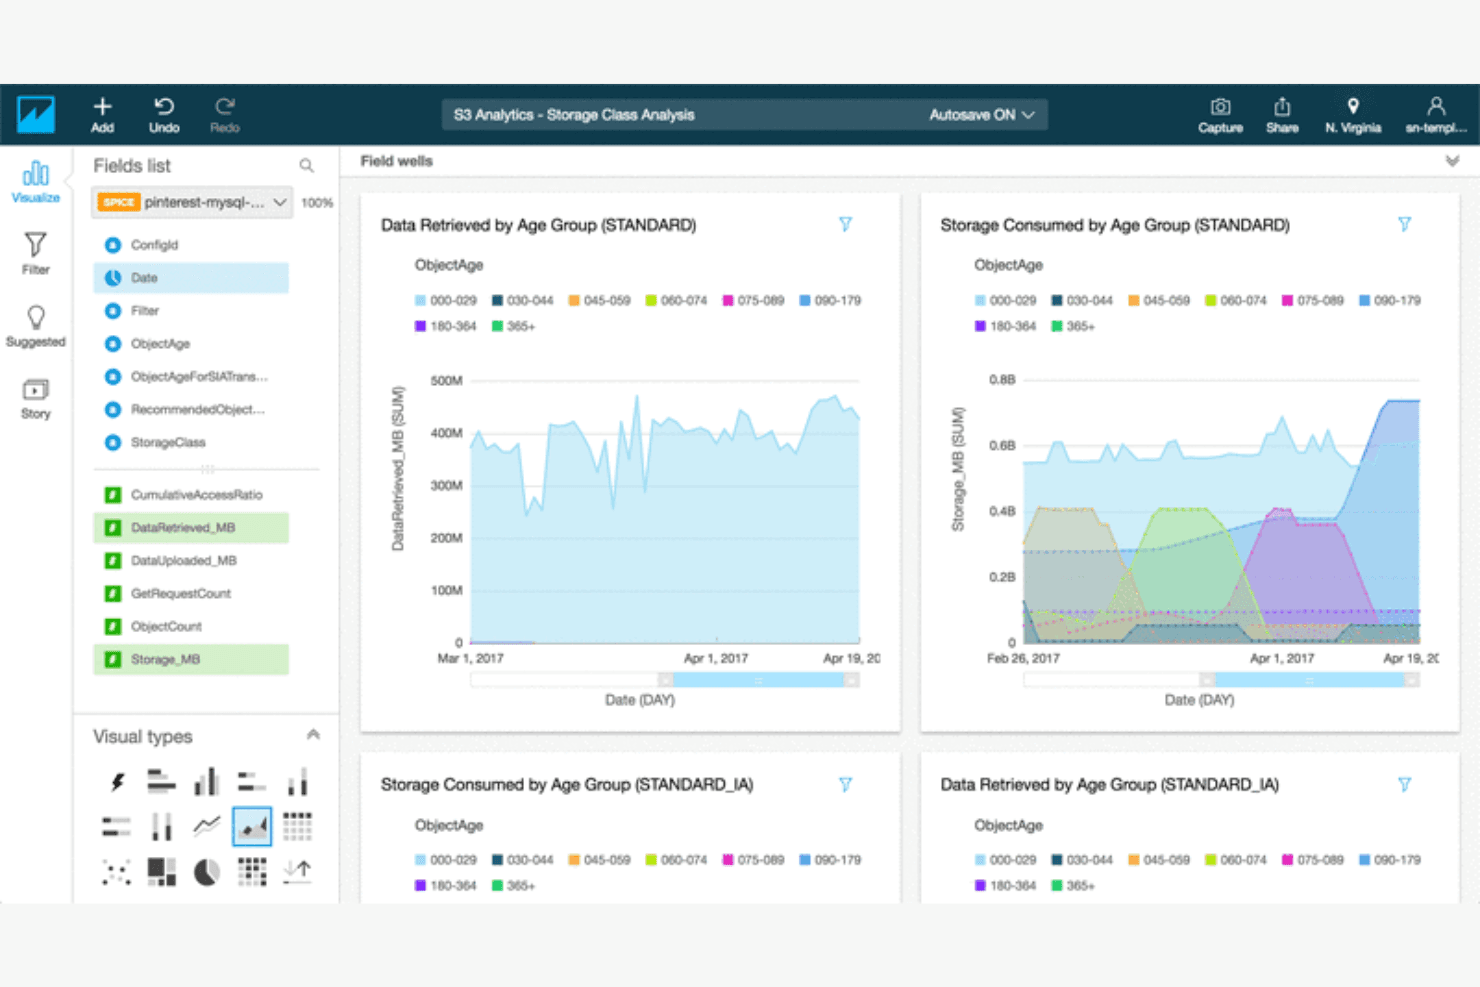
Amazon Quick Sight generates interactive dashboards that enable BI insights. Amazon Quick Sight is a cloud business intelligence platform for teams that need accessible reporting, embedded analytics, and shared insights across AWS-connected business data.
Who Is Amazon Quick Sight Best For?
Amazon Quick Sight suits product and data teams that need natural-language insights from AWS-connected business data.
Why Amazon Quick Sight Is a Good Tableau Alternative
I picked Amazon Quick Sight because it supports natural-language queries on AWS data through its Q experience. I use it to ask business questions in plain English and explore answers from governed datasets without writing SQL. SPICE acceleration and embedded dashboards also help my team analyze product metrics inside internal tools.
Amazon Quick Sight Key Features
- Interactive dashboards: Filter, drill down, and explore visual reports.
- Paginated reports: Create pixel-perfect, print-ready reports.
- Threshold alerts: Receive notifications when metrics reach defined values.
- Access controls: Manage dashboard and dataset permissions for users and groups.
Amazon QuickSight Integrations
Amazon QuickSight supports direct connections to AWS services such as Amazon Athena, Amazon Redshift, Amazon S3, Amazon Aurora, Amazon OpenSearch Service, AWS Glue Data Catalog, and Amazon Timestream. It also connects with Google BigQuery, Snowflake, Jira, ServiceNow, Adobe Analytics, GitHub, Salesforce, and provides an API for custom integrations.
Pros and Cons
Pros:
- Paginated reports support pixel-perfect operational reporting
- Embedded dashboards fit internal product workflows
- Natural-language queries simplify AWS data exploration
Cons:
- Q answers require carefully governed datasets
- Visualization customization trails Tableau’s flexibility
Learn more about Amazon Quick Sight:
Outras alternativas ao Tableau
Eis algumas alternativas adicionais ao Tableau que não entraram na minha lista restrita, mas que vale a pena conhecer:
- 11Apache SupersetBest for zero-license-cost self-hosted BI
- 12Zoho AnalyticsBest for Zoho-native cost-effective reporting
- 13AlteryxBest for no-code data prep and automation
- 14Google Data StudioBest for Google ecosystem use
- 15MetabaseBest for open-source analytics
- 16GrowBest for small business analytics
How I Evaluate Tableau Alternatives
I split my evaluation into three parts, with core functionality carrying the most weight: an alternative must build interactive dashboards and connect to multiple data sources. I then look for standout features like a governed metrics layer or an embedded analytics SDK. Beyond features, I consider licensing model flexibility and onboarding support.
Core Functionality (Table Stakes For This List)
When I'm selecting tools for my list, I score each one on a scale from 0 (does not offer the functionality) to 5 (excels in this area) for each core functionality listed below. I then convert the total into a percentage to help assess each tool's overall fit, with extra weight on any functionalities I’ve deemed essential.
- Interactive Dashboards (Essential): I look for linked views, filters, and drill-downs that let a product manager trace a signup dip from an overview to cohort details.
- Data Source Connectivity (Essential): I assess connections to warehouses, databases, spreadsheets, and apps, including whether teams can combine product events with revenue data.
- Visualization Variety: Chart options should make trends, funnels, retention cohorts, and segment comparisons clear without forcing every question into a bar chart.
- Filtering & Drill-Down: I check whether stakeholders can segment by plan, platform, or release, then follow a metric into underlying details.
- Sharing & Collaboration: I evaluate links, permissions, exports, and embedding so product, engineering, and customer-facing teams can access relevant insights.
- Data Transformation: I look for ways to clean, join, and reshape event and business data, such as aligning account IDs across sources.
Once I have a list of tools that meet the criteria, I consider what sets each platform apart.
Differentiating Factors (What Sets Vendors Apart)
Here's how I compare and contrast different vendors:
Standout Features
I look for a governed metrics layer that locks down KPI definitions in one place—so product, marketing, and finance all reference the same retention or conversion number. An embedded analytics SDK matters when your product itself needs to surface dashboards to customers. I also evaluate natural language querying, which lets PMs ask plain-English questions and get instant charts without writing SQL. Tools like ThoughtSpot and Power BI approach this differently, so I check how accurate and flexible each implementation is.
Beyond Features
I evaluate total cost of ownership by comparing licensing models—per-creator, per-viewer, and consumption-based—since hidden costs like warehouse compute charges can quietly inflate spend. Time-to-value matters too: I check for pre-built templates and guided onboarding, because PM teams without dedicated BI staff need a fast path to their first dashboard. I also look at data governance controls like row-level security and audit trails, especially when dashboards touch sensitive customer or revenue data.
Por que procurar uma alternativa ao Tableau?
Embora o Tableau seja uma boa opção de programa de inteligência empresarial e visualização de dados, há várias razões pelas quais alguns utilizadores procuram soluções alternativas. Pode estar à procura de uma alternativa ao Tableau porque…
- Precisa de opções de preços mais acessíveis
- A sua equipa necessita de capacidades de integração mais simples
- Pretende uma interface de utilizador mais simples para utilizadores sem conhecimentos técnicos
- A sua empresa precisa de uma melhor acessibilidade em dispositivos móveis
- Necessita de funcionalidades adaptadas a setores específicos
- Depara-se com limitações na escalabilidade do Tableau
Se alguma destas situações lhe é familiar, veio ao sítio certo. A minha lista inclui várias opções de programas de inteligência empresarial e visualização de dados mais adequadas a equipas que enfrentam estes desafios com o Tableau e procuram soluções alternativas. No entanto, com base em conhecimentos gerais, eis algumas funcionalidades do Tableau amplamente reconhecidas:
Principais funcionalidades do Tableau
Eis algumas das principais funcionalidades do Tableau, para ajudar a contrastar e comparar o que as soluções alternativas oferecem:
- Visualização de dados: Crie uma vasta gama de painéis interativos e partilháveis.
- Análise em tempo real: Analise os dados à medida que chegam, mantendo as suas informações atualizadas.
- Combinação de dados: Combine dados de diferentes fontes numa vista unificada.
- Interface de arrastar e largar: Crie relatórios sem necessitar de conhecimentos técnicos.
- Análise geoespacial: Visualize dados geográficos utilizando funcionalidades de mapeamento.
- Partilha e colaboração: Partilhe painéis e colabore na obtenção de informações com toda a sua equipa.
- Suporte para dispositivos móveis: Aceda a painéis e relatórios em dispositivos móveis.
- Painéis personalizáveis: Adapte os painéis às necessidades específicas da sua empresa.
- Cálculos avançados: Utilize ferramentas para efetuar análises e cálculos complexos de dados.
- Conectores de dados: Integre várias fontes de dados para facilitar o acesso aos dados.