

Bu kadar çok farklı ücretsiz ürün analitiği seçeneği mevcutken, hangisinin sizin için doğru olduğunu belirlemek zordur. Dijital bir ürünle ilgili kullanıcı etkileşimlerini, davranışlarını ve temel ölçümleri izlemek ve analiz etmek için tüm gerekli özelliklere ihtiyacınız var; ancak yine de sınırlı bir bütçeye bağlı kalmanız gerekiyor. Yardımcı olabilirim! Bu yazıda, kısıtlı bir bütçeyle birden fazla ücretsiz aracı daha büyük ekiplerle ve onlarca farklı üründe kullanma deneyimlerimi paylaşarak, en iyi ücretsiz ürün analitiği araçları seçimlerimle birlikte karar vermenizi kolaylaştıracağım.
Why Trust Our Software Recommendations
6,700+
Reviews
20
Industry experts
16+
Evaluation factors
14
Years
Our team has been testing and reviewing software since 2012. As product managers ourselves, we know how difficult—and important—it is to choose the right software.
For this guide, we evaluated tools using hands-on testing and independent research, scoring tools using our selection criteria.
Our reviews reflect our human editorial judgment, not a sales pitch.
Expert reviewers:
- Andrew LumbySenior TPM
- Cristiano ValimSenior UI/UX Lead


Karşılaştırma Tablosu: Ücretsiz Ürün Analitiği Araçları
Bu karşılaştırma tablosu, en iyi ücretsiz ürün analitiği aracı seçimlerimin fiyatlandırma ayrıntılarını özetlemektedir.
Score legend (out of 5)
- Excellent4.5–5
- Good4–4.4
- Average3–3.9
- Below average2–2.9
- Poor1–1.9
Sorted by: Default
| Tool | Starting Price | Website | |||||||
|---|---|---|---|---|---|---|---|---|---|
Best for no-code UX friction spotting | 2.5 out of 5 | 2 | 3 | 2 | 3 | 2 | 3 | $25/month Free plan available | Website |
Best for mapping the full customer journey free | 3.5 out of 5 | 2 | 4 | 4 | 4 | 4 | 3 | Pricing upon request Free plan + free demo available | Website |
Best for no-code retroactive event tracking | 2.8 out of 5 | 3 | 2 | 4 | 1 | 4 | 3 | Pricing upon request Free plan available | Website |
Best for behavior analytics and AI-driven insights | 3.0 out of 5 | 2 | 4 | 4 | 3 | 2 | 3 | $39/month Free plan + free demo + 15-day free trial available | Website |
Best for privacy-first, unsampled web analytics | Not rated | 3 | 2 | 4 | 4 | Not rated | 4 | €275/month Free plan + free trial available | Website |
Best for a universally-popular choice | 3.5 out of 5 | 4 | 1 | 4 | 4 | 4 | 4 | $50,000/year Free plan available | Website |
Best for interactive reporting | 3.7 out of 5 | 2 | 5 | 4 | 4 | 4 | 3 | $120/month Free plan available | Website |
Best for free analytics with built-in replay | 4.5 out of 5 | 4 | 5 | 5 | 4 | 5 | 4 | Pricing upon request Free plan available | Website |
Best for advanced session replay | 4.2 out of 5 | 4 | 5 | 5 | 3 | 4 | 4 | $176/month 14-day free trial + free plan available | Website |
Best for Microsoft-backed free heatmaps and replay | 2.8 out of 5 | 3 | 3 | 4 | 2 | 2 | 3 | Pricing upon request Free plan available | Website |


En İyi Ücretsiz Ürün Analitiği Araçları İncelemeleri
Aşağıda, kısa listeme giren en iyi ücretsiz ürün analitiği araçlarının ayrıntılı özetlerini bulabilirsiniz. İncelemelerim, size en uygun aracı bulmanıza yardımcı olmak için her aracın temel özelliklerini, artılarını & eksilerini, entegrasyonlarını ve ideal kullanım alanlarını ayrıntılı olarak ele almaktadır. Bu araçlardan bazıları tamamen ücretsiz bir sürüm sunarken, diğerleri ücretsiz deneme süresi sunmaktadır. İncelemelerimin her birinde nelerin ücretsiz olduğuna dair bir not ekledim.
 Best for no-code UX friction spotting
- Free plan available
- From $25/month
Visit WebsiteCustomer Rating:4.7/5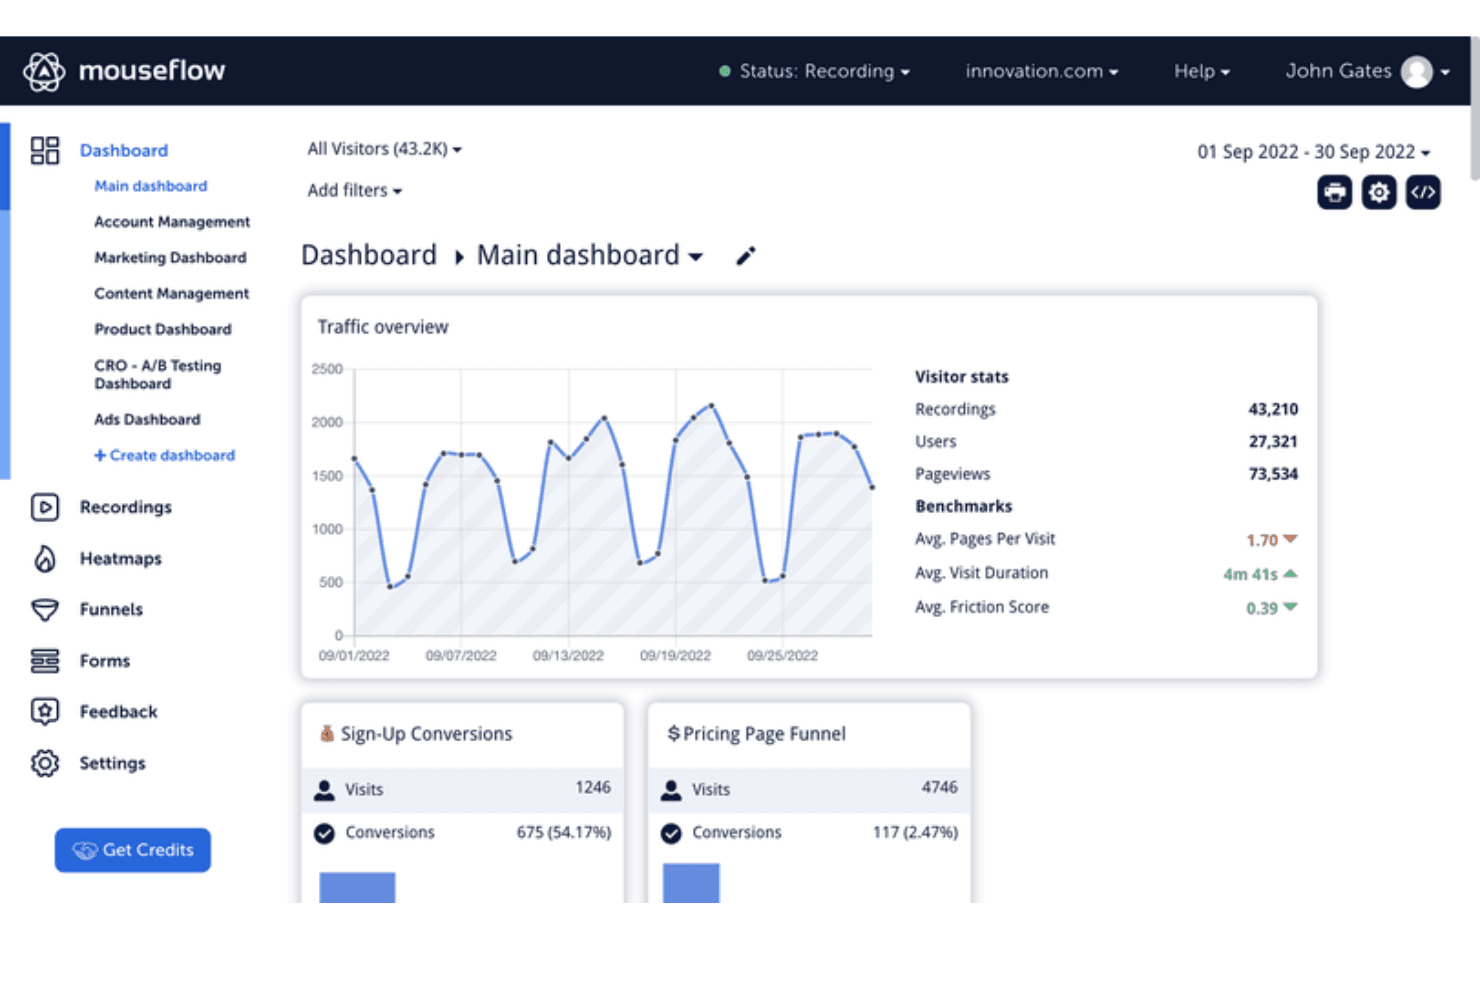
Mouseflow's dashboard tracks traffic, conversions, and visitor behavior metrics. Mouseflow is a free digital experience analytics tool that combines no-code session replay, heatmaps, form analytics, conversion funnels, surveys, and friction detection for website behavior analysis.
Who Is Mouseflow Best For?
Mouseflow suits website-focused product teams and founders who need no-code session replay and UX friction signals.
Why I Picked Mouseflow
I picked Mouseflow for no-code UX friction spotting when product teams need behavioral evidence without event instrumentation. Session replays, rage-click and dead-click detection, and Friction Scores reveal where users struggle in signup, checkout, or onboarding flows. I use its heatmaps and form analytics to connect those moments with conversion drop-offs.
Mouseflow Key Features
- Personal and team dashboards: View reported metrics in dedicated dashboards.
- Conversion funnels: Analyze conversions, drop-offs, and revenue figures.
- Feedback surveys: Create NPS surveys with branching logic and six question types.
- REST API: Export data and connect Mouseflow with external systems.
Mouseflow Integrations
Mouseflow lists 40+ integrations, including Google Analytics, Adobe Analytics, Google Tag Manager, Shopify, WordPress, Twilio Segment, Slack, and Microsoft Teams. It also offers an open REST API for custom integrations.
What's Free?
Mouseflow has a free-forever plan with 500 sessions per month, one website project, one conversion funnel, one month of data retention, and unlimited users. New accounts receive 14 days of full-feature access, limited to 2,000 sessions, five projects, and 10 funnels.
Pros and Cons
Pros:
- Combines replays, heatmaps, and funnel views
- Reveals rage clicks and form failures
- Captures friction without custom event instrumentation
Cons:
- Free usage supports only limited ongoing analysis
- Cannot measure feature adoption or retention
Learn more about Mouseflow: Best for mapping the full customer journey free
- Free plan + free demo available
- Pricing upon request
Visit WebsiteCustomer Rating:4.5/5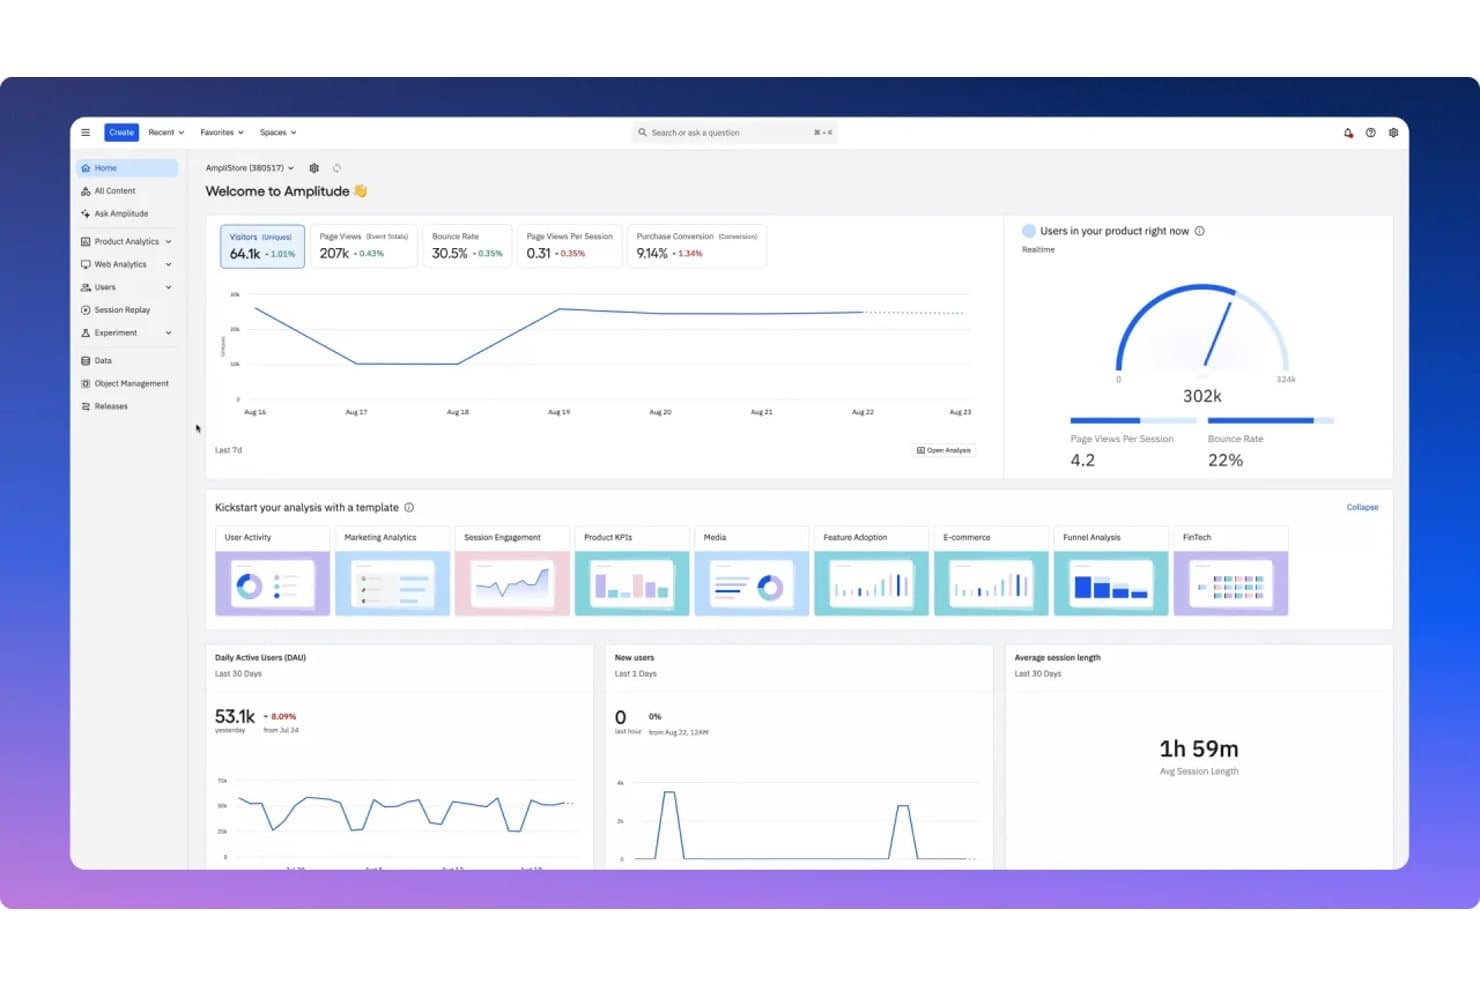
Amplitude centralizes key product metrics in a unified analytics dashboard. Amplitude is a product analytics platform with free event tracking, dashboards, funnel and retention analysis, session replay, feature flags, experiments, guides, and surveys.
Who Is Amplitude Best For?
Product managers and growth teams at startups benefit from Amplitude’s free journey analysis, session replay, funnels, retention reports, and feature experiments.
Why I Picked Amplitude
I picked Amplitude because it’s best for mapping the full customer journey free. Funnels and retention reports show where users convert or drop off, while session replay reveals what happened before they left. I also use feature flags and experiments to connect journey insights with product changes.
Amplitude Key Features
- Web and mobile SDKs: Capture product events across supported platforms.
- Behavioral cohorts: Group users based on shared actions and attributes.
- In-app Guides and Surveys: Create product education and feedback experiences.
- MCP integrations: Connect analytics data with compatible AI tools.
Amplitude Integrations
Amplitude connects to Claude, Cursor, Lovable, and Figma Make through MCP. It also provides developer SDKs and APIs for custom integrations.
What's Free?
Amplitude offers a free-forever plan with unlimited seats and no credit card required. It includes up to 2 million events and 10,000 session replays per month, but limits saved charts to 10 per organization, session replay retention to one month, and experiments, Guides, and Surveys.
Pros and Cons
Pros:
- Includes experiments, guides, and surveys
- Supports product decisions beyond event reporting
- Maps funnels, retention, and replay together
Cons:
- Restricts cohorts, heatmaps, and alert depth
- Limits saved charts and shared workspaces
Learn more about Amplitude: Best for no-code retroactive event tracking
- Free plan available
- Pricing upon request
Visit WebsiteCustomer Rating:4.3/5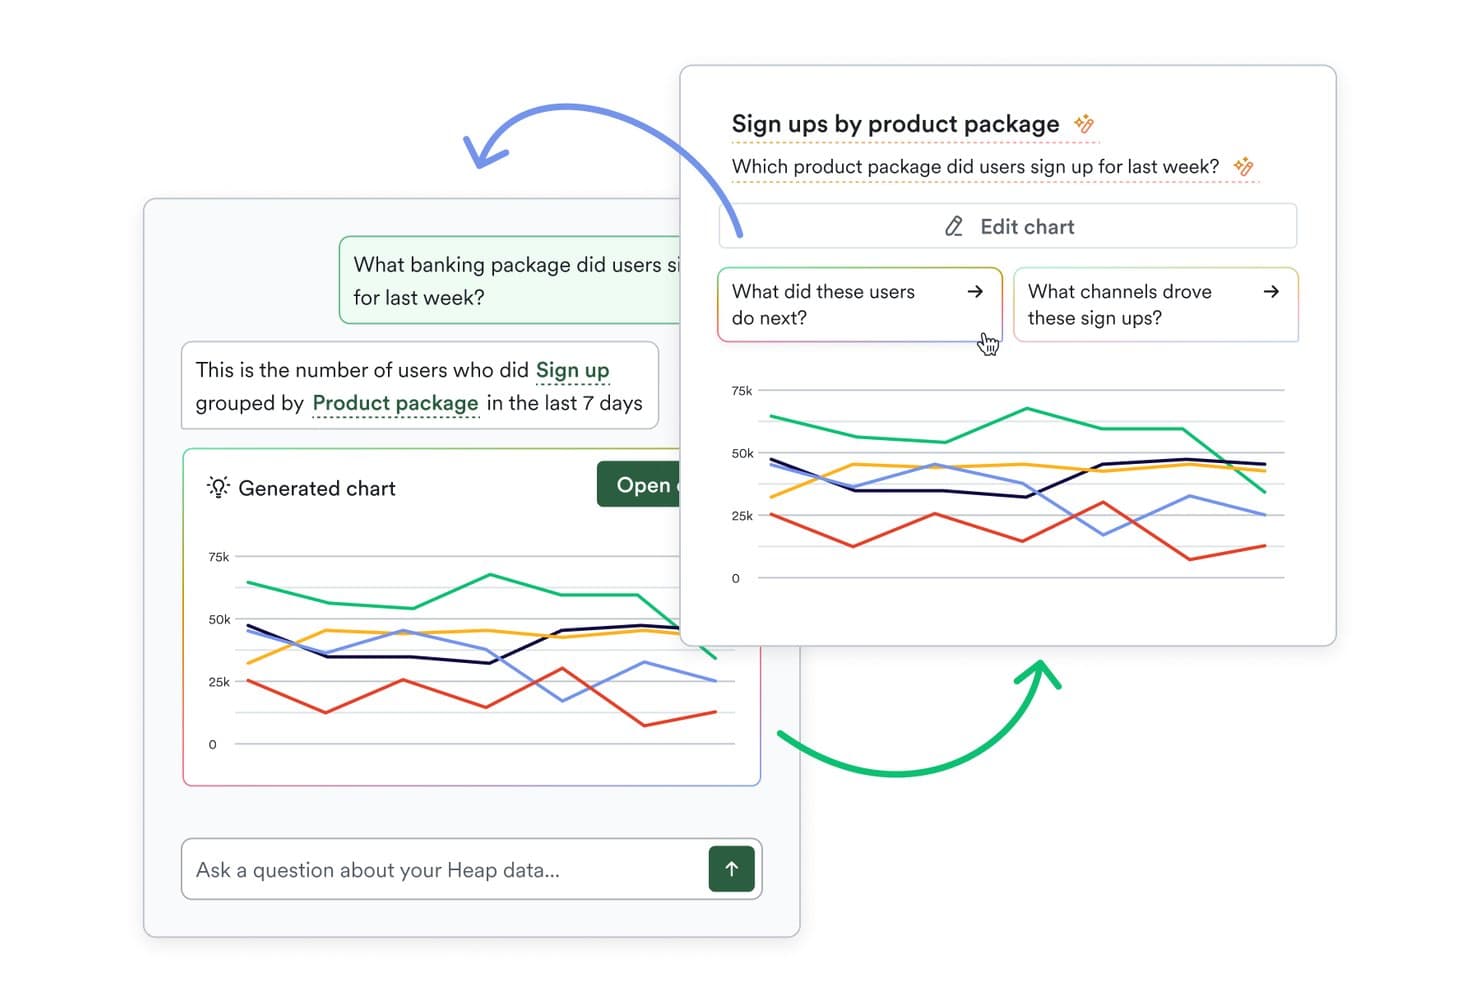
Heap (by Contentsquare) lets users query analytics data using plain language. Heap (by Contentsquare) is a free product analytics platform with autocapture, retroactive event definition, funnels, Journeys, retention reports, dashboards, custom events, and segmentation.
Who Is Heap (by Contentsquare) Best For?
Heap (by Contentsquare) suits product managers and growth teams that need no-code, retroactive event tracking without extensive engineering support.
Why I Picked Heap (by Contentsquare)
I picked Heap (by Contentsquare) for its no-code retroactive event tracking. Autocapture records clicks and pageviews, while visual event labeling lets me define events after collection. I use Funnels and Journeys to trace feature adoption, identify drop-offs, and analyze paths without creating tracking specs first.
Heap (by Contentsquare) Key Features
- Retention reports: Measure returning users across selected time periods.
- Influence reports: Connect product interactions with conversion outcomes.
- Custom event properties: Add attributes to events for deeper analysis.
- Single sign-on: Secure workspace access with SSO support.
Heap (by Contentsquare) Integrations
Native integrations are not clearly documented. Heap supports custom integrations through APIs and lists Guides integrations on its Free plan.
What's Free?
Heap offers a free plan rather than only a time-limited trial. Pricing is otherwise available upon request, and the Free plan includes Guides integrations; Heap doesn’t clearly publish user or event limits.
Pros and Cons
Pros:
- Retention and Influence reports support outcome analysis
- Funnels and Journeys reveal adoption drop-offs
- Retroactive event definition avoids tracking plans
Cons:
- Limited history complicates long-term trend analysis
- Session replay and heatmaps aren’t included
Learn more about Heap (by Contentsquare): Best for behavior analytics and AI-driven insights
- Free plan + free demo + 15-day free trial available
- From $39/month (billed annually)
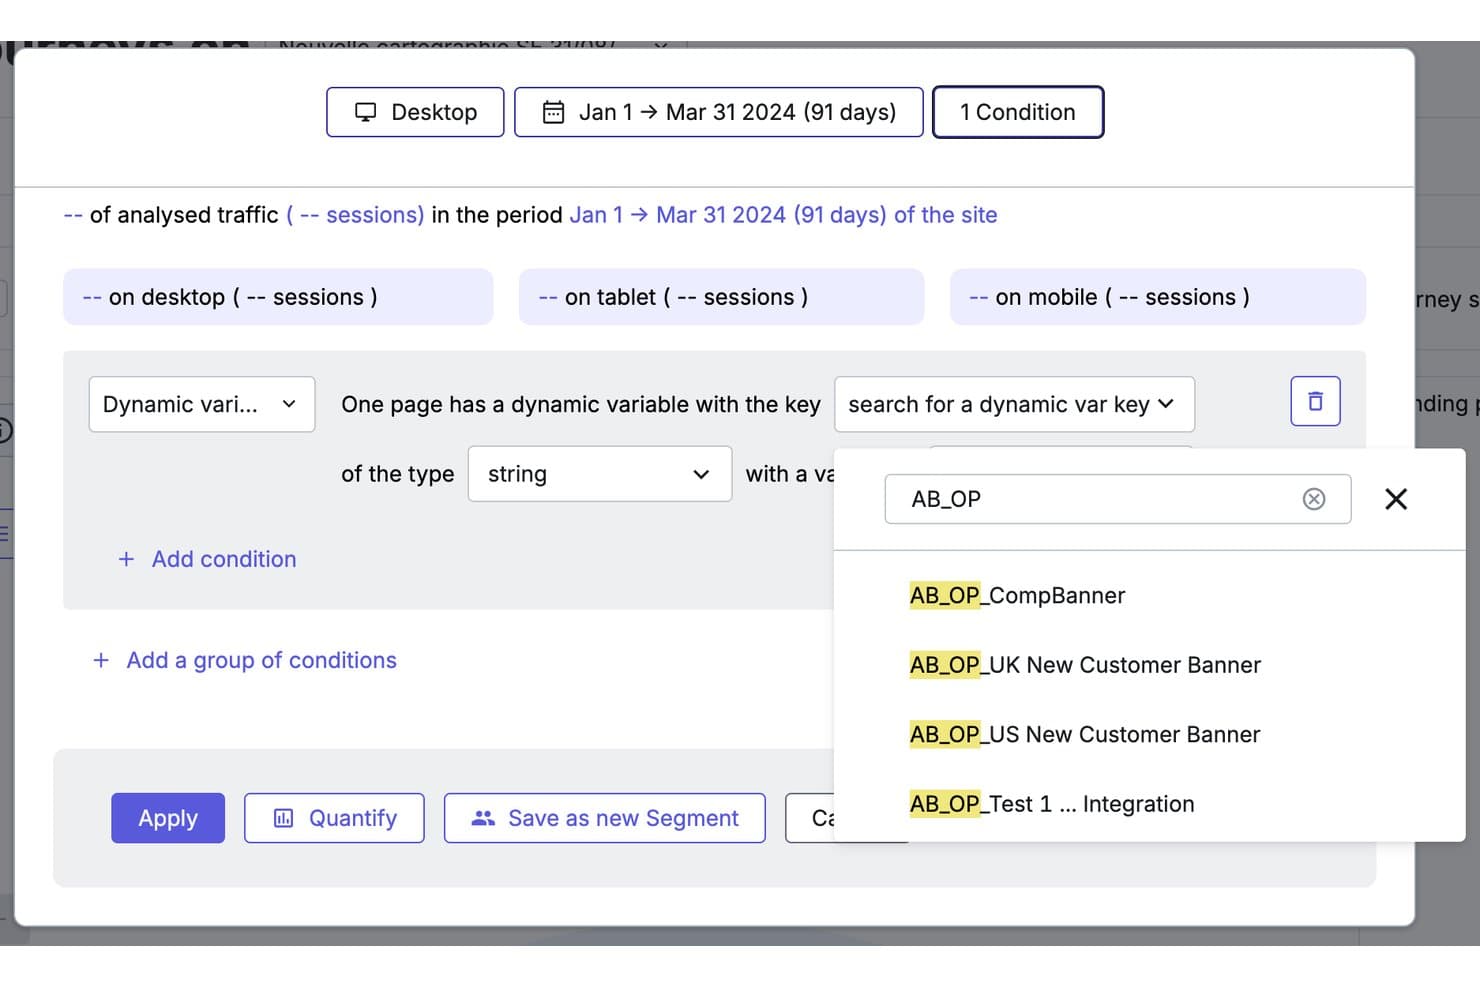
Contentsquare lets users filter sessions by dynamic variables like A/B test flags. Contentsquare is a free product analytics platform combining autocaptured event tracking, funnels, retention, feature adoption, heatmaps, and session replay across its Product Analytics and Experience Analytics products.
Who Is Contentsquare Best For?
Contentsquare suits product managers and growth teams that need heatmaps, session replays, and AI-assisted insights to understand user behavior.
Why I Picked Contentsquare
I picked Contentsquare because it connects behavior analytics with AI-driven insights for product decisions. I use heatmaps and session replay to locate friction, then apply Sense AI summaries and chat to interpret patterns across user journeys. Its Product Analytics tools also track feature adoption, retention, and engagement without requiring extensive event tagging.
Contentsquare Key Features
- Basic funnels: Visualize drop-offs across key user journeys.
- Error monitoring: Track JavaScript errors and basic performance issues.
- Usage dashboards: Filter and review key product metrics in one project.
- Native integrations: Connect Slack, Jira, HubSpot, Mixpanel, and Google Analytics.
Contentsquare Integrations
Contentsquare offers 10+ integrations, including Slack, Jira, Google Analytics, Mixpanel, HubSpot, Microsoft Teams, and Unbounce. It also connects to ChatGPT, Claude, and Copilot through MCP.
What's Free?
Contentsquare offers a free-forever plan, rather than a time-limited trial. Its Product Analytics plan includes unlimited users, 10,000 monthly sessions, and six months of data retention; higher usage limits require an upgrade.
Pros and Cons
Pros:
- AI summaries surface journey friction
- Pairs heatmaps with session replay
- Autocaptures behavior without manual event tagging
Cons:
- Free funnels and segmentation remain basic
- Product analytics has limited sessions and history
Learn more about Contentsquare: Best for privacy-first, unsampled web analytics
- Free plan + free trial available
- From €275/month
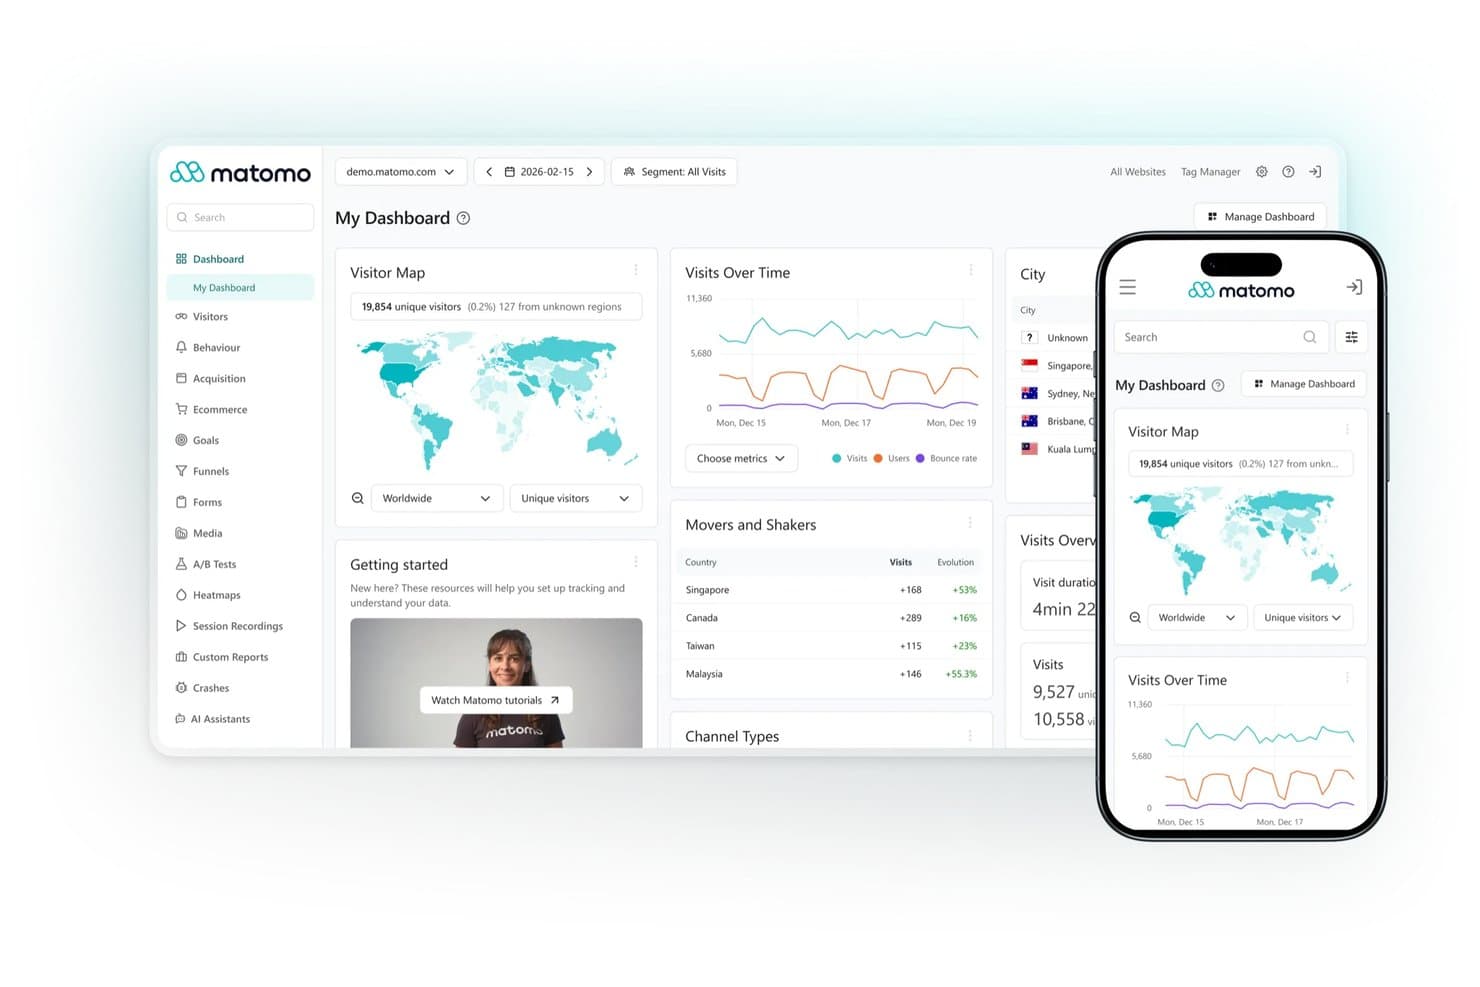
Matomo centralizes visitor analytics across web and mobile dashboards. Matomo is an open-source product analytics platform with self-hosted web analytics, event tracking, customizable dashboards, segmentation, visitor profiles, and reporting APIs.
Who Is Matomo Best For?
Privacy-conscious organizations with engineering support will value Matomo for unsampled, self-hosted web analytics and full data ownership.
Why I Picked Matomo
I picked Matomo because it brings privacy-first, unsampled web analytics to a genuinely free, self-hosted plan with unlimited hits. I use its event tracking, visitor profiles, segmentation, and customizable dashboards to inspect behavior without sending data to a third-party analytics vendor. Its API and data ownership suit teams that need auditable web usage data, though funnels and retention require paid plugins.
Matomo Key Features
- Real-time analytics: Monitor current visitor activity as it happens.
- Scheduled email reports: Send recurring analytics reports to stakeholders.
- Tag Manager: Add and manage tracking tags without backend access.
- Chart annotations: Mark releases, campaigns, and other events directly on reports.
Matomo Integrations
Matomo supports integrations with 100+ technologies, including WordPress, Joomla, Drupal, SharePoint, Magento, WooCommerce, Moodle, and Google, Bing, and Yahoo Search Console. Its HTTP reporting and tracking APIs support custom integrations.
What's Free?
Matomo offers a free-forever, self-hosted plan with unlimited hits and full data ownership. You’ll need to provide your own hosting and technical setup, while features such as funnels and retention require paid plugins.
Pros and Cons
Pros:
- Privacy controls support GDPR-conscious teams
- Full data ownership through self-hosting
- Unlimited unsampled event and web tracking
Cons:
- Server maintenance adds engineering overhead
- Funnels and retention require paid plugins
Learn more about Matomo: Best for a universally-popular choice
- Free plan available
- From $50,000/year (billed annually)
Visit WebsiteCustomer Rating:4.6/5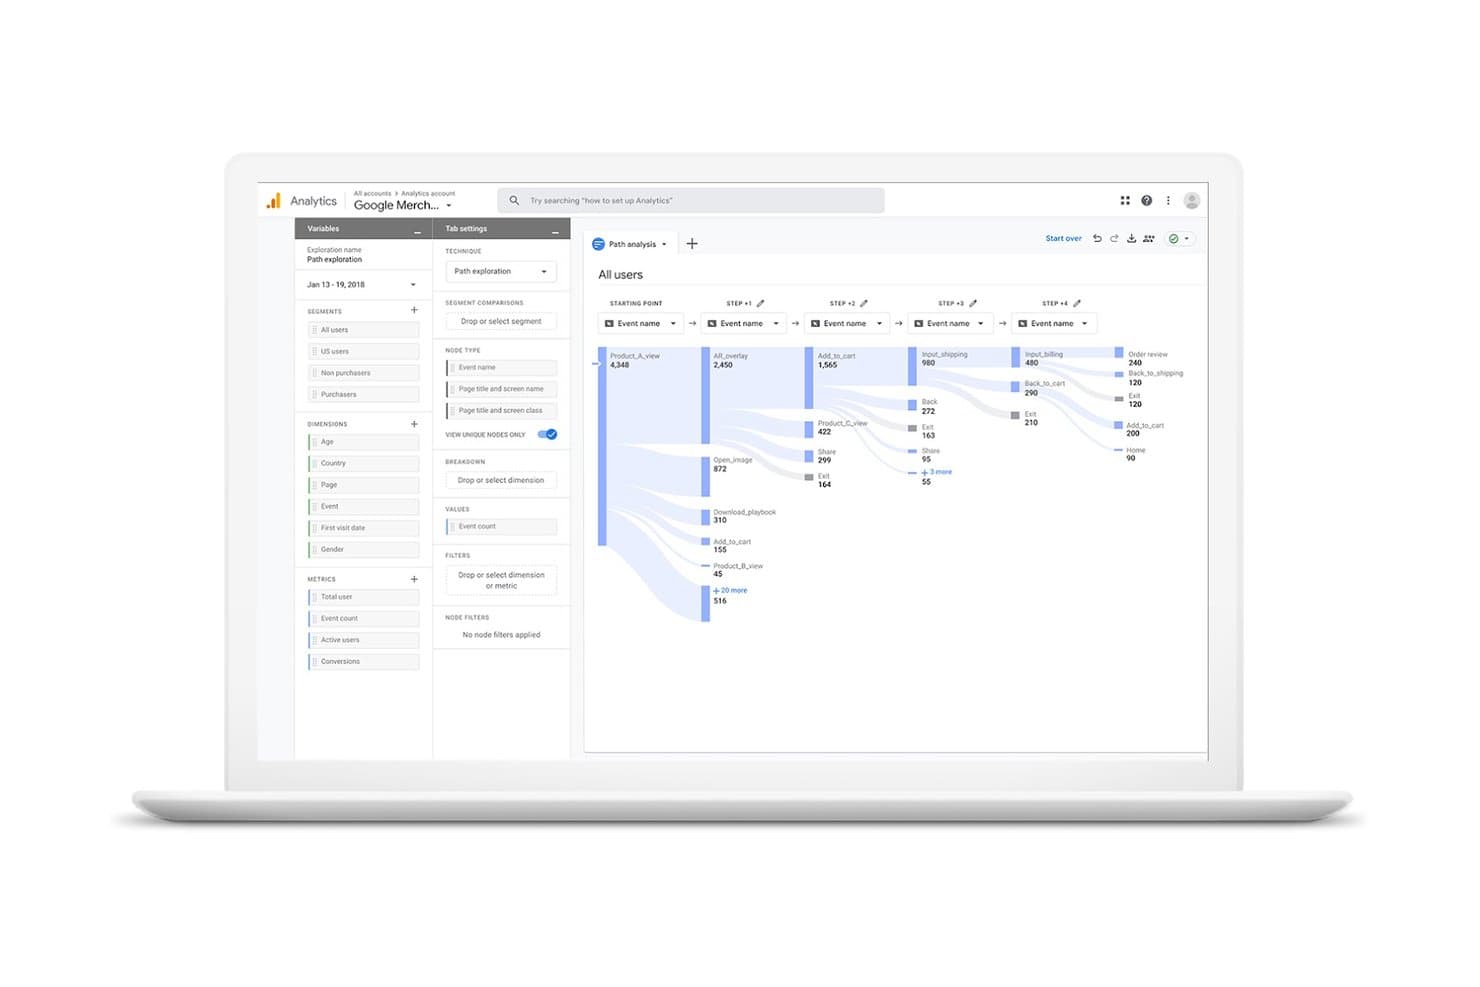
Google Analytics visualizes user journeys across events with path exploration. Google Analytics is a free product analytics platform for tracking web and app events, exploring funnels and retention, segmenting users, and exporting data through BigQuery and the Google ecosystem.
Who Is Google Analytics Best For?
Google Analytics suits growth marketers and lean product teams needing free web-and-app measurement with Google Ads and BigQuery connections.
Why I Picked Google Analytics
I picked Google Analytics as a universally-popular choice because its event model tracks web and app behavior in one property. I use funnel exploration and retention reports to examine feature adoption, then send event data to BigQuery for deeper product analysis. Its broad documentation and familiar reporting model also make findings easier to share across product, marketing, and engineering.
Google Analytics Key Features
- Enhanced measurement: Tracks scrolls, outbound clicks, downloads, and site searches.
- Custom dimensions: Adds user, event, and item attributes to reports.
- Audience builder: Creates audiences from user attributes and behaviors.
- Path exploration: Maps forward and backward journeys through your product.
Google Analytics Integrations
Google Analytics offers native integrations with Google Ads, Search Ads 360, Display & Video 360, BigQuery, and Search Console. Its Data API supports custom integrations.
What's Free?
Google Analytics offers a free-forever standard plan, not a limited-time trial. It includes web and app measurement, but standard properties have lower limits than Analytics 360, including up to 14 months of event-level retention, sampling for explorations exceeding 10 million events, and a 1-million-event daily BigQuery export limit.
Pros and Cons
Pros:
- Exports event data for deeper analysis
- Supports funnels, retention, and behavioral segmentation
- Combines website and app event tracking
Cons:
- Exploration reports face sampling and retention limits
- Lacks session replay and heatmaps
Learn more about Google Analytics: Best for interactive reporting
- Free plan available
- From $120/month (billed annually)
Visit WebsiteCustomer Rating:4.5/5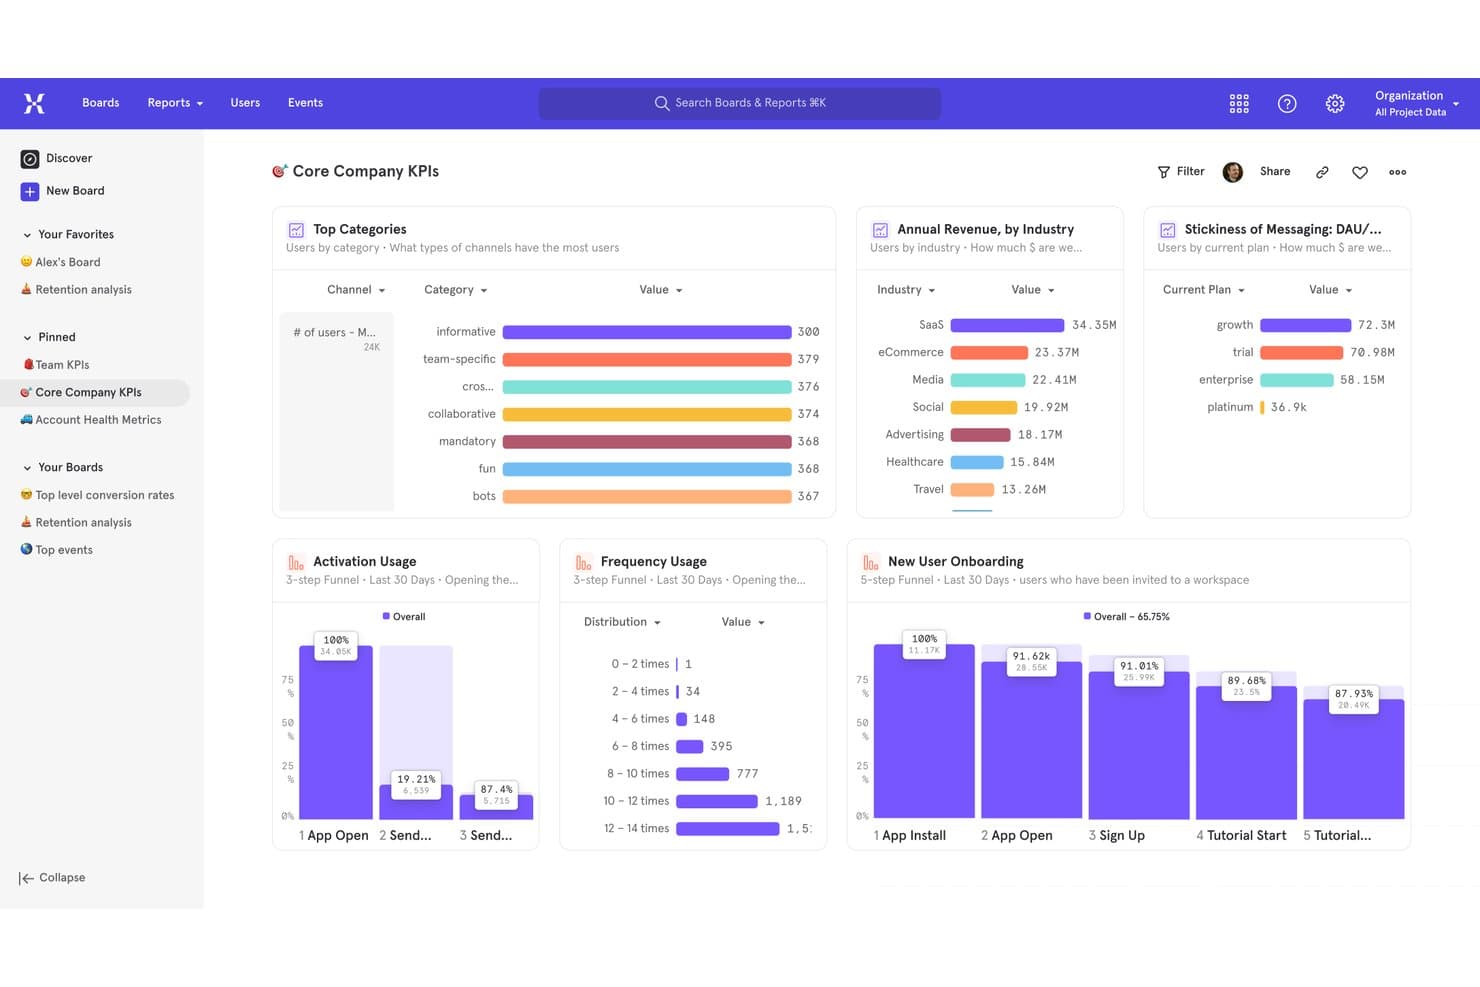
Mixpanel centralizes KPIs, funnels, and revenue metrics in one dashboard. Mixpanel is a product analytics platform with a permanent free tier covering event tracking, interactive reports, funnels, retention, session replay, heatmaps, experiments, and feature flags.
Who Is Mixpanel Best For?
Product managers and analysts at startups can use Mixpanel’s interactive reports to explore user journeys, funnels, and retention.
Why I Picked Mixpanel
I picked Mixpanel because its interactive reporting helps me connect product behavior to decisions. Boards combine Insights, Funnels, Retention, and Flows, so I can investigate a drop-off from conversion to user paths without switching tools. The Free plan adds up to 1 million events monthly, 10,000 session replays, heatmaps, and unlimited seats.
Mixpanel Key Features
- Data dictionary: Define and organize tracked events and properties.
- Query API: Retrieve product data for custom analysis.
- Feature flags: Release changes through percentage rollouts and cohort targeting.
- Privacy controls: Apply masking, blocking, and user privacy APIs.
Mixpanel Integrations
Mixpanel connects to Segment and mParticle, supports OpenFeature for feature flags, and includes ingestion, export, and query APIs for custom integrations.
What's Free?
Mixpanel offers a free-forever plan with unlimited seats, up to 1 million events per month, and 10,000 session replays. It also includes interactive reports, funnels, retention analysis, heatmaps, experiments, and feature flags, but higher usage requires a paid plan.
Pros and Cons
Pros:
- Free feature flags support percentage rollouts
- Session replay includes heatmaps and click detection
- Interactive Boards connect funnels, retention, and Flows
Cons:
- Free cohorts and custom properties remain limited
- Only five saved reports per seat
 Best for free analytics with built-in replay
- Free plan available
- Pricing upon request
Visit WebsiteCustomer Rating:4.5/5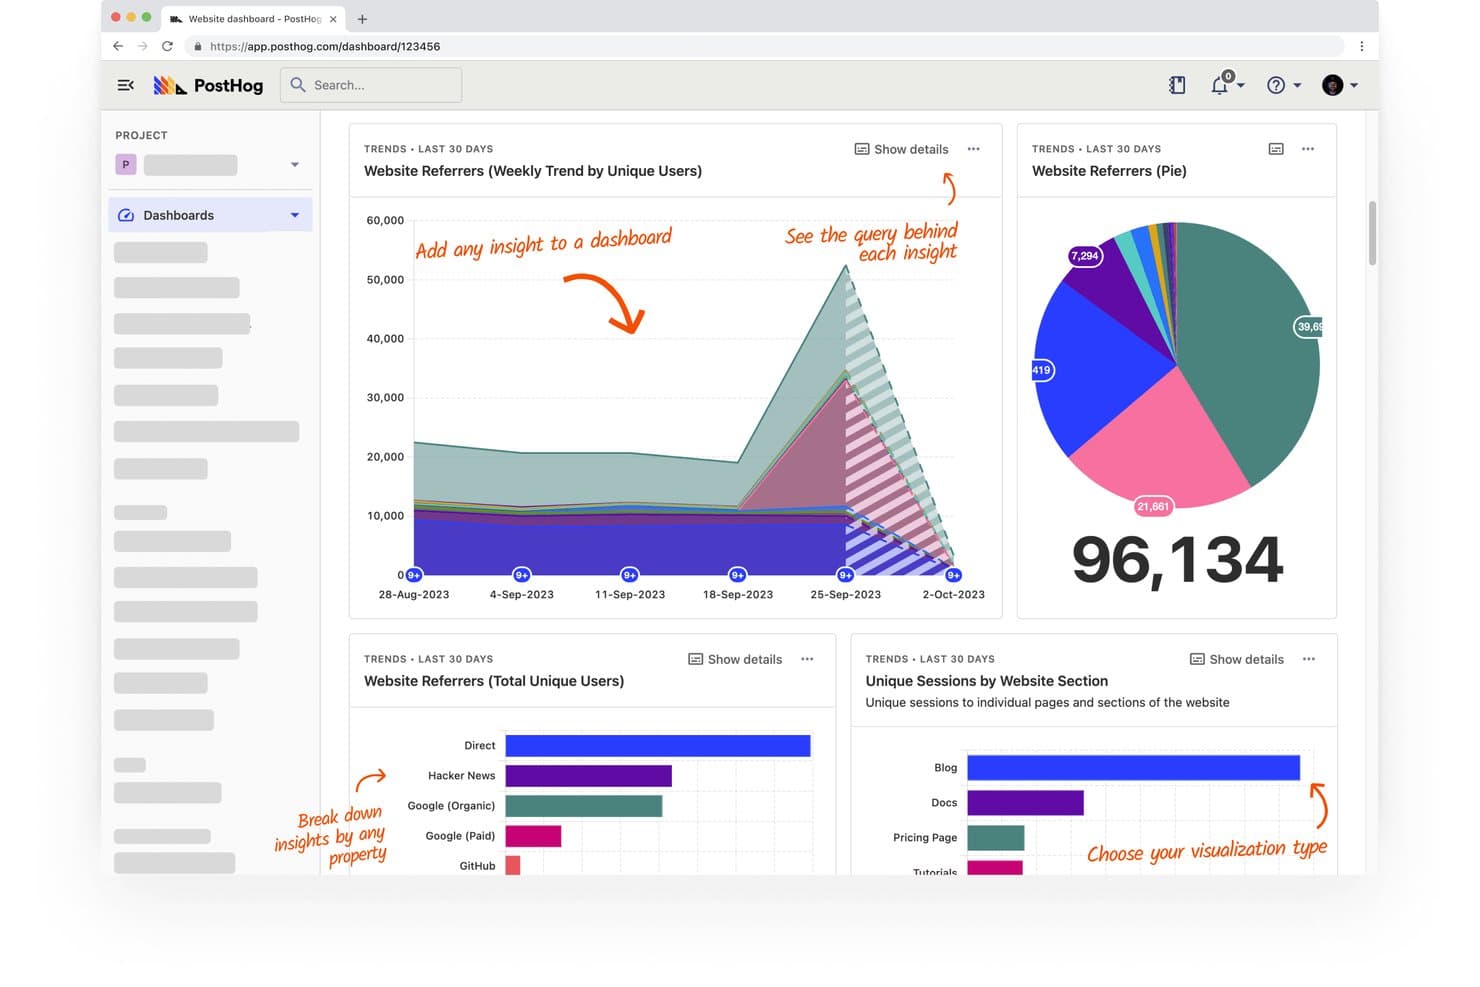
PostHog lets users track website referrers and sessions across visual dashboards. PostHog is a free product analytics platform that combines autocapture, funnels, retention, paths, session replay, feature flags, and experiments in one developer-focused toolkit.
Who Is PostHog Best For?
Product managers, analysts, growth teams, and startup founders who need free product analytics with built-in session replay.
Why I Picked PostHog
I picked PostHog because it combines free product analytics with built-in replay. I use autocapture, funnels, and path analysis to find where users drop off, then jump from a chart to the relevant session recording. Its feature flags and experiments also connect product behavior to release decisions.
PostHog Key Features
- Retention curves: Measure cohort retention across selected time periods.
- HogQL SQL editor: Query product data directly with SQL.
- Heatmaps: Inspect clicks and page engagement visually.
- SDK coverage: Track web, mobile, and backend applications.
PostHog Integrations
PostHog supports integrations with Slack and MCP-compatible tools, including Claude, Cursor, VS Code, Codex, Zed, Replit, Lovable, and Windsurf. Its SDKs connect web, mobile, and backend applications across JavaScript, React, Python, iOS, Android, and other supported stacks.
What's Free?
PostHog has a free-forever plan with no credit card required, including 1 million analytics events and 5,000 session recordings each month. The plan includes one project, one-year event retention, and community support; unused allowances don’t roll over, and usage above the limits is dropped unless you add billing.
Pros and Cons
Pros:
- Funnels reveal drop-offs and retention trends
- Autocapture reduces instrumentation work
- Built-in replay connects behavior to friction
Cons:
- Developer focus challenges nontechnical teams
- Interface can feel clunky for newcomers
Learn more about PostHog: Best for advanced session replay
- 14-day free trial + free plan available
- From $176/month (billed annually)
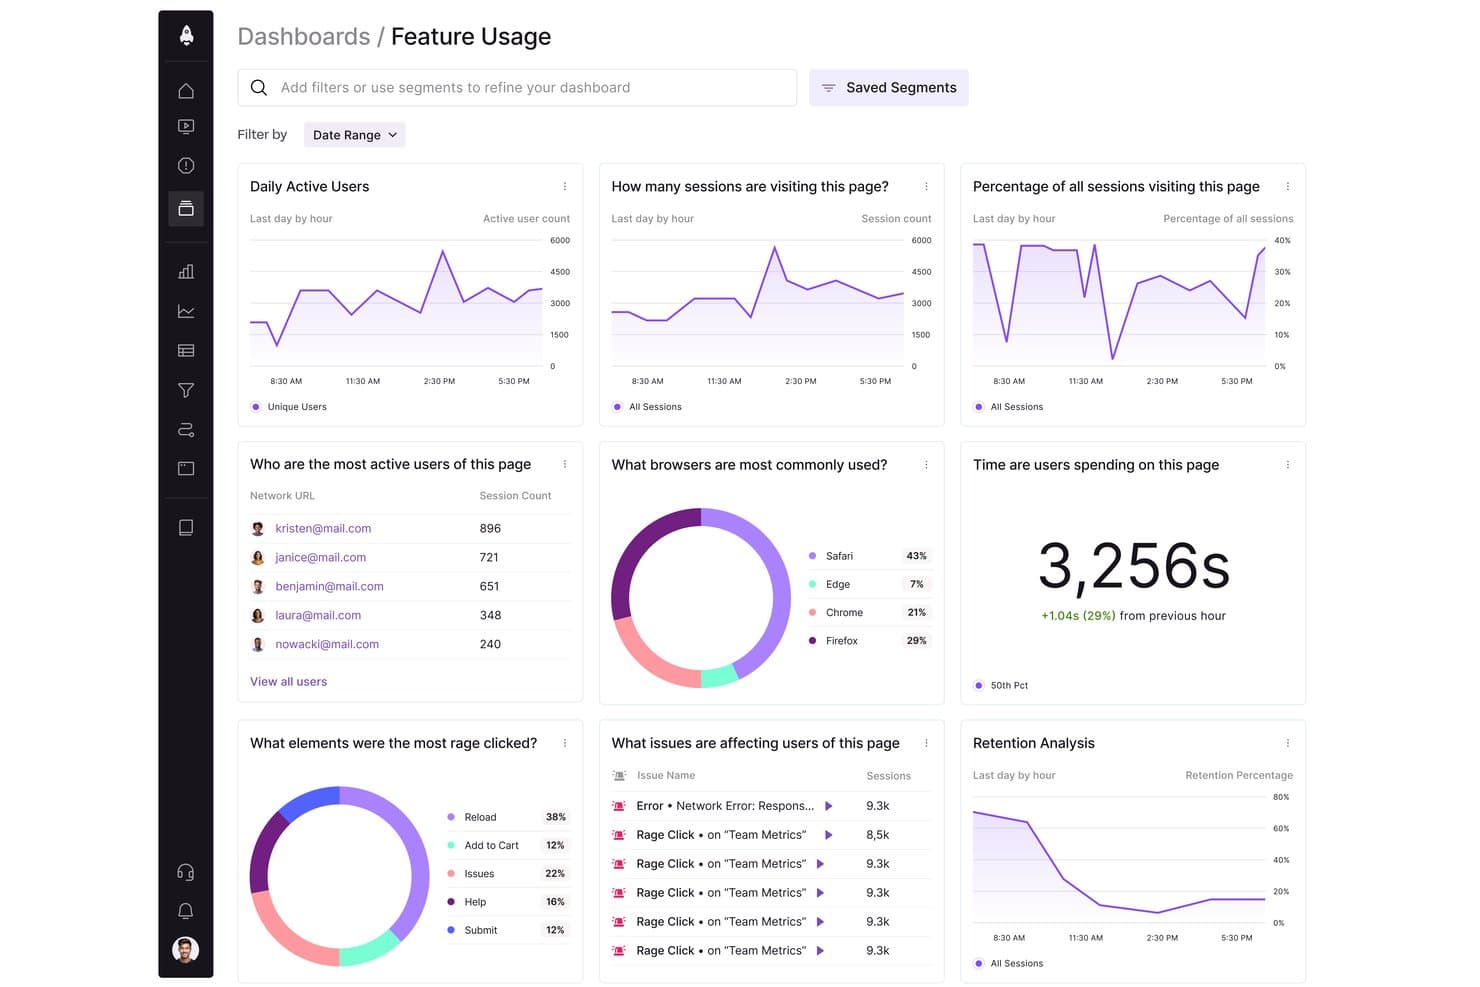
LogRocket tracks user behavior, sessions, and browser usage in one dashboard. LogRocket is a product analytics platform that combines autocaptured event tracking, funnels, retention charts, path analysis, session replay, heatmaps, error monitoring, and technical debugging.
Who Is LogRocket Best For?
LogRocket suits developer-adjacent product teams and analysts who need technical context alongside user behavior data.
Why I Picked LogRocket
I picked LogRocket because it’s best for advanced session replay, combining interaction timelines with errors, network requests, and performance data. I use path analysis, rage-click detection, and similar-session search to trace friction from a funnel drop-off back to the user experience that caused it.
LogRocket Key Features
- Autocapture: Records events, pages, and user actions without code changes.
- Conversion funnels: Shows drop-off points and AI explanations on Pro.
- Retention charts: Measures return usage for products and individual features.
- Behavioral cohorts: Groups users by traits, metadata, and product activity.
LogRocket Integrations
LogRocket offers integrations with Sentry, Bugsnag, Rollbar, Datadog, Jira, GitHub, Cursor, and Claude Code. It also supports hundreds of integrations, API access, and an MCP server for custom connectivity.
What's Free?
LogRocket offers a 14-day free trial, not a free-forever plan, with access to all features and no credit card required. After the trial, paid plans start at $176 per month, with pricing based on monthly sessions captured.
Pros and Cons
Pros:
- Path analysis exposes journey drop-offs and friction
- Autocapture tracks actions without code changes
- Advanced session replay links behavior to errors
Cons:
- Developer-oriented interface slows product analysis
- Limited transparency on price discounts
Learn more about LogRocket: Best for Microsoft-backed free heatmaps and replay
- Free plan available
- Pricing upon request
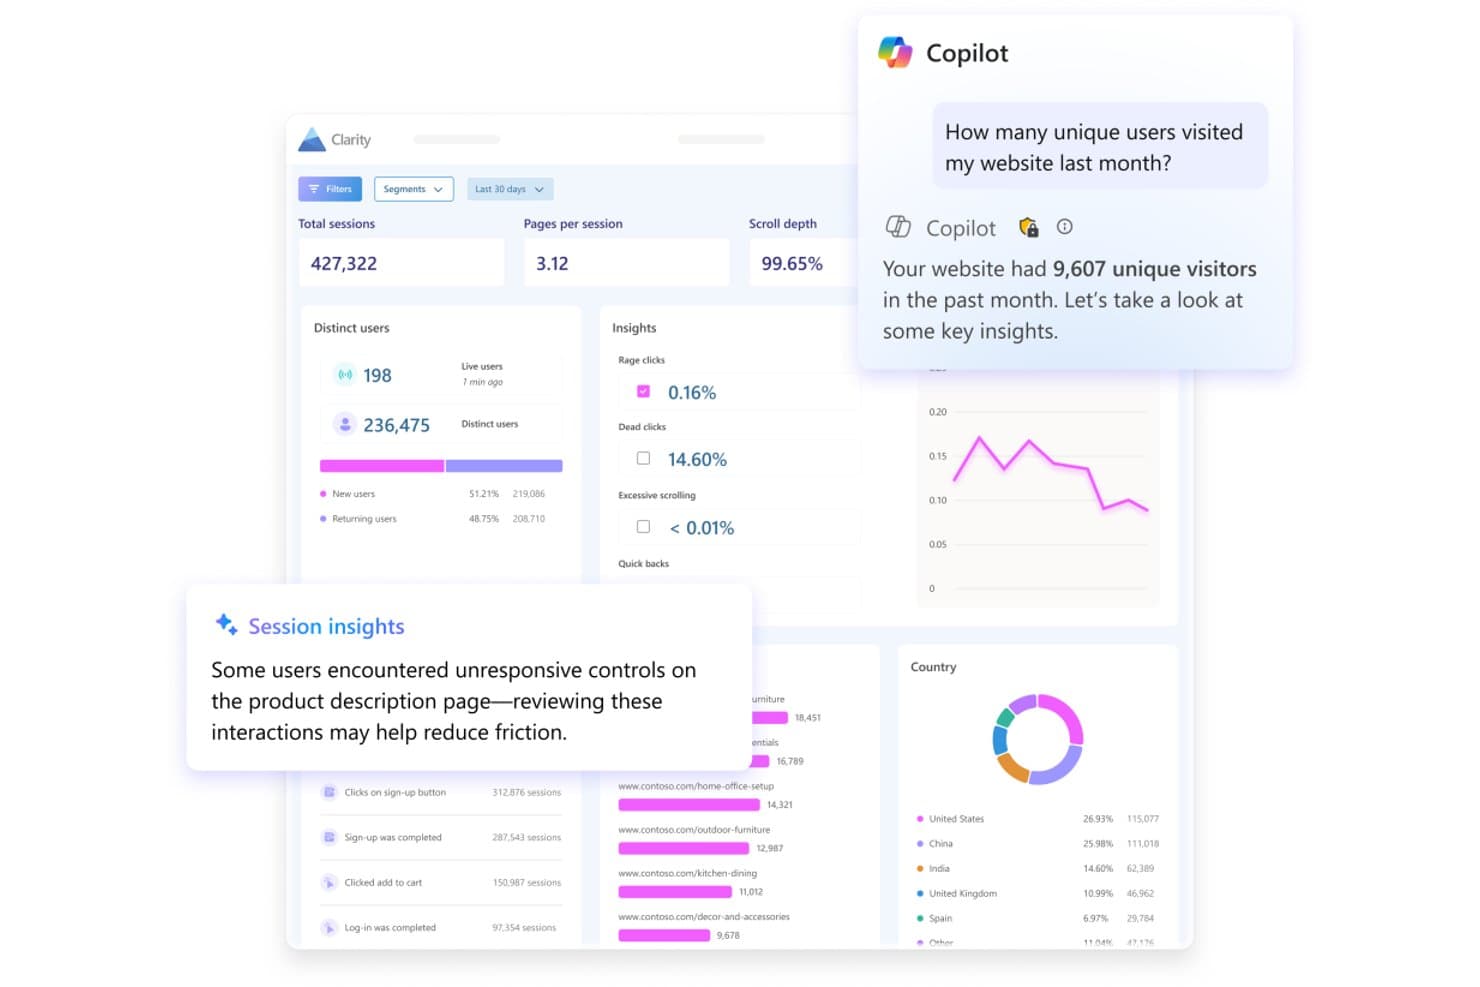
Microsoft Clarity surfaces AI-powered session insights and visitor analytics. Microsoft Clarity is a free product analytics tool with autocaptured behavior data, session recordings, heatmaps, funnels, dashboards, and signals for rage clicks, dead clicks, and other user actions.
Who Is Microsoft Clarity Best For?
Growth marketers and startup founders who need free, no-code insight into user behavior, conversion friction, and website experience.
Why I Picked Microsoft Clarity
I picked Microsoft Clarity for its Microsoft-backed free heatmaps and replay. I use click, scroll, area, rage-click, and dead-click heatmaps to find friction on key pages, then review DOM-based recordings to understand each session. Funnels connect drop-offs with recordings and heatmaps for faster conversion diagnosis.
Microsoft Clarity Key Features
- Autocapture: Records clicks, scrolls, mouse movements, and page rendering automatically.
- Smart Events: Tracks purchases, sign-ups, logins, downloads, and other conversion actions.
- Saved segments: Filters data by device, browser, country, URL, referrer, and session duration.
- Mobile SDKs: Supports Android, iOS, React Native, Flutter, and Cordova apps.
Microsoft Clarity Integrations
Microsoft Clarity offers documented integrations with Google Analytics, Google Tag Manager, WordPress, Shopify, Wix, Squarespace, Weebly, and CookieYes. Its Data Export API supports custom integrations.
What's Free?
Microsoft Clarity is free forever, with no traffic limits or required upgrade to a paid plan. All core features are included, but advanced data exports and API access may require separate setup or usage limits.
Pros and Cons
Pros:
- Funnels connect drop-offs to recordings
- Rage-click signals expose conversion friction
- Microsoft-backed heatmaps and replay
Cons:
- Export API lacks raw event data
- No retention or cohort analysis
Learn more about Microsoft Clarity:
Diğer Ücretsiz Ürün Analitiği Araçları
Ücretsiz planlar veya deneme sürümleri sunan bazı ek ürün analitiği aracı seçenekleri şunlardır. Bu araçlar kısa listeme girememiş olsa da yine de göz atmaya değer:
- 11Open Web AnalyticsBest for open-source self-hosted data ownership
- 12UmamiBest for privacy-first, self-hosted web analytics
How I Evaluate Free Product Analysis Tools
First, I define what counts as free. Product analysis is an ongoing function, so I only consider tools with a long-term free plan—not a trial. From there, I split my evaluation into three parts: core functionality, which carries the most weight, like capturing user events and surfacing usage dashboards; standout features, like autocapture tracking; and what a tool offers beyond its feature set, like how cleanly it scales from free to paid.
Core Functionality (Table Stakes For This List)
In addition to my free plan requirements, I use a scoring system to select tools for my list. I score each one on a scale from 0 (does not offer the functionality) to 5 (excels in this area) for each core functionality listed below, based on what's available on the free plan. I then convert the total into a percentage to help assess each tool's overall fit, with extra weight on any functionalities I've deemed essential.
- Event & Behavior Tracking (Essential): I check whether custom events, clicks, and pageviews are captured with enough volume for a growing product's daily active users.
- Usage Dashboards & Reporting (Essential): The free plan should include visual dashboards that surface key metrics like DAU, feature usage, and trends without manual setup.
- Funnel & Retention Analysis: I evaluate whether you can build multi-step funnels and view cohort retention curves to pinpoint where users drop off after onboarding.
- Segmentation: Filtering by user properties, behaviors, or cohorts matters—I look for combinable filters, like isolating mobile users who completed signup.
- Data Export or Integration: I check for CSV exports, API access, or native connections to warehouses and tools like BigQuery, Slack, or Hubspot on the free tier.
- Session or Path Analysis: Path visualizations or session replays help trace how users move through a product, so I look at depth and volume limits here.
Once I have a list of tools that meet the criteria, I consider what sets each platform apart.
Differentiating Factors (What Sets Vendors Apart)
Here's how I compare and contrast different vendors:
Standout Features
Autocapture tracking is the first thing I check. Tools like PostHog and Heap record clicks, taps, and pageviews without manual instrumentation, which means you get usable data within minutes of installing the snippet. Session replay access is equally valuable—I look for free tiers that let you watch real user sessions so you can see exactly where someone hesitates during checkout or abandons a multi-step form. Heatmaps round this out by showing aggregate click and scroll patterns across key pages, giving you quick UX reads without building custom reports.
Beyond Features
I check whether a tool lets you export raw event data on the free tier, since teams that can't pull CSVs or hit a basic API risk losing months of behavioral data if they switch platforms later. Self-serve setup matters just as much—I look for SDKs, tag manager support, and starter templates that let a PM get tracking live without filing an engineering ticket. Privacy posture rounds this out: tools like PostHog and Matomo offer cookie-less or self-hosted options, which saves early-stage teams from scrambling to retrofit GDPR compliance after launch.
Ücretsiz Ürün Analitiği Aracı Nasıl Seçilir
Karmaşık özellik listeleri ve fiyatlandırma yapıları, ücretsiz bir ürün analitiği aracından gerçekte ne elde ettiğinizi anlamanızı zorlaştırabilir. Yazılım seçim sürecinizde ilerlerken odağınızı korumanıza yardımcı olmak için göz önünde bulundurmanız gereken bazı faktörler şunlardır:
| Faktör | Dikkat Edilmesi Gerekenler |
|---|---|
| FaktörÜcretsiz teklif kapsamı | Dikkat Edilmesi GerekenlerÜcretsiz planda nelerin bulunduğunu kontrol edin. Kullanıcı takibi ve analizler gibi temel özellikleri gizli maliyetler veya sınırlamalar olmadan kapsadığından emin olun. |
| FaktörÖlçeklenebilirlik | Dikkat Edilmesi GerekenlerAracın ihtiyaçlarınızla birlikte büyüyüp büyüyemeyeceğini değerlendirin. Kolay yükseltme seçenekleri sunan ve işletmeniz büyüdükçe artan veri hacimlerini işleyebilen çözümleri tercih edin. |
| FaktörEntegrasyonlar | Dikkat Edilmesi GerekenlerAracın mevcut yazılım yığınınızla entegre olduğundan emin olun. Popüler entegrasyonlar arasında CRM sistemleri, pazarlama platformları ve veri görselleştirme araçları bulunabilir. |
| FaktörKullanım kolaylığı | Dikkat Edilmesi GerekenlerKullanıcı arayüzünü ve öğrenme eğrisini değerlendirin. Ek kapsamlı eğitimler gerektirmeden ekibinizin hızlıca anlayıp kullanabileceği bir çözüm seçin. |
| FaktörVeri güvenliği | Dikkat Edilmesi GerekenlerAracın veri koruma önlemlerini değerlendirin. İlgili düzenlemelere uyduğundan ve veri şifreleme ile kullanıcı erişim denetimleri gibi özellikler sunduğundan emin olun. |
| FaktörÖzelleştirme | Dikkat Edilmesi GerekenlerRaporların ve panoların özelleştirilmesine olanak tanıyan araçları tercih edin. Bu, içgörüleri işletmenizin özel ihtiyaçlarına ve iş akışlarına uyarlamanıza yardımcı olur. |
| FaktörMüşteri desteği | Dikkat Edilmesi GerekenlerMüşteri desteğinin kullanılabilirliğini ve kalitesini kontrol edin. Canlı sohbet, bilgi tabanı ve topluluk forumlarına erişim değerli kaynaklar olabilir. |
| FaktörAnaliz derinliği | Dikkat Edilmesi GerekenlerSunulan analizlerin kapsamını belirleyin. Yalnızca yüzeysel ölçümler yerine kullanıcı davranışı ve etkileşimi hakkında ayrıntılı içgörüler sunduğundan emin olun. |
Ücretsiz Ürün Analizi Araçları Nedir?
Ücretsiz ürün analizi araçları, ücret ödemek zorunda kalmadan insanların ürününüzü nasıl kullandığını izlemenize ve anlamanıza yardımcı olan yazılımlardır. Ürün yöneticileri, pazarlamacılar ve UX tasarımcıları bu araçları kullanıcı davranışındaki eğilimleri belirlemek, nelerin işe yaradığını görmek ve ürününüzü iyileştirmenin yollarını bulmak için kullanır. Kullanıcı ve etkinlik takibi gibi temel özelliklerle insanların uygulamanızla veya web sitenizle nasıl etkileşim kurduğuna dair hızlı ve görsel yanıtlar elde ederek bütçenizi zorlamadan daha akıllı kararlar verebilirsiniz.
Özellikler
Ürün analizi araçlarında yaygın olarak bulunan özellikleri ve bunların ücretsiz ve ücretli planlarda genellikle hangilerinin sunulduğunu inceleyelim.
Genellikle Ücretsiz Ürün Analizi Araçlarında Bulunan Özellikler
- Kullanıcı takibi: Kullanıcı etkileşimlerini ve davranışlarını izleyerek kullanıcıların ürününüzle nasıl etkileşim kurduğunu anlamanıza yardımcı olur.
- Etkinlik takibi: Kullanıcıların gerçekleştirdiği belirli eylemleri kaydederek kullanıcı yolculukları ve özellik kullanımı hakkında içgörüler sunar.
- Veri görselleştirme: Karmaşık verileri daha erişilebilir ve yorumlanması daha kolay hâle getirmek için grafikler ve çizelgeler sunar.
- Gerçek zamanlı analizler: Anında veri güncellemeleri sağlayarak kullanıcı davranışlarına ve eğilimlerine hızlıca tepki vermenize olanak tanır.
- Temel raporlama: Hızlı içgörüler için temel ölçümleri ve kullanıcı etkinliklerini özetleyen gerekli raporları oluşturur.
- Oturum tekrarları: Gezinme kalıplarını anlamak ve kullanılabilirlik sorunlarını belirlemek için kullanıcı oturumlarını görüntülemenize olanak tanır.
- Isı haritaları: Sitenizdeki yüksek etkinlik alanlarını görselleştirerek kullanıcıların en fazla nerede etkileşim kurduğunu görmenize yardımcı olur.
- Geri bildirim toplama: Kullanıcı memnuniyetini ve ihtiyaçlarını anlamak için anketler veya oylamalar aracılığıyla kullanıcı geri bildirimlerini toplar.
Genellikle Ücretli Ürün Analizi Araçlarında Bulunan Özellikler
- Gelişmiş segmentasyon: Hedefli içgörüler için birden fazla ölçüte dayalı ayrıntılı kullanıcı grubu analizleri yapılmasını sağlar.
- A/B testi: Hangisinin daha iyi performans gösterdiğini belirlemek ve kullanıcı deneyimini iyileştirmek için farklı ürün sürümlerini karşılaştırır.
- Öngörücü analizler: Gelecekteki kullanıcı davranışlarını ve eğilimlerini tahmin etmek için geçmiş verileri kullanarak karar verme sürecine yardımcı olur.
- Özel panolar: Ekibiniz için en önemli ölçümlere odaklanmak üzere kişiselleştirilmiş veri görünümlerine olanak tanır.
- Dönüşüm hunisi analizi: Kullanıcıların hangi noktada süreci terk ettiğini belirlemek ve dönüşüm oranlarını iyileştirmek için kullanıcı yollarını izler.
- Kohort analizi: Elde tutma ve davranışları anlamak için ortak özelliklere sahip kullanıcı gruplarını zaman içinde analiz eder.
- Veri entegrasyonu: Kullanıcı etkileşimlerine ilişkin daha kapsamlı bir görünüm sunmak için diğer veri kaynaklarına bağlanır.
- Veri yönetişimi: Veri bütünlüğünü ve güvenliğini koruyarak veri kalitesini ve düzenlemelere uyumluluğu sağlar.
Avantajlar
Ücretsiz ürün analizi araçlarını uygulamak ekibiniz ve işletmeniz için çeşitli avantajlar sağlar. Faydalanabileceğiniz avantajlardan bazıları şunlardır:
- Uygun maliyetli içgörüler: Para harcamadan kullanıcı davranışı hakkında değerli içgörüler elde ederek veriye dayalı kararlar almanıza yardımcı olur.
- Kullanıcı etkileşimi takibi: Kullanıcıların ürününüzle nasıl etkileşim kurduğunu izleyerek gerçek verilere dayalı şekilde kullanıcı deneyimini geliştirmenizi sağlar.
- Anında geri bildirim: Kullanıcı eğilimlerini hızlıca anlamak ve değişikliklere etkili bir şekilde yanıt vermek için gerçek zamanlı analizlere erişin.
- Görsel veri sunumu: Karmaşık verileri kolayca yorumlamak ve bulguları ekibinizle paylaşmak için veri görselleştirme özelliklerini kullanın.
- Artan kullanıcı memnuniyeti: Anketler ve oylamalar aracılığıyla kullanıcı geri bildirimleri toplayarak kullanıcı ihtiyaçlarını karşılamanıza ve memnuniyeti artırmanıza yardımcı olur.
- Sorunlu noktaların belirlenmesi: Kullanılabilirlik sorunlarını tespit etmek ve ürün tasarımını geliştirmek için oturum tekrarlarını ve ısı haritalarını kullanın.
- Ölçeklenebilirlik: Temel özelliklerle başlayın ve ihtiyaçlarınız arttıkça planınızı yükselterek analiz yeteneklerinizin işletmenizle birlikte genişlemesini sağlayın.
Maliyetler & Fiyatlandırma
Bu makaleye ücretsiz olarak sunulan en iyi ürün analitiği araçlarını bulmak için geldiğinizi biliyorum. Ancak ücretsiz planlar yalnızca sınırlı özellikler sunduğundan gelecekte planınızı yükseltmeniz gerekebilir.
Aşağıdaki tablo, ürün analitiği araçları çözümlerindeki yaygın planları, ortalama fiyatlarını ve genellikle sunulan özellikleri özetlemektedir:
Ürün Analitiği Araçları İçin Plan Karşılaştırma Tablosu
| Plan Türü | Ortalama Fiyat | Yaygın Özellikler |
|---|---|---|
| Plan TürüÜcretsiz Plan | Ortalama Fiyat$0 | Yaygın ÖzelliklerTemel kullanıcı takibi, etkinlik takibi, veri görselleştirme, gerçek zamanlı analizler ve geri bildirim toplama. |
| Plan TürüKişisel Plan | Ortalama Fiyat$5-$25/kullanıcı/ay | Yaygın ÖzelliklerGelişmiş kullanıcı takibi, özelleştirilebilir gösterge panelleri, dönüşüm hunisi analizi, kohort analizi ve temel entegrasyonlar. |
| Plan Türüİşletme Planı | Ortalama Fiyat$50-$150/kullanıcı/ay | Yaygın ÖzelliklerKapsamlı analizler, A/B testi, tahmine dayalı analizler, gelişmiş segmentasyon ve kapsamlı entegrasyonlar. |
| Plan TürüKurumsal Plan | Ortalama Fiyat$200+/kullanıcı/ay | Yaygın ÖzelliklerTam özelleştirme, özel destek, veri yönetişimi, sınırsız veri depolama ve kurumsal düzeyde entegrasyonlar. |
Ücretsiz Ürün Analitiği Araçları SSS
Ücretsiz ürün analitiği araçları hakkında sık sorulan bazı soruların yanıtlarını burada bulabilirsiniz:
Ücretsiz ürün analitiği araçları, ücretli sürümlerden nasıl farklıdır?
Ücretsiz ürün analitiği araçları genellikle kullanıcı izleme, olay izleme ve temel raporlama gibi temel özellikler sunar. Ücretli sürümler ise genellikle A/B testleri, tahmine dayalı analitik ve daha ayrıntılı veri analizi gibi gelişmiş özellikler sağlar. İhtiyaçlarınız arttıkça, bu ek özelliklere erişmek için yükseltme yapmanın yararlı olduğunu düşünebilirsiniz.
Kapsamlı veri analizi için ücretsiz ürün analitiği araçlarına güvenebilir miyim?
Ücretsiz araçlar başlangıç yapmak için harika olsa da kapsamlı veri analizi için gereken derinliği sunmayabilir. Temel içgörüler sağlar, ancak ayrıntılı segmentasyon veya tahmine dayalı analitik gibi gelişmiş özelliklerden yoksun olabilir. Ekibiniz daha ayrıntılı veri analizine ihtiyaç duyuyorsa ücretli bir plana geçmeyi değerlendirin.
Ücretsiz ürün analitiği araçlarını kullanırken hangi sınırlamalarla karşılaşmayı beklemeliyim?
Ücretsiz ürün analitiği araçları genellikle veri sınırları, kısıtlı özellikler ve daha az sayıda entegrasyon gibi sınırlamalarla birlikte gelir. Bu kısıtlamalar, elde edebileceğiniz içgörülerin derinliğini etkileyebilir. Hedeflerinizle uyumlu olduklarından emin olmak için bu sınırlamaları ekibinizin ihtiyaçlarıyla karşılaştırarak değerlendirmeniz önemlidir.
Ücretsiz ürün analitiği araçları güvenli midir?
Ücretsiz ürün analitiği araçlarının çoğu güvenliğe öncelik vererek temel veri koruma önlemleri sunar. Ancak ücretli sürümlerle aynı düzeyde güvenlik veya uyumluluk özellikleri sağlamayabilirler. Güvenlik ekibiniz için önemli bir endişeyse seçtiğiniz aracın güvenlik protokollerini doğruladığınızdan emin olun.
Ücretsiz plandan ücretli plana geçmek ne kadar kolaydır?
Ücretsiz plandan ücretli plana geçiş genellikle kolaydır. Çoğu sağlayıcı, açık talimatlarla birlikte basit bir yükseltme süreci sunar. Mevcut verilerinizi ve ayarlarınızı koruyarak ihtiyaçlarınız geliştikçe sorunsuz bir geçiş yapabilirsiniz.
Ücretsiz ürün analitiği araçları müşteri desteği sunar mı?
Ücretsiz ürün analitiği araçları genellikle sınırlı müşteri desteği seçenekleri sunar. SSS bölümleri, forumlar ve bilgi tabanları gibi çevrimiçi kaynaklara erişiminiz olabilir. Canlı sohbet veya özel müşteri yöneticileri gibi daha kişiselleştirilmiş destek için ücretli bir planı değerlendirmeniz gerekebilir.