

İş zekâsı platformları, daha akıllı iş kararlarını desteklemek üzere verileri toplamanıza, analiz etmenize ve görselleştirmenize olanak tanıyan yazılım araçlarıdır. En iyi iş zekâsı platformlarını karşılaştırıyorsanız muhtemelen karmaşık verileri işleyebilen, uygulanabilir içgörüler sunan ve ekibinizin çalışma biçimine uyum sağlayan araçlar arıyorsunuzdur; yalnızca başka bir gösterge tablosu değil.
Buradaki doğru seçim, performansı izleme, eğilimleri fark etme ve gerçek iş zorluklarına hızla tepki verme becerinizi şekillendirir. Bu listede farklı sektörleri, kullanım alanlarını ve ekip ihtiyaçlarını destekleyen seçenekleri bulabilir, böylece işletmenizi 2026 yılında ileriye taşıyacak çözümü seçebilirsiniz.
Why Trust Our Software Recommendations
6,700+
Reviews
20
Industry experts
16+
Evaluation factors
14
Years
Our team has been testing and reviewing software since 2012. As product managers ourselves, we know how difficult—and important—it is to choose the right software.
For this guide, we evaluated tools using hands-on testing and independent research, scoring tools using our selection criteria.
Our reviews reflect our human editorial judgment, not a sales pitch.
Expert reviewers:
- Andrew LumbySenior TPM
- Cristiano ValimSenior UI/UX Lead


İş Zekâsı Platformları Karşılaştırma Tablosu
En iyi iş zekâsı platformu seçimlerim için fiyatlandırma ayrıntılarını bu karşılaştırma tablosunda özetliyorum:
Score legend (out of 5)
- Excellent4.5–5
- Good4–4.4
- Average3–3.9
- Below average2–2.9
- Poor1–1.9
Sorted by: Default
| Tool | Starting Price | Website | |||||||
|---|---|---|---|---|---|---|---|---|---|
Best for advanced visual analytics tools | 4.3 out of 5 | 3 | 4 | 4 | 5 | 5 | 5 | Pricing upon request 14-day free trial | Website |
Best for scalable cloud data management | 4.3 out of 5 | 4 | 4 | 4 | 4 | 5 | 5 | Pricing upon request 30-day free trial | Website |
Best for integrated strategy tracking | 4.3 out of 5 | 3 | 5 | 4 | 5 | 5 | 4 | Pricing upon request Free demo available | Website |
Best for scalable multi-tenant analytics | 4.0 out of 5 | 3 | 4 | 4 | 5 | 4 | 4 | Pricing upon request 30-day free trial + free demo available | Website |
Best for governed enterprise report distribution | 4.2 out of 5 | 3 | 4 | 5 | 4 | 5 | 4 | $11.25/user/month 30-day free trial available | Website |
Best for governed semantic modeling at scale | 4.2 out of 5 | 5 | 5 | 3 | 4 | 4 | 4 | $162.30/month for up to 10 users 30-day free trial available | Website |
Best for open-source analytical flexibility | 4.2 out of 5 | 5 | 4 | 4 | 4 | 4 | 4 | $100/month 14-day free trial + free plan available | Website |
Best for natural language search analytics | 4.3 out of 5 | 5 | 4 | 4 | 5 | 4 | 4 | $25/user/month 14-day free trial + free demo available | Website |
Best for spreadsheet-style data exploration | 4.0 out of 5 | 4 | 4 | 4 | 5 | 3 | 4 | $300/month 7-day free trial + free demo available | Website |
Best for automated insight discovery | 4.2 out of 5 | 4 | 4 | 4 | 5 | 4 | 4 | Pricing upon request 30-day free trial + free demo available | Website |


En İyi İş Zekâsı Platformları İncelemeleri
Aşağıda, kısa listeme giren en iyi iş zekâsı platformlarına ilişkin ayrıntılı özetlerimi bulabilirsiniz. İncelemelerim, size en uygun platformu bulmanıza yardımcı olmak için her platformun özelliklerini, yeteneklerini ve entegrasyonlarını ayrıntılı olarak ele alır.
 Best for advanced visual analytics tools
- 14-day free trial
- Pricing upon request
Visit WebsiteCustomer Rating:4.5/5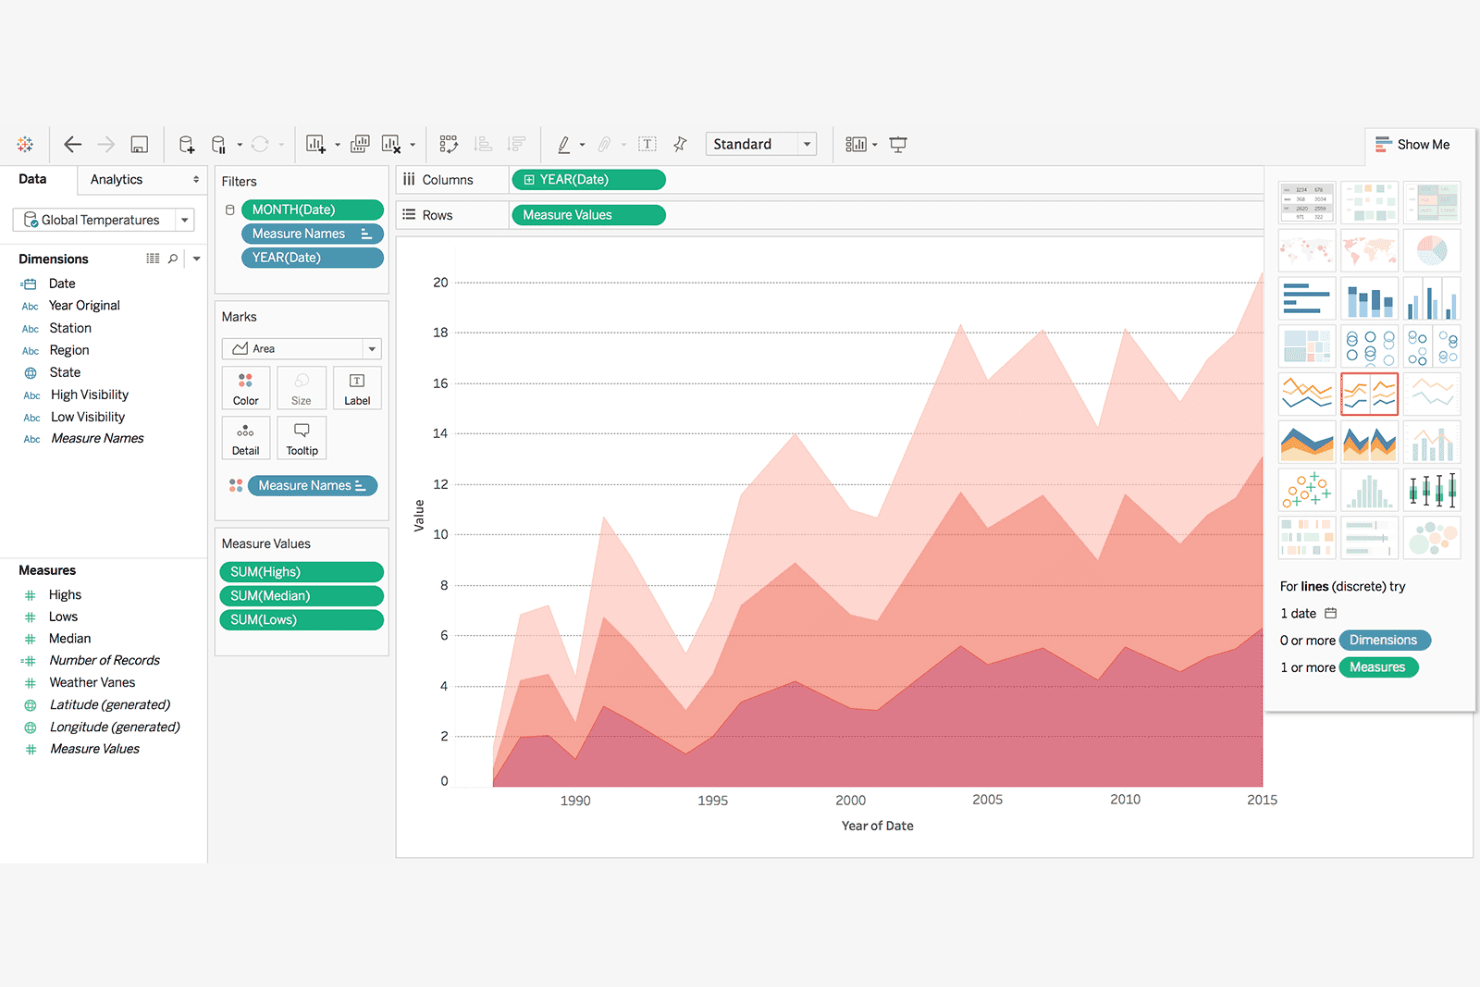
Tableau lets users build layered area charts to visualize temperature trends over time. Tableau is a business intelligence platform built around its VizQL engine, offering interactive dashboards, a deep visualization library, AI-powered metric monitoring via Tableau Pulse, and connectivity to 100+ data sources including all major cloud warehouses.
Who Is Tableau Best For?
Tableau is a strong fit for data and analytics teams that need to build, explore, and share complex visualizations across large, multi-source datasets.
Why I Picked Tableau
Tableau earns its spot on my shortlist because its VizQL engine produces a depth and flexibility of visualization that I haven't seen matched elsewhere. I especially like Tableau Pulse, which surfaces proactive, AI-driven metric insights directly in Slack or Teams—so product teams catch anomalies in release performance without manually refreshing dashboards. Pair that with 20-plus native chart types and 30-plus Exchange visualization extensions, and you have a platform built for genuinely complex, multi-source visual analytics.
Tableau Key Features
- VizQL drag-and-drop canvas: Build fully interactive views by placing fields onto rows and columns without writing a single line of SQL.
- Tableau Prep Builder: A visual, flow-based ETL tool included in Creator licenses for cleaning, reshaping, and aggregating data before publishing.
- Row-level security: Restrict data access at the row level using user filters, data source filters, or entitlements tables to control what each viewer sees.
- Embedding API v3: Publish interactive, secured dashboards directly inside custom web apps or customer-facing products with full interactivity intact.
Tableau Integrations
Tableau offers 100+ native data connectors, including Salesforce, Google BigQuery, Snowflake, Amazon Redshift, Microsoft SQL Server, and PostgreSQL. It also supports Tableau Exchange marketplace connectors, ODBC/JDBC, Tableau Bridge, and Embedding API v3.
Pros and Cons
Pros:
- Embedding dashboards in web apps supported
- Deep AI-driven metric insights available
- Best-in-class interactive data visualizations
Cons:
- No built-in Amplitude or Mixpanel connector
- Advanced analytics require significant training investment
Learn more about Tableau: 2Best for scalable cloud data management
Domo
- 30-day free trial
- Pricing upon request
Visit WebsiteCustomer Rating:4.4/5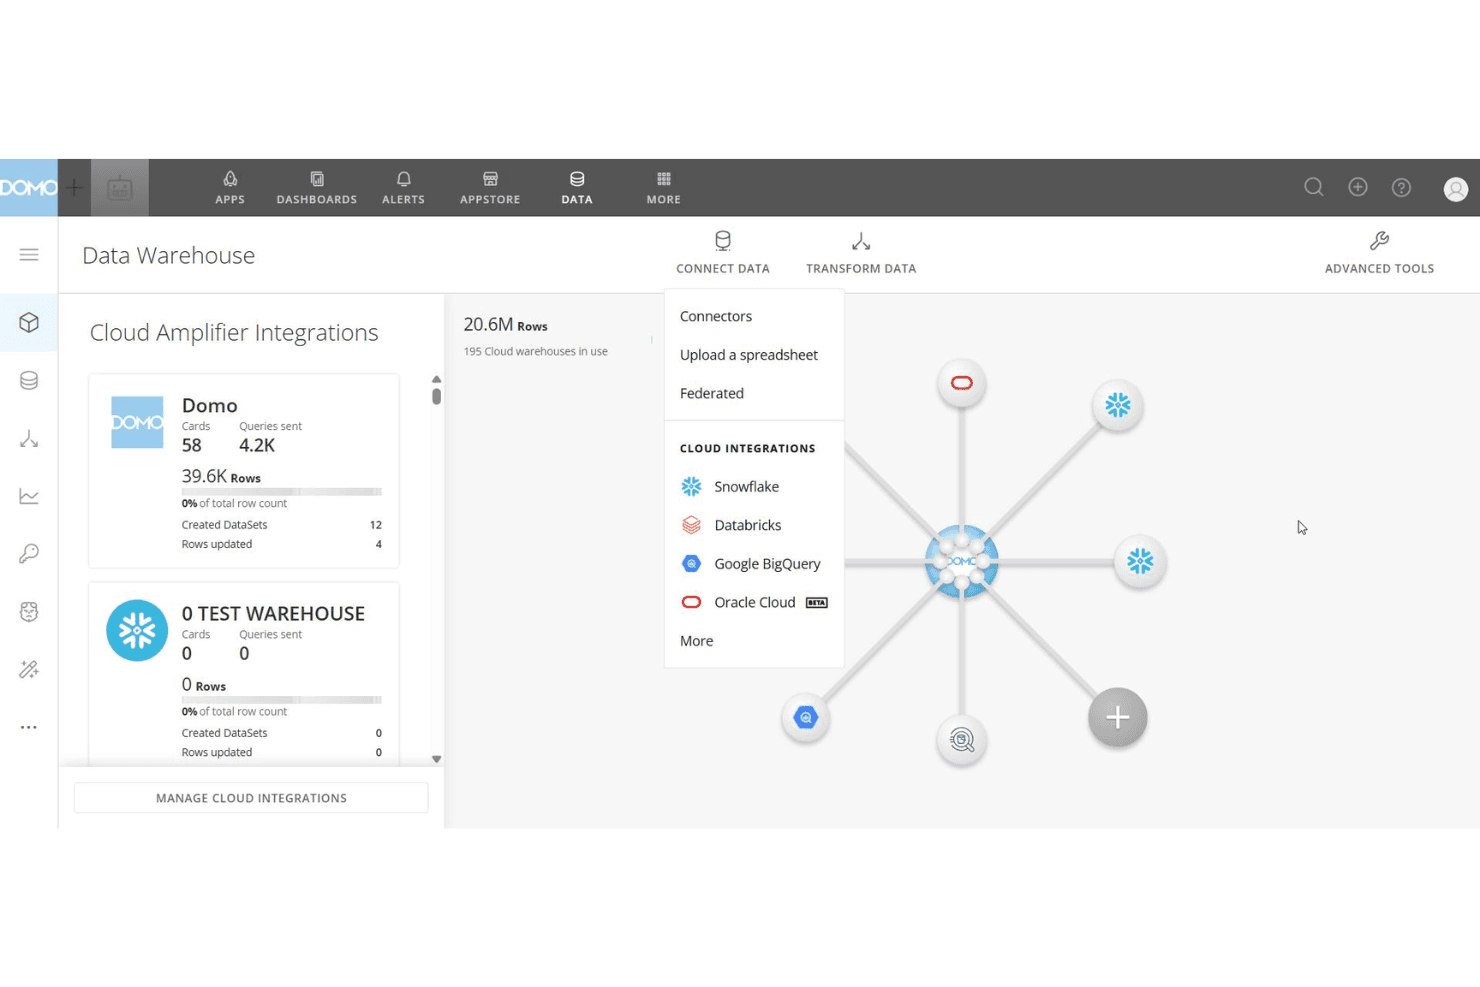
Domo connects to cloud warehouses like Snowflake and BigQuery from one hub. Domo is a cloud-native BI platform that combines data integration across 1,000+ connectors, drag-and-drop dashboard authoring, no-code ETL, and AI-powered querying into a single, unified environment.
Who Is Domo Best For?
Domo is a strong fit for large or scaling organizations that need to give hundreds of users access to data without paying per seat.
Why I Picked Domo
Domo earns its spot on my shortlist because it's built from the ground up for organizations that need to scale data access without scaling their licensing costs. I love that its credit-based model includes unlimited internal users, so when a product team grows from 10 to 100 people, nobody gets locked out of the dashboards. The 1,000+ native connectors plus federated querying against Snowflake and BigQuery mean I can pull live warehouse data without duplicating it, which keeps pipelines clean at scale.
Domo Key Features
- Beast Mode calculated fields: Build custom metrics and KPIs directly within visualizations without modifying the underlying dataset.
- Domo Everywhere embedded analytics: Embed live dashboards into external products, portals, or websites using iFrame or JavaScript SDK with role-based access control.
- Triggered Reports: Automatically distribute dashboard reports to stakeholders the moment a defined alert condition is met.
- Jupyter Workspaces integration: Run Python or R scripts for advanced data preparation and machine learning model development inside Domo's environment.
Domo Integrations
Domo offers 1,000+ native integrations, including Salesforce, Google Analytics, SAP, Snowflake, BigQuery, Databricks, Amazon Redshift, Box, and Dropbox. Its Connector IDE supports custom APIs, while Domo Workbench connects on-premises data.
Pros and Cons
Pros:
- Embedded analytics with granular access control
- 1,000+ connectors for rapid data integration
- Unlimited internal users in all plans
Cons:
- Semantic layer is still maturing compared to peers
- High upfront commitment required for purchase
Learn more about Domo: Best for integrated strategy tracking
- Free demo available
- Pricing upon request
Visit WebsiteCustomer Rating:4.2/5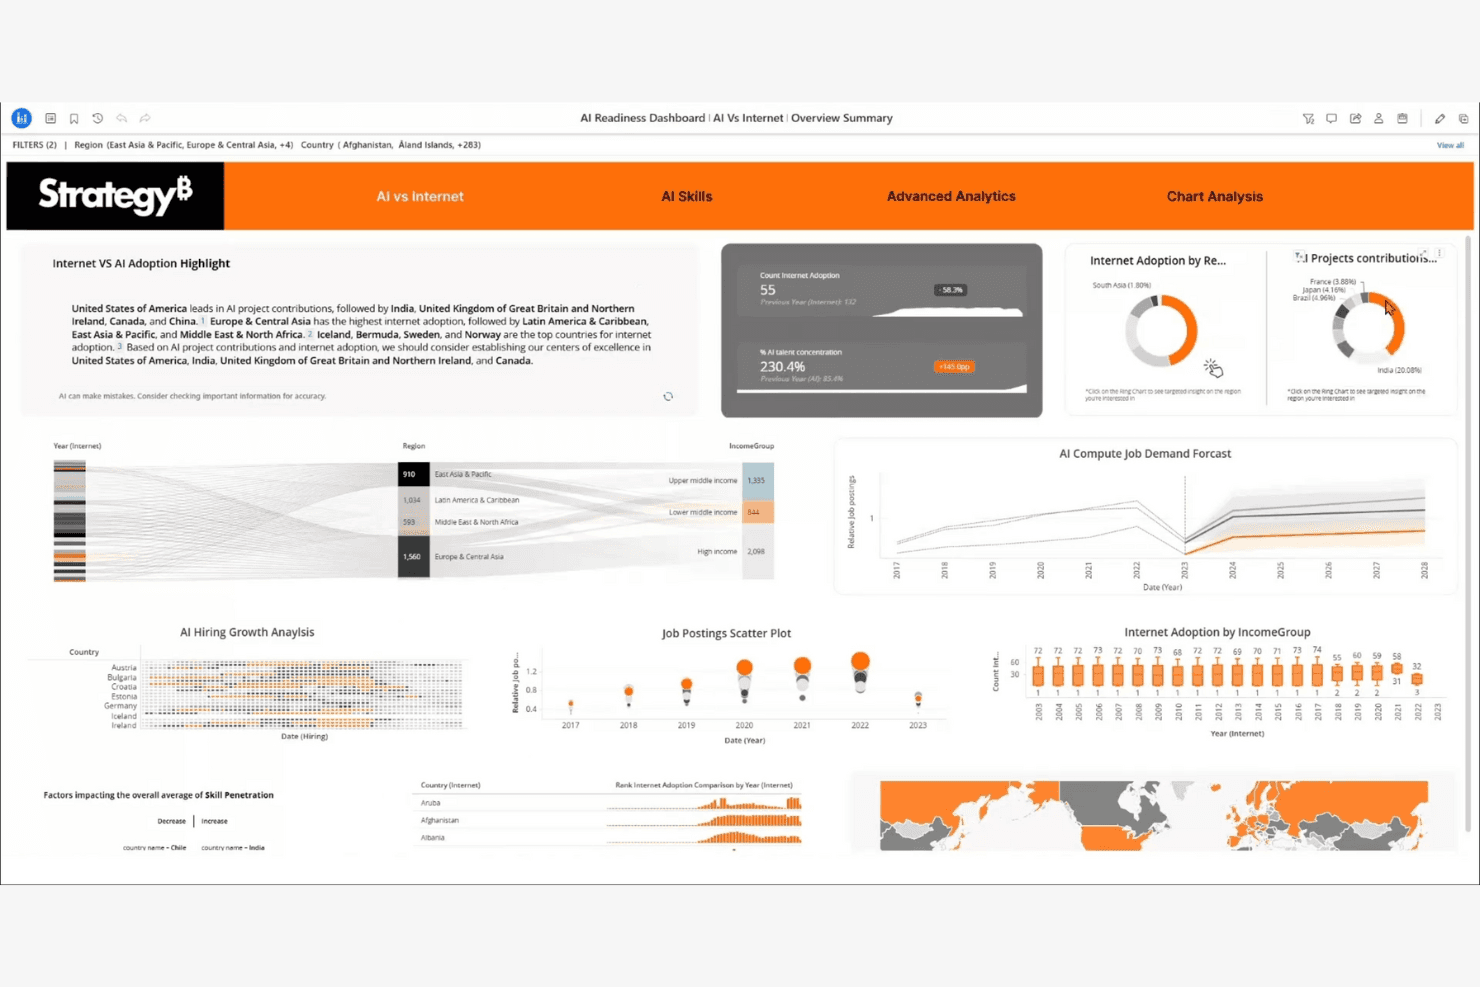
StrategyB visualizes AI readiness metrics across regions and skills. Strategy is an enterprise BI platform built on a universal semantic layer that connects 200+ data sources and delivers governed metrics, AI-powered dashboards, and embedded analytics.
Who Is Strategy Best For?
Strategy is a strong fit for enterprise data and analytics teams that need governed, AI-ready metrics across large, complex organizations.
Why I Picked Strategy
Strategy earns its spot on my shortlist because its Mosaic Universal Semantic Layer is the most mature governed metrics foundation I've seen in enterprise BI, with 35 years of production use at organizations like Pfizer across 27 markets. I'm particularly impressed by how Mosaic lets teams define a metric once and apply it consistently across dashboards, AI agents, and embedded apps, eliminating conflicting numbers across departments. The GitHub-native version control for Mosaic models is a genuine differentiator for teams treating analytics infrastructure with the same rigor as code.
Strategy Key Features
- Auto Answers: A natural language Q&A interface that lets users ask questions in plain language and get instant answers from governed data.
- HyperIntelligence: Surfaces zero-click contextual insights directly in browsers and productivity tools via hover-enabled cards, without leaving your current app.
- Embedding SDK: A no-code, low-code, and pro-code SDK for integrating governed dashboards and visualizations into external web applications.
- Threshold-based alerting: Triggers automated report delivery when specific metric conditions are met, keeping teams informed without manual monitoring.
Strategy Integrations
Strategy offers 200+ native data source connectors, including Snowflake, Google BigQuery, Amazon Redshift, Databricks, Jira Cloud, Google Drive, and Power BI. It also supports custom integrations through its API and mstrio-py package, with Mosaic providing governed connectivity across analytics tools.
Pros and Cons
Pros:
- Embedding SDK enables polished custom analytics apps
- AI-native features for flexible ad hoc analysis
- Enterprise-grade semantic layer ensures consistent metrics
Cons:
- Complex licensing and admin structure for teams
- No built-in cohort or funnel visuals
Learn more about Strategy: Best for scalable multi-tenant analytics
- 30-day free trial + free demo available
- Pricing upon request
Visit WebsiteCustomer Rating:4/5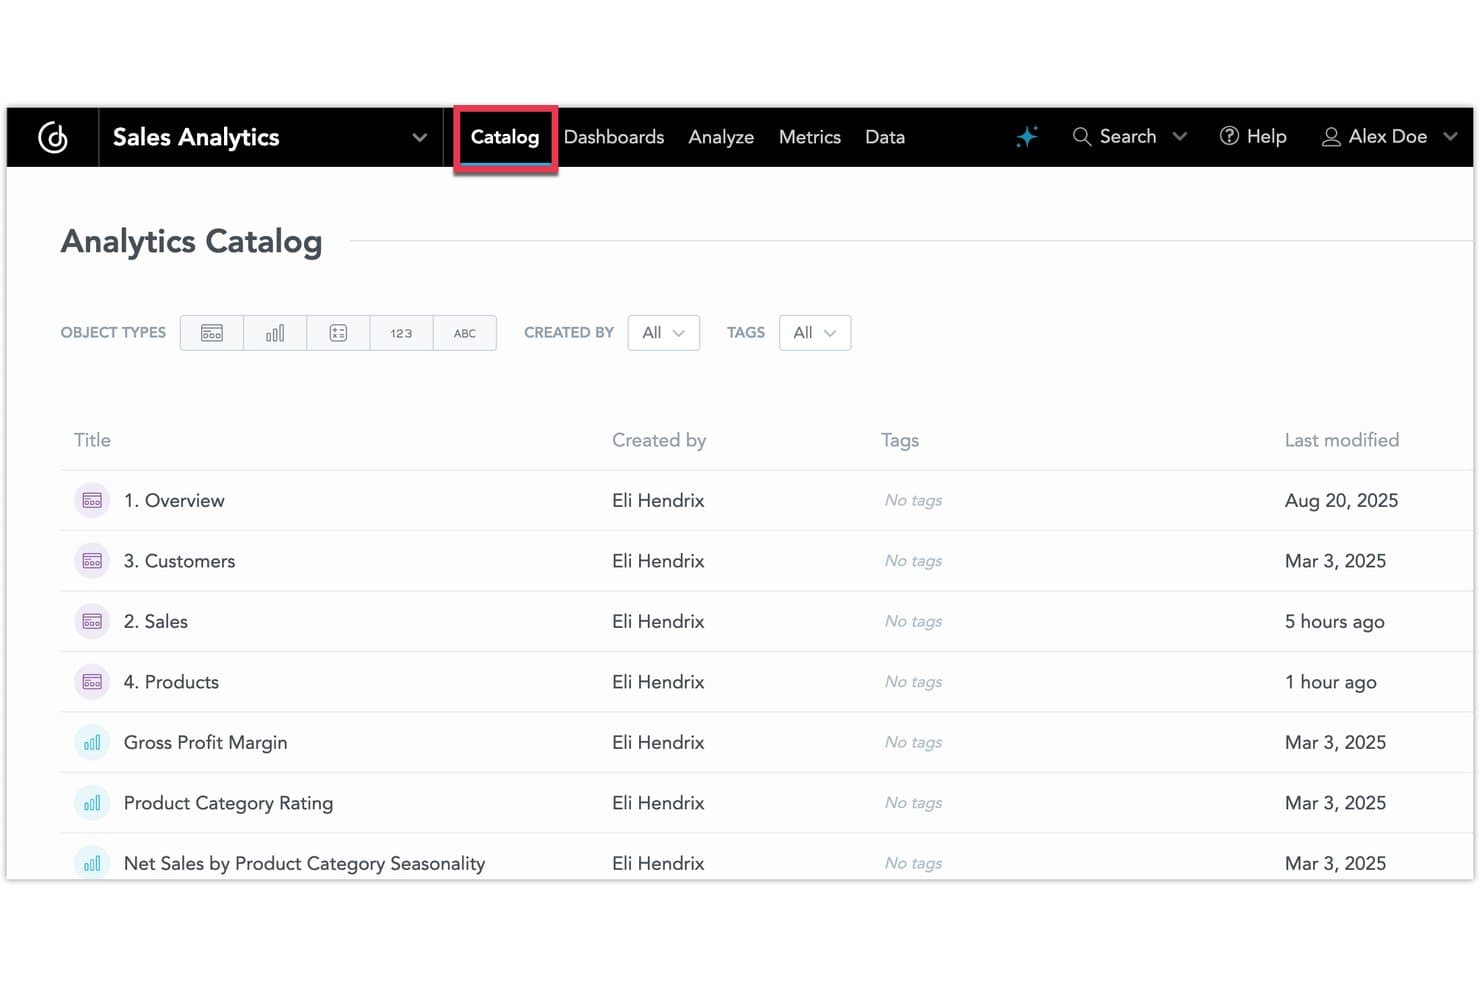
GoodData organizes analytics assets in a browsable catalog view. GoodData is a BI platform built around a centralized semantic layer, offering embedded analytics, multi-tenant workspace management, AI-assisted querying, and analytics-as-code capabilities for teams that need governed, scalable reporting across complex data environments.
Who Is GoodData Best For?
GoodData is a strong fit for SaaS companies and product ops teams that need to deliver governed analytics across many tenants or embed reporting directly into customer-facing products.
Why I Picked GoodData
GoodData earns its spot on my shortlist because of how well its hierarchical workspace architecture handles multi-tenant scale. I love that you can provision thousands of isolated tenant workspaces, cascade metric changes across all of them simultaneously, and enforce permissions without duplicating work per client. Paired with a centralized semantic layer that governs every metric across dashboards, embedded apps, and AI queries, it's purpose-built for SaaS teams delivering analytics at scale.
GoodData Key Features
- AI Assistant: Query your data using plain language, with answers grounded in the semantic layer to prevent inaccurate or inconsistent results.
- Analytics as Code: Define dashboards, metrics, and configurations in JSON/YAML and manage them through Git with full version control and CI/CD support.
- FlexConnect: Build custom connectors to virtually any data source—including REST APIs, streaming data, and NoSQL databases—without vendor assistance.
- Anomaly detection: Automatically surface unexpected shifts and outliers in your metrics, with alerts delivered via email, webhook, or in-app notifications.
GoodData Integrations
GoodData offers 20+ native data-source connectors, including Snowflake, Google BigQuery, Amazon Redshift, Databricks, PostgreSQL, MySQL, Oracle Database, and Microsoft SQL Server. Its REST, Python, and React APIs, plus FlexConnect, support custom integrations with APIs, Kafka, NoSQL, and other sources.
Pros and Cons
Pros:
- Analytics-as-code supports Git and CI/CD
- Advanced semantic layer ensures metric consistency
- Handles thousands of tenant workspaces well
Cons:
- AI Assistant limited to enterprise plans
- No built-in product analytics features
Learn more about GoodData: Best for governed enterprise report distribution
- 30-day free trial available
- From $11.25/user/month
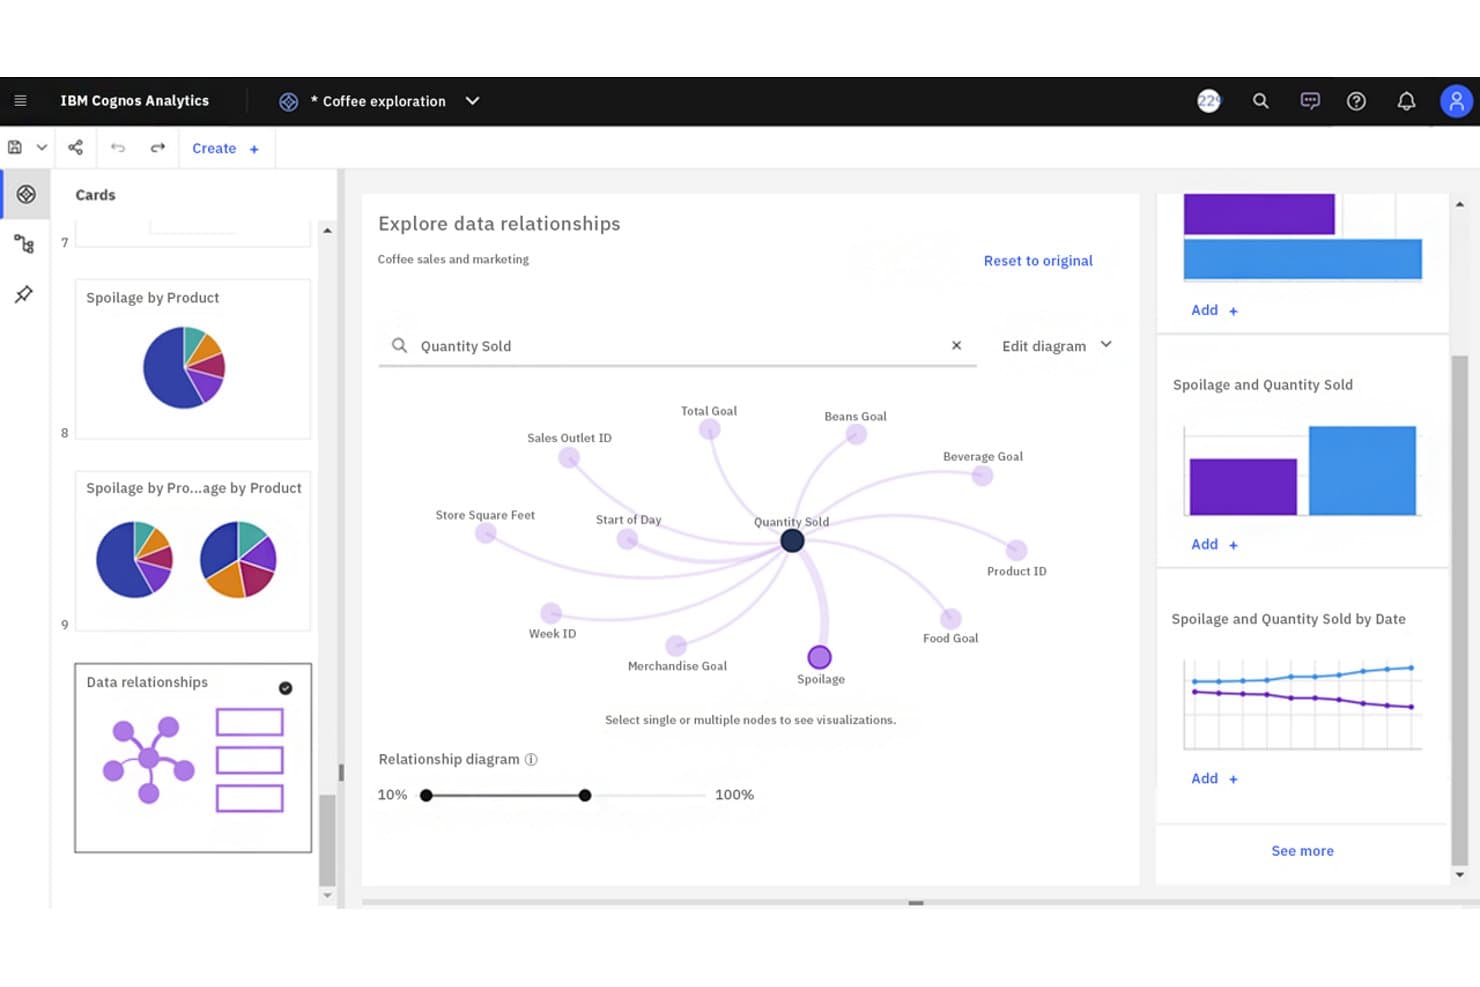
IBM Cognos Analytics lets users visually explore data relationships interactively. IBM Cognos Analytics is an enterprise business intelligence platform that combines AI-assisted reporting, self-service dashboards, and governed data distribution across large organizations.
Who Is IBM Cognos Analytics Best For?
IBM Cognos Analytics is a strong fit for large enterprises with dedicated IT and BI teams that need strict governance over how reports are created, managed, and distributed at scale.
Why I Picked IBM Cognos Analytics
IBM Cognos Analytics earns its spot on my shortlist because of how well it handles governed report distribution at enterprise scale. I've worked with its burst reporting feature, which lets you automatically distribute personalized report snapshots to hundreds of recipients without manual intervention. Its folder-level permission controls and audit trails give IT teams the oversight they need when data access is tightly regulated.
IBM Cognos Analytics Key Features
- AI-assisted data exploration: An integrated AI assistant lets you query your data using natural language and surfaces automated insights and anomaly alerts.
- Dynamic dashboard builder: Drag-and-drop canvas lets you assemble interactive dashboards that update in real time as underlying data sources refresh.
- Multi-source data connectors: Native connectors link directly to relational databases, cloud data warehouses, and spreadsheets without requiring custom middleware.
- Mobile analytics app: A dedicated mobile app delivers interactive reports and dashboards to iOS and Android devices with offline viewing support.
IBM Cognos Analytics Integrations
IBM Cognos Analytics offers native data connectors for relational databases, cloud data warehouses, and spreadsheets. Specific vendor integrations and a total integration count aren't documented.
Pros and Cons
Pros:
- Structured reporting centralizes consistent enterprise metrics
- Folder permissions and audit trails support governance
- Scheduled report bursting personalizes delivery at scale
Cons:
- Large datasets can slow complex reports
- Complex authoring slows advanced report changes
Learn more about IBM Cognos Analytics: Best for governed semantic modeling at scale
- 30-day free trial available
- From $162.30/month for up to 10 users
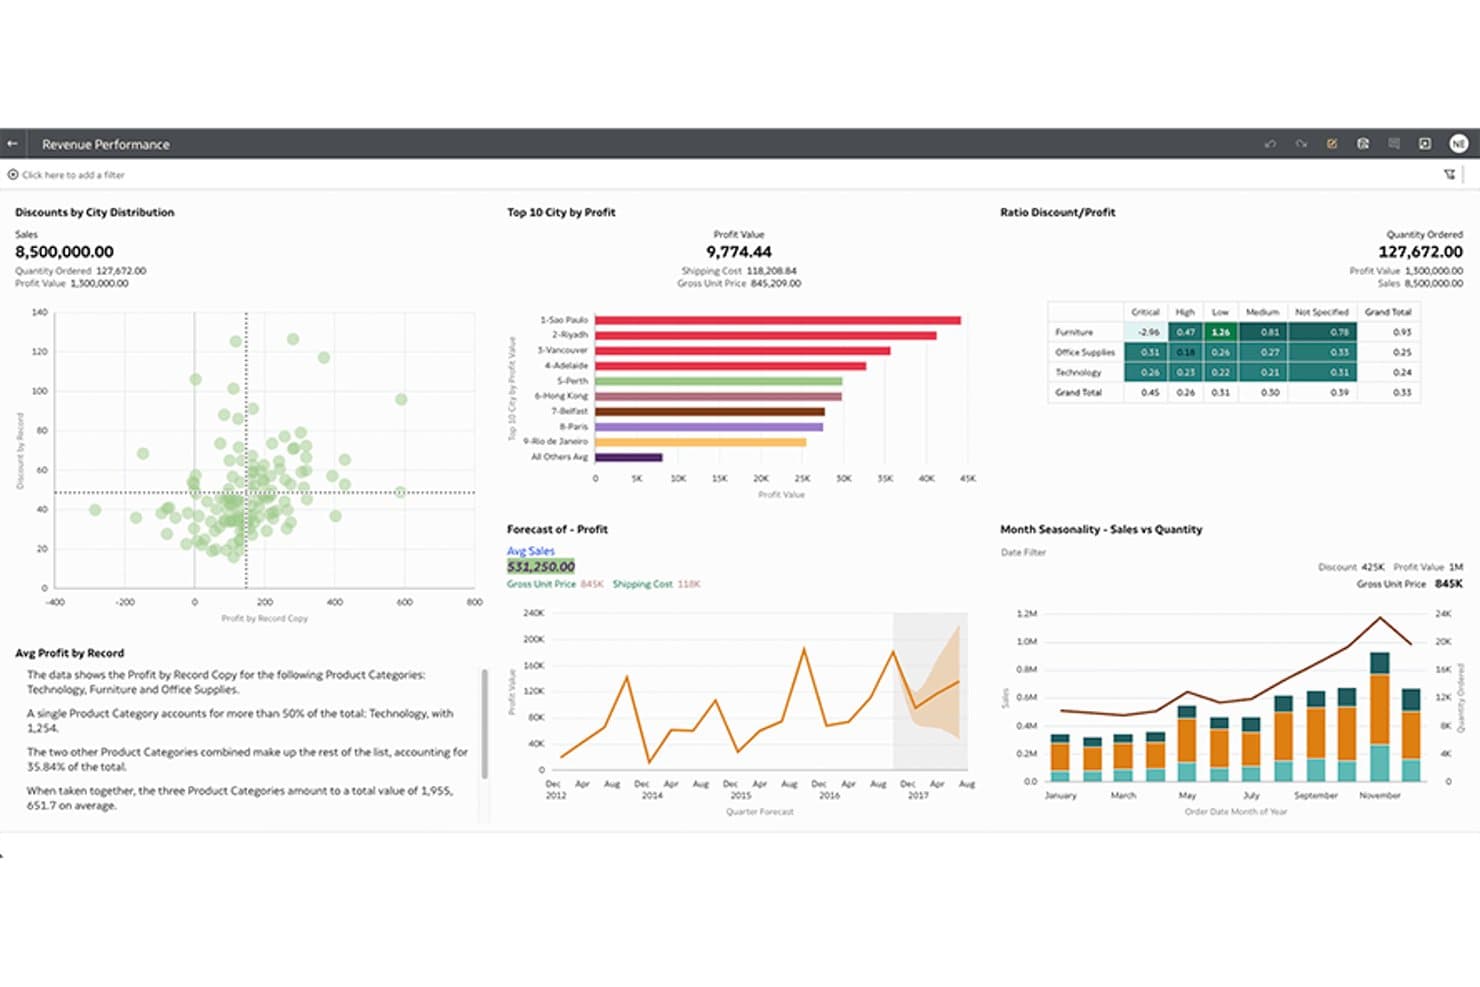
Oracle Analytics Cloud unifies revenue metrics across interactive visual dashboards. Oracle Analytics Cloud is a business intelligence platform that combines semantic modeling, self-service analytics, data visualization, and AI-powered insights in a governed, enterprise-grade environment.
Who Is Oracle Analytics Cloud Best For?
Oracle Analytics Cloud is a strong fit for large enterprises that already run Oracle infrastructure and need centralized governance over their data models.
Why I Picked Oracle Analytics Cloud
Oracle Analytics Cloud earns its spot on my shortlist because of how it handles semantic modeling at enterprise scale. I'm particularly impressed by its reusable semantic model layer, where business definitions like "revenue" or "churn" are defined once and applied consistently across every report and dashboard. The AI-powered augmented analytics features, including automated insights and natural language querying, sit on top of that governed foundation, so your teams get self-service flexibility without breaking data consistency.
Oracle Analytics Cloud Key Features
- Self-service data visualization: Drag-and-drop canvas lets users build charts, dashboards, and reports without writing queries.
- Machine learning integration: Built-in ML models let you train, deploy, and score predictions directly within the platform.
- Mobile analytics app: A native mobile app delivers interactive dashboards and reports on iOS and Android devices.
- Data preparation and enrichment: Built-in data flow tools let users cleanse, blend, and transform data from multiple sources before analysis.
Oracle Analytics Cloud Integrations
Native integrations are not clearly documented for Oracle Analytics Cloud.
Pros and Cons
Pros:
- Built-in data flows prepare blended datasets
- Automated insights surface patterns across dashboards
- Reusable semantic models enforce consistent KPI definitions
Cons:
- Dashboard authoring feels less intuitive than rivals
- Administration can demand Oracle platform expertise
Learn more about Oracle Analytics Cloud : Best for open-source analytical flexibility
- 14-day free trial + free plan available
- From $100/month
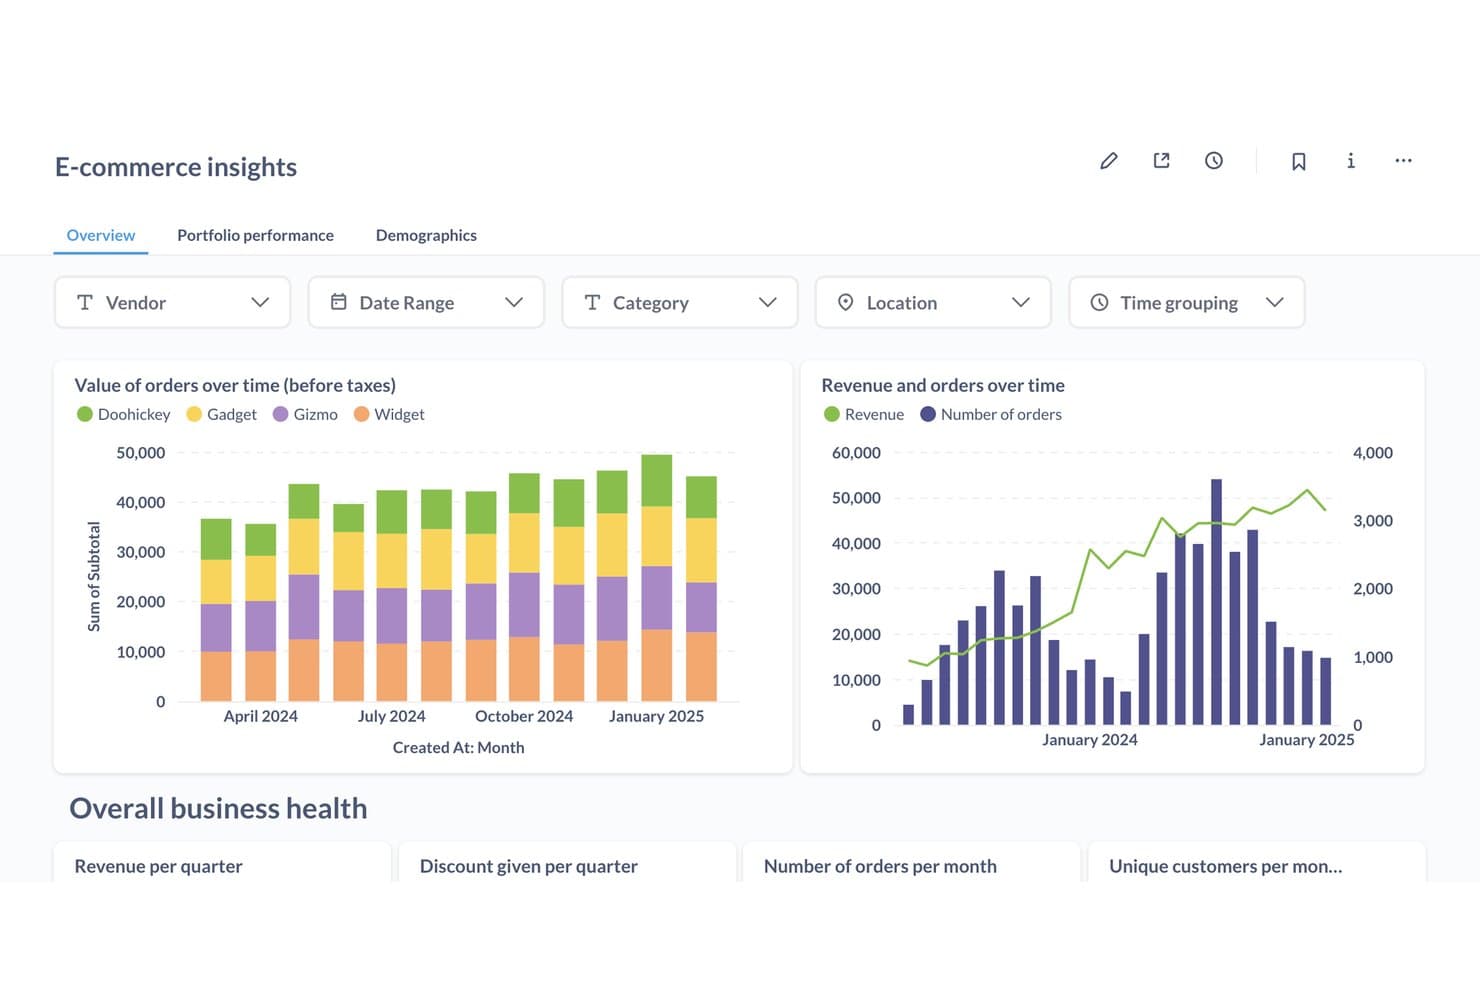
Metabase tracks e-commerce orders and revenue trends in one dashboard. Metabase is an open-source BI platform that lets you connect to databases and warehouses, build interactive dashboards, run ad hoc queries through a visual builder or SQL editor, and explore data with AI-powered natural language querying.
Who Is Metabase Best For?
Metabase is a strong fit for cross-functional product teams that need self-serve dashboards and want the flexibility to self-host or scale on an open-source foundation.
Why I Picked Metabase
I've included Metabase in my top picks because it's one of the few BI platforms where the open-source edition isn't a stripped-down teaser—you get unlimited users, 20+ data connectors, a visual query builder, and AI-powered natural language querying (Metabot) at no cost. I especially like Data Studio, its semantic layer workbench, which lets teams define canonical metrics and business glossary terms so every dashboard pulls from the same source of truth. The Git-based Remote Sync also means you can version-control dashboards and models like code, which I rarely see outside enterprise-tier tools.
Metabase Key Features
- Visual notebook query builder: A no-code interface that lets you build queries, joins, and aggregations by clicking—no SQL required.
- Events and timelines: Annotate dashboards with business events like product launches or releases to add context directly to your charts.
- Threshold-based alerts: Set conditions on any question so Metabase delivers a notification via email, Slack, or webhook when your data hits a defined value.
- Embedded analytics SDK: A React-based SDK that lets you embed white-labeled, interactive dashboards directly into your product for end-user analytics.
Metabase Integrations
Metabase offers 18 official database and warehouse connectors, including BigQuery, Snowflake, PostgreSQL, MySQL, and Microsoft SQL Server. It lacks native SaaS connectors, but supports 11+ community connectors for self-hosted deployments and API-based custom integrations.
Pros and Cons
Pros:
- Git-based analytics version control support
- Visual query builder for non-technical users
- Self-hosting with open-source code available
Cons:
- Cohort and funnel analysis require SQL skills
- No native connectors for SaaS products
Learn more about Metabase: Best for natural language search analytics
- 14-day free trial + free demo available
- From $25/user/month (billed annually)
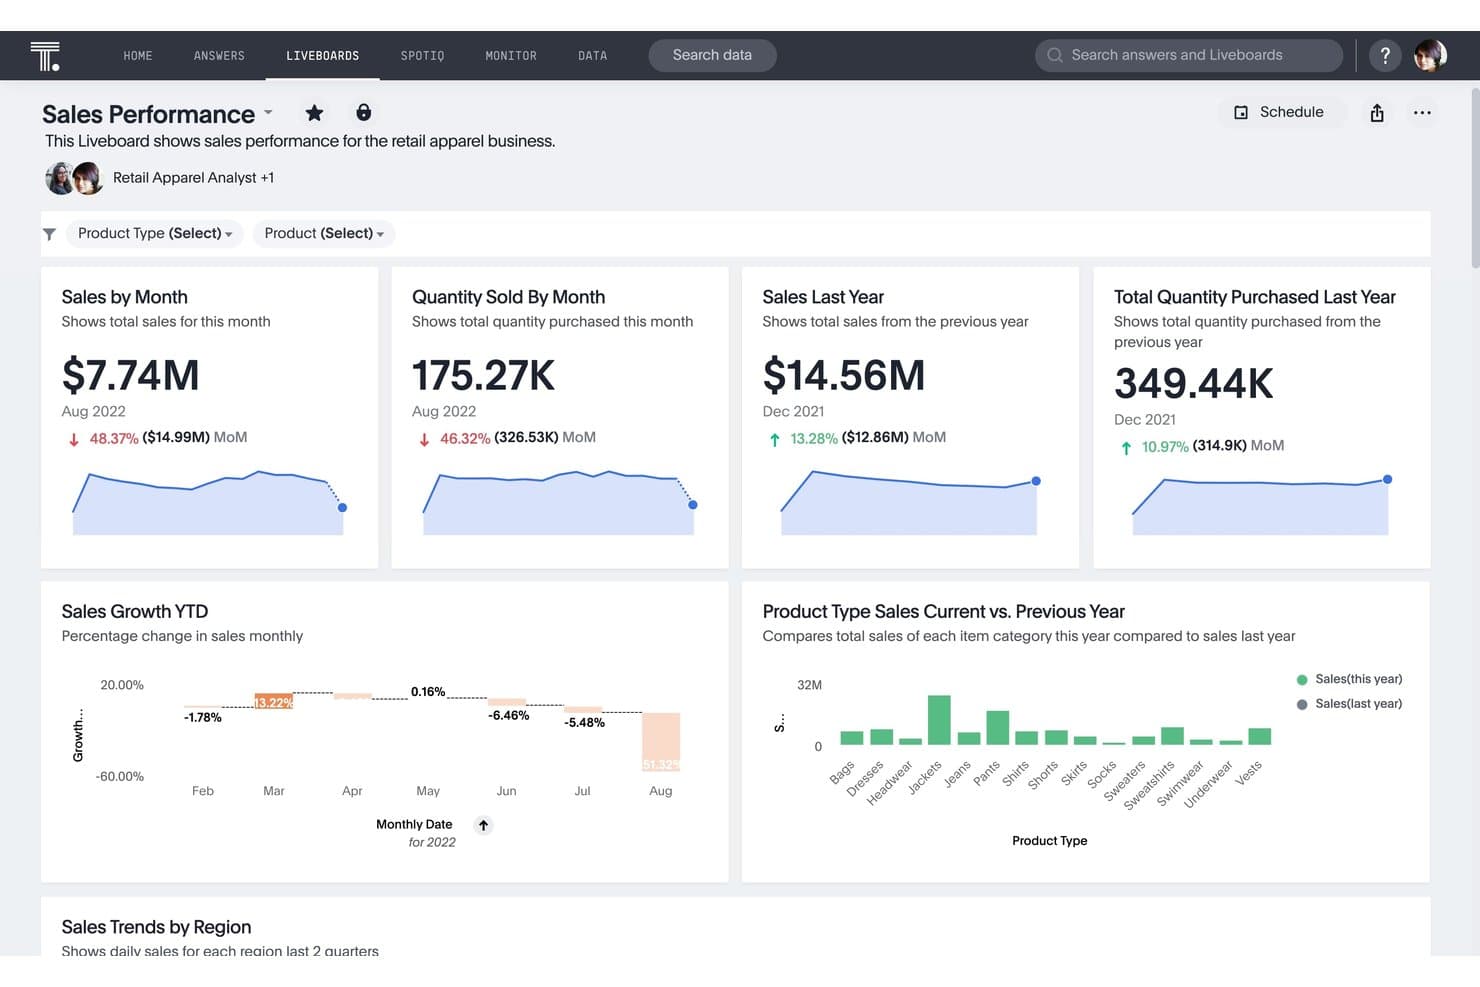
ThoughtSpot tracks sales KPIs and trends in a retail dashboard. ThoughtSpot is a BI platform built around natural language search, AI-powered analytics, and live-query warehouse connectivity, offering interactive Liveboards, automated anomaly detection, and embedded analytics capabilities.
Who Is ThoughtSpot Best For?
ThoughtSpot is a strong fit for data teams and non-technical business users who need to query complex warehouse data without writing SQL.
Why I Picked ThoughtSpot
ThoughtSpot earns its spot on my shortlist because its Relational Search lets anyone on the team type a plain-English question like "which features drove the most engagement last quarter" and get a live, governed answer instantly, no SQL required. I also love SpotIQ, which automatically surfaces anomalies and trend shifts in your Liveboards without you having to know what to look for. Together, these two capabilities make self-serve analysis genuinely accessible across product, ops, and leadership teams.
ThoughtSpot Key Features
- Liveboards: Real-time interactive dashboards with drill-anywhere functionality, cross-filtering, and AI highlights built directly into each view.
- Analyst Studio: A code-first workspace where data teams can write SQL, Python, or R for advanced ad hoc analysis and custom data prep.
- ThoughtSpot Modeling Language (TML): A scriptable format for managing data models, dashboards, and metrics as code, with native GitHub version control.
- Monitor: A multi-channel alerting feature that delivers threshold, scheduled, and attribute-based alerts via email, Slack, Teams, and mobile push.
ThoughtSpot Integrations
ThoughtSpot offers 25+ native data connectors, including Snowflake, Google BigQuery, Amazon Redshift, Databricks, PostgreSQL, MySQL, and Salesforce. Spotter Connectors add Amplitude, Mixpanel, and Heap, while JavaScript SDK and REST APIs support custom embedded analytics integrations.
Pros and Cons
Pros:
- Git-based version control for analytics assets
- Automated anomaly detection surfaces trend shifts
- Natural language search for querying warehouse data
Cons:
- Limited custom or branded visualization options
- No cross-connection joins between databases
Learn more about ThoughtSpot: Best for spreadsheet-style data exploration
- 7-day free trial + free demo available
- From $300/month
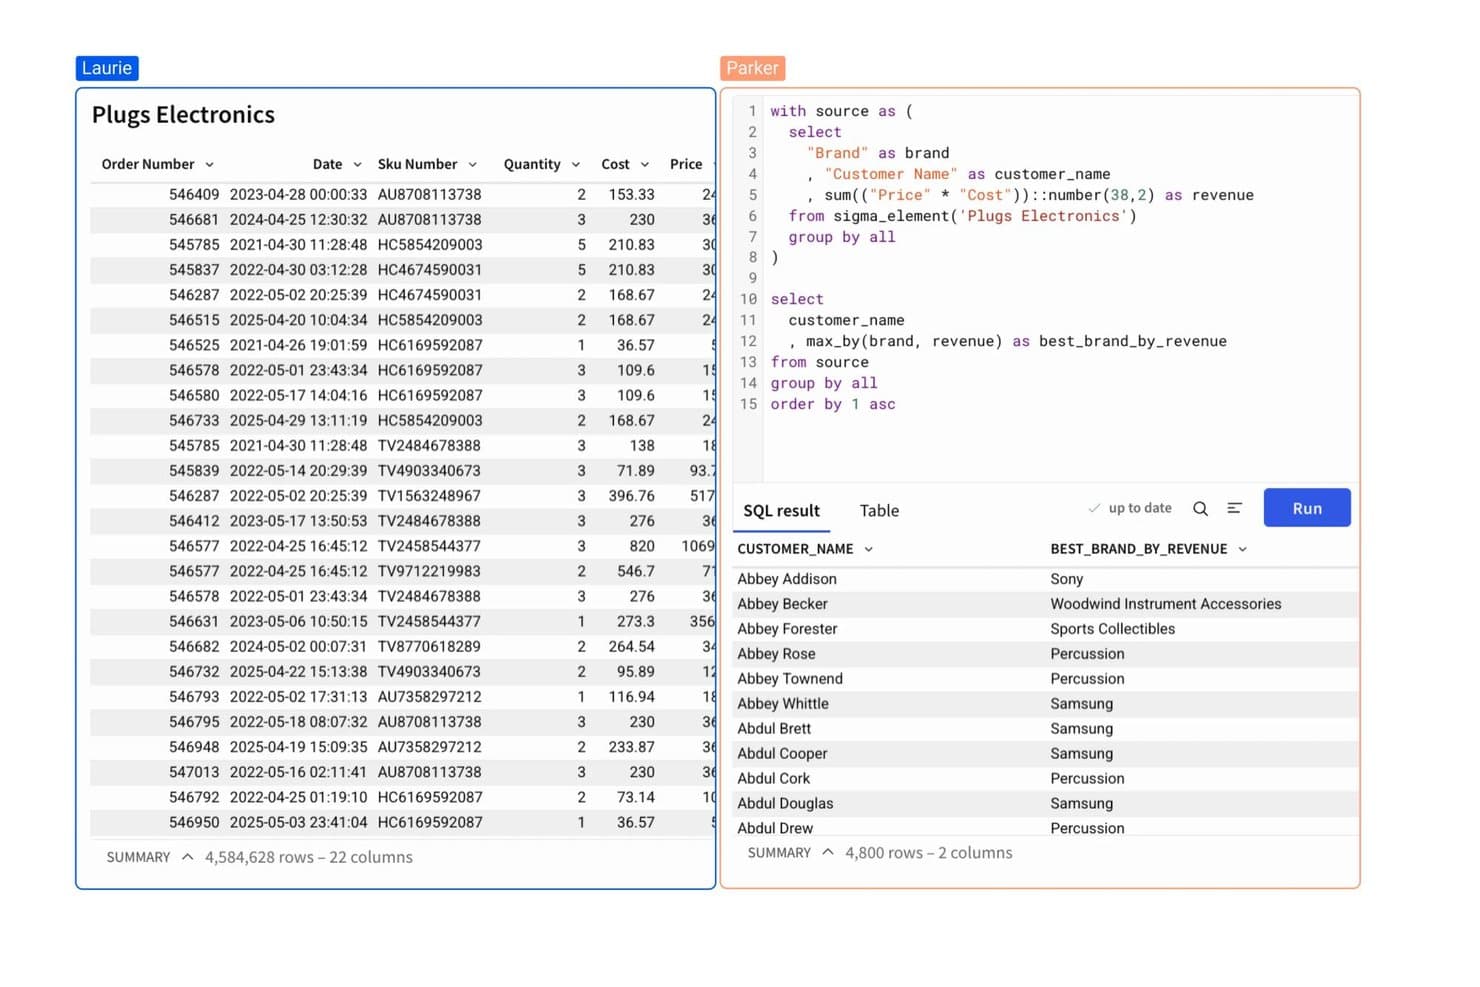
Sigma Computing lets users write SQL to find each customer's top revenue brand. Sigma Computing is a BI platform that combines a spreadsheet-style workbook interface with live cloud warehouse querying, ad hoc exploration, semantic data modeling, AI-powered analysis, and embedded analytics capabilities.
Who Is Sigma Computing Best For?
Sigma Computing is a strong fit for product and operations teams who live in spreadsheets and want to explore warehouse data without relying on a data analyst for every question.
Why I Picked Sigma Computing
Sigma Computing earns its spot on my shortlist because its spreadsheet-style workbook lets product managers explore billions of rows of live warehouse data without writing a single line of SQL. I'm particularly impressed by the Input Tables feature, which supports real-time write-back directly from the UI, making what-if analysis and budget modeling possible without leaving the platform. The Sigma Assistant adds natural language querying on top, converting plain-English questions into fully explorable, live workbooks.
Sigma Computing Key Features
- Semantic layer with Git-based version control: Analytics engineers can define governed metrics, joins, and relationships in YAML and manage changes through branching and CI/CD workflows.
- Multi-channel scheduled exports: Send workbooks, pages, or individual elements to email, Slack, Microsoft Teams, Google Sheets, or cloud storage on a recurring or condition-triggered schedule.
- Sigma Agents: Autonomous agents monitor data thresholds and trigger cross-platform actions in tools like Salesforce and Slack, with a full immutable audit trail.
- Embedded analytics with JWT authentication: Embed white-labeled workbooks into external applications using a React SDK or iFrame, with per-tenant data isolation via RBAC and row-level security.
Sigma Computing Integrations
Sigma has around 10 native data-source connectors, including Snowflake, Google BigQuery, Amazon Redshift, Databricks, PostgreSQL, MySQL, Azure SQL, and AlloyDB. It integrates with dbt Semantic Layer and offers REST API access for custom connections.
Pros and Cons
Pros:
- AI-powered chart explanations and natural language queries
- Native write-back directly from dashboard interface
- Spreadsheet-style analysis on warehouse-scale data
Cons:
- Limited native cohort or retention visualizations
- No direct connection to product analytics tools
Learn more about Sigma Computing: Best for automated insight discovery
- 30-day free trial + free demo available
- Pricing upon request
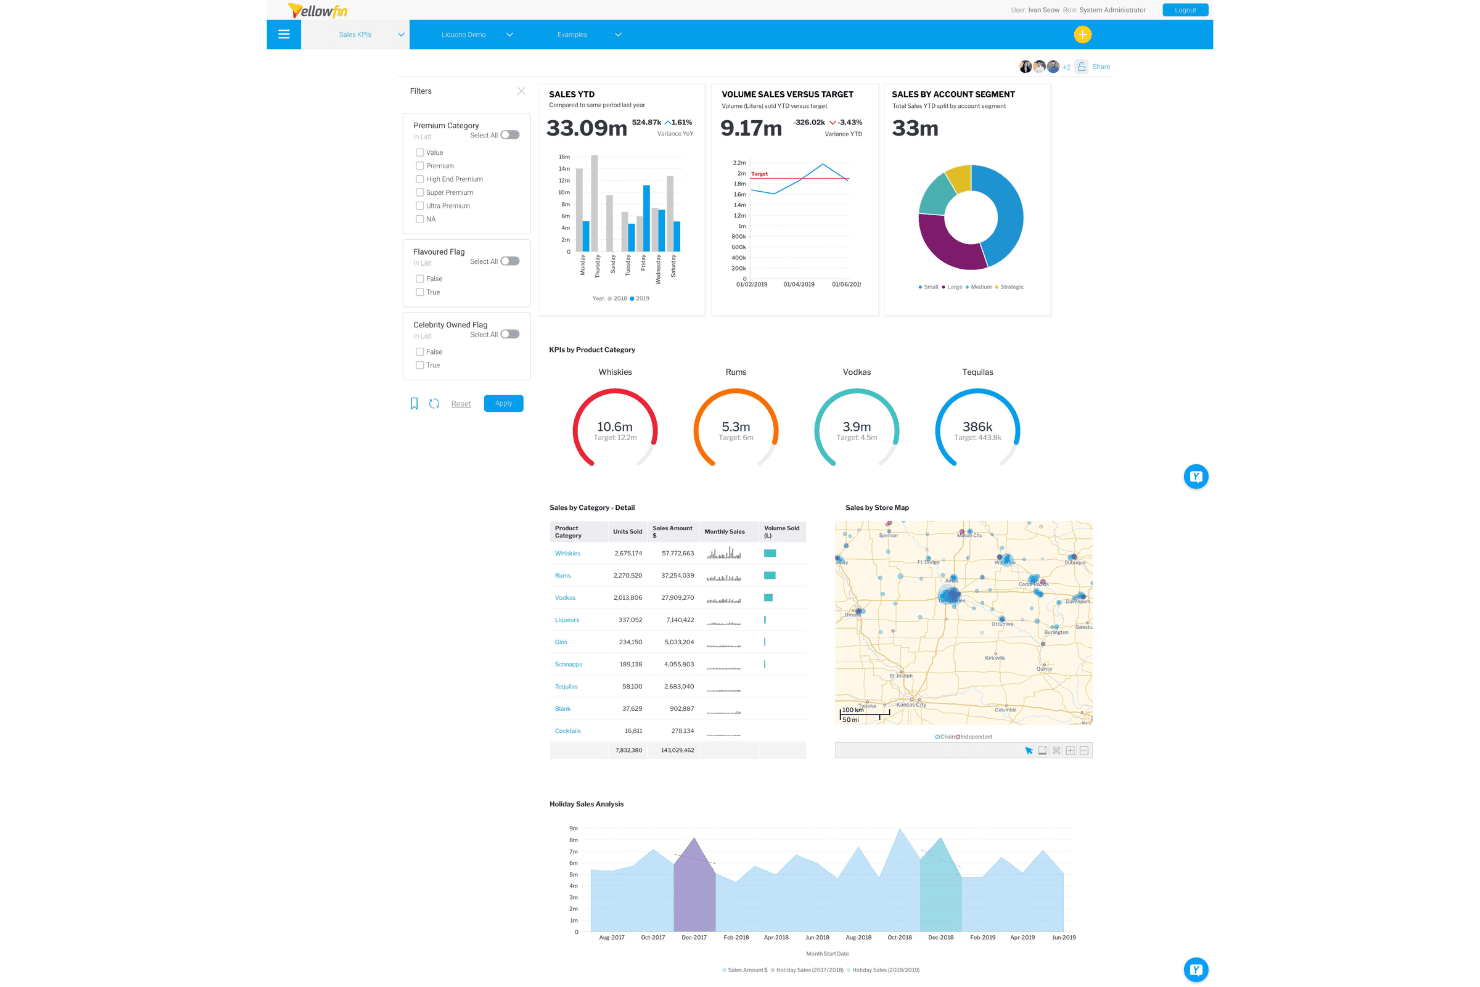
Yellowfin consolidates sales KPIs, charts, and maps into one dashboard. Yellowfin is a BI platform that combines interactive dashboards, 50+ chart types, natural language querying, AI-driven anomaly detection, and embedded analytics into a single suite.
Who Is Yellowfin Best For?
Yellowfin is a strong fit for enterprise teams that need proactive, AI-driven monitoring across consolidated warehouse data—without relying on manual queries to surface what's changing.
Why I Picked Yellowfin
I picked Yellowfin as one of the best because no other tool on this list monitors your data the way Signals does: it continuously scans for anomalies, trend shifts, and outliers you didn't think to look for, then delivers a plain-language explanation of what changed and why. I also like that Signals integrates directly into dashboards, so if a key metric spikes after a release, your team sees the alert in context rather than buried in a separate inbox.
Yellowfin Key Features
- Natural language querying: Ask Yellowfin lets you type plain-language questions and returns best-practice charts automatically, no SQL required.
- Free-form canvas dashboards: A drag-and-drop builder with cross-filtering, drill-through, and action buttons lets you build and share interactive dashboards without coding.
- Data storytelling with Stories and Present: Combine charts, tables, and written context into slide-style narratives designed for sharing insights with non-technical stakeholders.
- Embedded analytics SDK: White-label dashboards, NLQ, and Signals can be embedded into external products via JavaScript API or SDK in under two weeks.
Yellowfin Integrations
Yellowfin supports 200+ data connectors, including Snowflake, Google BigQuery, Amazon Redshift, Salesforce, Google Analytics, Zendesk, and Xero. It also connects through JDBC and ODBC for custom data sources.
Pros and Cons
Pros:
- Natural language queries generate charts instantly
- Free-form dashboard builder supports advanced interactivity
- Finds anomalies automatically with Yellowfin Signals
Cons:
- Large datasets may cause slower performance
- No built-in cohort or funnel analysis
Learn more about Yellowfin:
Diğer İş Zekâsı Platformları
Kısa listeme giremeyen ancak yine de göz atmaya değer bazı ek iş zekâsı platformu seçenekleri şunlardır:
- 11Google Cloud LookerBest for embedded analytics solutions
- 12Zoho AnalyticsBest for self-service dashboard creation
- 13DatabricksBest for governed lakehouse analytics
- 14SAS ViyaBest for governed analytics in regulated industries
- 15TIBCOBest for statistical modeling and ML workflows
- 16Sisense Best for embedding governed analytics in products
- 17Microsoft Power BIBest for Microsoft 365 data workflows
- 18Apache SupersetBest for open-source SQL-driven dashboards
- 19Qlik Cloud AnalyticsBest for analytics with built-in data prep
- 20SpotfireBest for analytics in industrial and scientific BI
How I Evaluate Business Intelligence Platforms
I split my evaluation into three parts, giving the most weight to connecting data across sources and exploring KPIs in interactive dashboards. Next, I look for differentiators such as natural-language querying or embedded analytics. Finally, I consider onboarding, support, and pricing as teams scale.
Core Functionality (Table Stakes For This List)
When I'm selecting tools for my list, I score each one on a scale from 0 (does not offer the functionality) to 5 (excels in this area) for each core functionality listed below. I then convert the total into a percentage to help assess each tool's overall fit, with extra weight on any functionalities I’ve deemed essential.
- Data Connectivity (Essential): I look for connections to databases, cloud apps, spreadsheets, and APIs, plus refresh options for keeping product usage and customer data current.
- Interactive Visualization (Essential): I assess filters, drill-downs, and chart flexibility—for example, tracing a retention change from a KPI to a cohort.
- Data Modeling: I check for blending, joins, calculated fields, and reusable models to align adoption and activation metrics across sources.
- Self-Service Analytics: I consider whether nontechnical PMs can build a funnel or compare cohorts without requesting a custom query.
- Sharing & Collaboration: I evaluate permissions, scheduled delivery, and embedding so teams can share findings during planning.
- Access & Permissions: I look for role-based controls and granular access settings for sensitive customer data across teams and products.
Once I have a list of tools that meet the criteria, I consider what sets each platform apart.
Differentiating Factors (What Sets Vendors Apart)
Here's how I compare and contrast different vendors:
Standout Features
I evaluate each platform's AI-powered insights—specifically whether natural-language querying returns useful answers or just generic charts. A PM should be able to type "why did activation drop last week" and get a relevant breakdown. Embedded analytics matter just as much, since product teams often need to surface dashboards inside customer-facing apps or internal tools. I also check for alerting and anomaly detection, because catching a retention dip before a sprint review beats discovering it after.
Beyond Features
I evaluate total cost of ownership first, since licensing models range from per-user to consumption-based and hidden charges for premium connectors or compute can quietly inflate spend as your team grows. Vendor ecosystem matters just as much—an active community with certified partners and a plugin marketplace means fewer custom builds when you need a niche integration. I also check each platform's compliance posture, looking for SOC 2 certification, SSO support, and data residency options that keep sensitive product and customer data governed across regions.
İş Zekâsı Platformları Nasıl Seçilir?
Uzun özellik listeleri ve karmaşık fiyatlandırma yapılarına kendinizi kaptırmanız kolaydır. Benzersiz yazılım seçme süreciniz boyunca odaklanmanıza yardımcı olmak için göz önünde bulundurmanız gereken faktörleri içeren bir kontrol listesi hazırladık:
| Faktör | Değerlendirilecek Noktalar |
|---|---|
| FaktörÖlçeklenebilirlik | Değerlendirilecek NoktalarKuruluşunuz büyüdükçe platform artan veri, kullanıcı veya özellik setlerini destekleyecek mi? Veri hacminiz ya da ekip büyüklüğünüz arttıkça ortaya çıkabilecek gizli maliyetleri kontrol edin. |
| FaktörEntegrasyonlar | Değerlendirilecek NoktalarPlatform, CRM'ler, analiz araçları ve veri ambarları gibi en önemli araçlarınıza ve veri kaynaklarınıza yerel olarak bağlanabiliyor mu? Manuel süreçlerden veya veri silolarından kaçının. |
| FaktörÖzelleştirilebilirlik | Değerlendirilecek NoktalarGösterge tablolarını, raporları ve izinleri ekibinizin iş akışlarına veya KPI'larına ne ölçüde uyarlayabilirsiniz? Yinelemeli çalışmayı yavaşlatan katı yapılara karşı dikkatli olun. |
| FaktörKullanım kolaylığı | Değerlendirilecek NoktalarTeknik olmayan kullanıcılar gösterge tabloları oluşturabilir, bunlara erişebilir ve bunlarla etkileşim kurabilir mi, yoksa benimseme için kapsamlı eğitim veya sürekli BT desteği mi gerekiyor? |
| FaktörUygulama ve kullanıma alıştırma | Değerlendirilecek NoktalarEkibiniz kaydolduktan sonra uygulanabilir gösterge tablolarına ne kadar hızlı ulaşabilir? Açık belgeler, kullanıma alıştırma kaynakları ve hızlı yanıt veren tedarikçi desteği arayın. |
| FaktörMaliyet | Değerlendirilecek NoktalarBüyüdükçe fiyatlandırma yapısı kullanım modelinize uyacak mı? Kullanıcı başına, sorgu başına veya kademeli modellerin kuruluşunuzun BI'ı benimseme planıyla örtüşüp örtüşmediğini kontrol edin. |
| FaktörGüvenlik önlemleri | Değerlendirilecek NoktalarVeri erişim kontrolleri, SSO ve denetim günlükleri mevcut mu? Platformun şirketinizin veri gizliliği politikalarını ve yasal gerekliliklerini desteklediğini doğrulayın. |
| FaktörDestek kullanılabilirliği | Değerlendirilecek NoktalarHangi kanallar ne zaman kullanılabilir? Özellikle zamana duyarlı raporlama gerektiğinde tedarikçi, uygulama sırasında ve sonrasında destek ihtiyaçlarınızı karşılıyor mu? |
İş Zekâsı Platformları Nedir?
İş zekâsı platformları, kuruluşların birden fazla kaynaktaki verileri bağlamasına, analiz etmesine ve görselleştirmesine yardımcı olan yazılım araçlarıdır. Bu platformlar, ekiplerin raporlar, etkileşimli panolar ve otomatik uyarılar oluşturmasına olanak tanıyarak performansı takip etmeyi, eğilimleri ortaya çıkarmayı ve bilinçli iş kararlarını desteklemeyi kolaylaştırır.
İş Zekâsı Platformlarının Özellikleri
İş zekâsı platformlarını seçerken aşağıdaki temel özelliklere dikkat edin:
- Veri entegrasyonu: Çeşitli veri kaynaklarına (veritabanları, bulut hizmetleri ve elektronik tablolar) bağlanarak bütünsel analiz için iş verilerini bir araya getirir.
- Pano oluşturma: Kullanıcıların KPI'ları takip eden, eğilimleri görselleştiren ve gerçek zamanlı güncellemeleri görüntüleyen etkileşimli panolar oluşturmasına ve özelleştirmesine olanak tanır.
- Veri görselleştirme: Ekiplerin örüntüleri anlamasına, aykırı değerleri tespit etmesine ve içgörüleri açıkça paylaşmasına yardımcı olmak için grafikler, çizelgeler ve tablolar sunar.
- Zamanlanmış raporlama: Raporların ve panoların belirli kullanıcı veya gruplara düzenli olarak otomatik dağıtılmasını sağlar.
- Role dayalı erişim: İzinleri yönetir ve veri erişimini kullanıcı rollerine göre kısıtlayarak uyumluluğu ve güvenliği destekler.
- Self servis analiz: Teknik bilgiye sahip olmayan kullanıcıların verileri incelemesine, kendi raporlarını oluşturmasına ve kod yazmadan soruları yanıtlamasına olanak tanır.
- İş birliği araçları: Daha kolay tartışma ve ortak analiz için yorum yapmayı, açıklama eklemeyi ve pano paylaşımını destekler.
- Veri modelleme: Doğru ve anlamlı raporlama için gereken ölçüleri, boyutları ve özel hesaplamaları tanımlamanıza olanak tanır.
- Mobil erişilebilirlik: Panolara ve analizlere akıllı telefonlardan ve tabletlerden erişim sunarak ekiplerin her yerde bilgi sahibi olmasını sağlar.
- Denetim izleri: Şeffaflığı korumak ve uyumluluk gerekliliklerini desteklemek için değişiklikleri, kullanıcı işlemlerini ve rapor geçmişini takip eder.
Yaygın İş Zekâsı Platformlarının Yapay Zekâ Özellikleri
Yukarıda listelenen standart iş zekâsı platformu özelliklerinin yanı sıra bu çözümlerin çoğu aşağıdaki gibi özelliklerle yapay zekâyı bünyesine katıyor:
- Otomatik anomali tespiti: Verileri beklenmeyen değişiklikler veya aykırı değerler açısından sürekli tarayarak ekipleri manuel izleme olmadan sorunlar ya da fırsatlar hakkında uyarır.
- Doğal dil sorgulama: Kullanıcıların günlük dille soru sormasına ve anında yapay zekâ tarafından oluşturulan yanıtlar veya görselleştirmeler almasına olanak tanıyarak analitiği herkes için erişilebilir kılar.
- Tahmine dayalı analiz: Eğilimleri, müşteri davranışlarını veya iş sonuçlarını öngörmek için makine öğrenimi modellerini kullanır ve ekiplerin veriye dayalı içgörülerle geleceğe yönelik plan yapmasına yardımcı olur.
- Otomatik içgörü oluşturma: Anlatı biçiminde açıklamalar ve öneriler oluşturarak verilerinizdeki temel eğilimleri, korelasyonları ve etkenleri ortaya çıkarır; böylece manuel analiz için harcanan zamandan tasarruf sağlar.
- Yapay zekâ destekli veri hazırlama: Yapay zekâ algoritmalarını kullanarak ham verileri temizler, dönüştürür ve zenginleştirir; manuel çabayı azaltır ve raporlama için veri kalitesini artırır.
İş Zekâsı Platformlarının Faydaları
İş zekâsı platformlarını uygulamak ekibiniz ve işletmeniz için çeşitli faydalar sağlar. Yararlanabileceğiniz birkaç avantaj şunlardır:
- Gerçek zamanlı içgörüler: Eğilimleri ve performans sorunlarını hızlıca belirlemek için güncel panolara ve dinamik raporlara erişin.
- Veriye dayalı kararlar: Seçimlerinize yön vermek ve tahmine dayalı kararları azaltmak için kapsamlı veri görselleştirmelerinden, entegrasyondan ve analizlerden yararlanın.
- Daha güçlü iş birliği: Daha iyi ekip çalışması ve iletişim için panoları paylaşın, yorum bırakın ve erişimi kolayca yönetin.
- Self servis analiz: Teknik bilgiye sahip olmayan kullanıcıların sezgisel, kodsuz arayüzleri kullanarak verileri incelemesini ve rapor oluşturmasını sağlayın.
- Gelişmiş veri güvenliği: Hassas iş bilgilerini korumak için izinleri yönetin, erişimi izleyin ve denetim izlerini koruyun.
- Otomatik raporlama: Raporları otomatik olarak zamanlayıp dağıtarak manuel iş yükünden tasarruf edin ve tutarlılığı sağlayın.
- Mobil erişilebilirlik: Ekibinizin hareket hâlindeyken bile bilgi sahibi kalması için analizleri herhangi bir cihazdan görüntüleyin ve bunlarla etkileşim kurun.
İş Zekâsı Platformlarının Maliyetleri ve Fiyatlandırması
İş zekâsı platformlarını seçmek, mevcut çeşitli fiyatlandırma modellerinin ve planların anlaşılmasını gerektirir. Maliyetler özelliklere, ekip büyüklüğüne, eklentilere ve diğer unsurlara göre değişir. Aşağıdaki tablo, iş zekâsı platformu çözümlerinde yaygın planları, bunların ortalama fiyatlarını ve genellikle sunulan özellikleri özetlemektedir:
İş Zekâsı Platformları için Plan Karşılaştırma Tablosu
| Plan Türü | Ortalama Fiyat | Yaygın Özellikler |
|---|---|---|
| Plan TürüÜcretsiz Plan | Ortalama Fiyat$0 | Yaygın ÖzelliklerTemel panolar, sınırlı veri kaynakları, topluluk desteği ve kısıtlı paylaşım. |
| Plan TürüKişisel Plan | Ortalama Fiyat$10-$25/kullanıcı/ay | Yaygın ÖzelliklerTek kullanıcılı analiz, artırılmış depolama alanı, standart raporlama araçları ve e-posta desteği. |
| Plan Türüİşletme Planı | Ortalama Fiyat$30-$70/kullanıcı/ay | Yaygın ÖzelliklerÇok kullanıcılı erişim, gelişmiş panolar, zamanlanmış raporlama, role dayalı izinler ve geliştirilmiş iş birliği. |
| Plan TürüKurumsal Plan | Ortalama Fiyat$80-$150+/kullanıcı/ay | Yaygın ÖzelliklerSınırsız kullanıcı, özel entegrasyonlar, gelişmiş güvenlik, uyumluluk yönetimi, özel destek ve SLA'ler. |
İş Zekâsı Platformları Hakkında SSS
İş zekâsı platformları hakkında sık sorulan bazı soruların yanıtlarını burada bulabilirsiniz:
İş zekâsı platformları farklı veri kaynaklarına nasıl bağlanır?
İş zekâsı platformları, güvenli veri hatları oluşturmak için yerleşik bağlayıcıları, API’leri veya veritabanı sürücülerini kullanarak veri kaynaklarına bağlanır. Bulut depolama alanlarını, elektronik tabloları, veritabanlarını ve iş uygulamalarını bağlayarak verileri otomatik olarak alabilir; böylece iş zekâsı yazılımı panoları ve raporları güncel tutabilir.
Teknik bilgisi olmayan kullanıcılar rapor ve pano oluşturabilir mi?
Evet, çoğu BI platformu kod gerektirmeyen, sürükleyip bırakma özellikli arayüzler ve yönlendirmeli iş akışları sunar. Bu güçlü kendi kendine hizmet veren analiz kurulumu, teknik bilgisi olmayan kullanıcıların kod yazmalarına veya BT desteğine ihtiyaç duymadan etkileşimli görselleştirmeler ve raporlar oluşturmasına olanak tanır.
Bir iş zekâsı platformunda hangi güvenlik özelliklerini aramalıyım?
Role dayalı erişim denetimleri, veri şifreleme, denetim günlükleri ve uyumluluk sertifikaları arayın. Bu özellikler hassas bilgilerin korunmasına, veri yönetiminin iyileştirilmesine ve yalnızca yetkili kullanıcıların verilere erişebilmesine veya verileri değiştirebilmesine yardımcı olur. Üst düzey iş zekâsı araçları, bu veri güvenliği protokollerini kuruluş genelinde sürdüren gelişmiş analiz özellikleri de sunar.
Bir iş zekâsı platformunun uygulanması ne kadar sürer?
Uygulama süresi değişiklik gösterir; ancak birçok platform, operasyonel verimliliği hızlı bir şekilde en üst düzeye çıkarmak için ürün turları, şablonlar ve eğitim videoları gibi işe alıştırma kaynakları sunar. Küçük ekipler genellikle temel veri analizini birkaç gün içinde kullanmaya başlayabilirken, daha büyük kuruluşların karmaşık veri entegrasyonu ve özelleştirme için birkaç haftaya ihtiyacı olabilir.
Genellikle hangi destek seçenekleri sunulur?
Çoğu platform, ekibinizin kullanıma sunma sırasında bilinçli bir karar vermesine yardımcı olmak için canlı sohbet, e-posta, telefon ve çevrimiçi bilgi tabanları gibi çeşitli destek kanallarının bir birleşimini sunar. Gartner tarafından tanınan lider sağlayıcılar ayrıca ekiplerin bu analiz özelliklerini tamamen benimsemesine yardımcı olmak için işe alıştırma web seminerleri, kullanıcı toplulukları, görsel analiz atölyeleri ve özel müşteri yöneticileri sunar.