

Bu kadar çok farklı durum panosu yazılımı seçeneği varken hangisinin sizin için doğru olduğunu belirlemek zordur. Çeşitli kaynaklardan gerçek zamanlı verileri bir araya getirmek ve ürünün durumu hakkında kapsamlı bir görünüm elde etmek istediğinizi biliyorsunuz; ancak bu iş için hangi aracın en iyi olduğunu belirlemeniz gerekiyor. Size yardımcı olacağım! Bu yazıda, büyük ekipler ve çeşitli ürünlerle düzinelerce farklı araç kullanırken edindiğim kişisel deneyimlerimi paylaşarak en iyi durum panosu yazılımı seçimleriyle karar vermenizi kolaylaştıracağım.
Why Trust Our Software Recommendations
6,700+
Reviews
20
Industry experts
16+
Evaluation factors
14
Years
Our team has been testing and reviewing software since 2012. As product managers ourselves, we know how difficult—and important—it is to choose the right software.
For this guide, we evaluated tools using hands-on testing and independent research, scoring tools using our selection criteria.
Our reviews reflect our human editorial judgment, not a sales pitch.
Expert reviewers:
- Andrew LumbySenior TPM
- Cristiano ValimSenior UI/UX Lead


Durum Panosu Yazılımları Karşılaştırma Tablosu
Bu karşılaştırma tablosu, en iyi durum panosu yazılımı seçimlerimin fiyatlandırma ayrıntılarını özetlemektedir:
Score legend (out of 5)
- Excellent4.5–5
- Good4–4.4
- Average3–3.9
- Below average2–2.9
- Poor1–1.9
Sorted by: Default
| Tool | Starting Price | Website | |||||||
|---|---|---|---|---|---|---|---|---|---|
Best for government-grade status page compliance | 3.8 out of 5 | 4 | 4 | 4 | 3 | 4 | 4 | $29/month 30-day free trial | Website |
Best for monitoring third-party service dependencies | 3.7 out of 5 | 4 | 3 | 4 | 3 | 4 | 4 | $72/month Free plan + 14-day free trial available | Website |
Best for Atlassian-connected incident communication | 3.7 out of 5 | 4 | 4 | 4 | 3 | 3 | 4 | $29/month Free plan available | Website |
Best for monitoring-driven status page automation | 3.7 out of 5 | 5 | 4 | 2 | 3 | 4 | 4 | $29/user/month Free plan available | Website |
Best for AI-powered dashboard creation | Not rated | 1 | 3 | 1 | Not rated | 1 | Not rated | $20/month Free plan available | Website |
Best for monitoring integrations with auto-updates | 4.2 out of 5 | 5 | 5 | 4 | 3 | 4 | 4 | $20/month Free plan available | Website |
Best for multi-audience incident communication | 4.0 out of 5 | 5 | 4 | 4 | 3 | 4 | 4 | $49/month 14-day free trial + free demo available | Website |
Best for ITSM-connected incident status pages | 4.2 out of 5 | 4 | 4 | 5 | 3 | 4 | 5 | Pricing upon request Free demo available | Website |
Best for monitoring-native status page automation | 3.8 out of 5 | 4 | 3 | 4 | 4 | 4 | 4 | $7/month 14-day free trial + free demo available | Website |
Best for white-label status pages with 24/7 support | 4.0 out of 5 | 4 | 5 | 4 | 3 | 4 | 4 | $79/month Not available | Website |


En İyi Durum Panosu Yazılımları İncelemeleri
Aşağıda, kısa listeme giren en iyi durum panosu yazılımlarına ilişkin ayrıntılı özetlerimi bulabilirsiniz. İncelemelerim, size en uygun olanı bulmanıza yardımcı olmak için her aracın temel özelliklerine, artılarına & eksilerine, entegrasyonlarına ve ideal kullanım alanlarına ayrıntılı bir bakış sunuyor.
 Best for government-grade status page compliance
- 30-day free trial
- From $29/month
Visit WebsiteCustomer Rating:4.9/5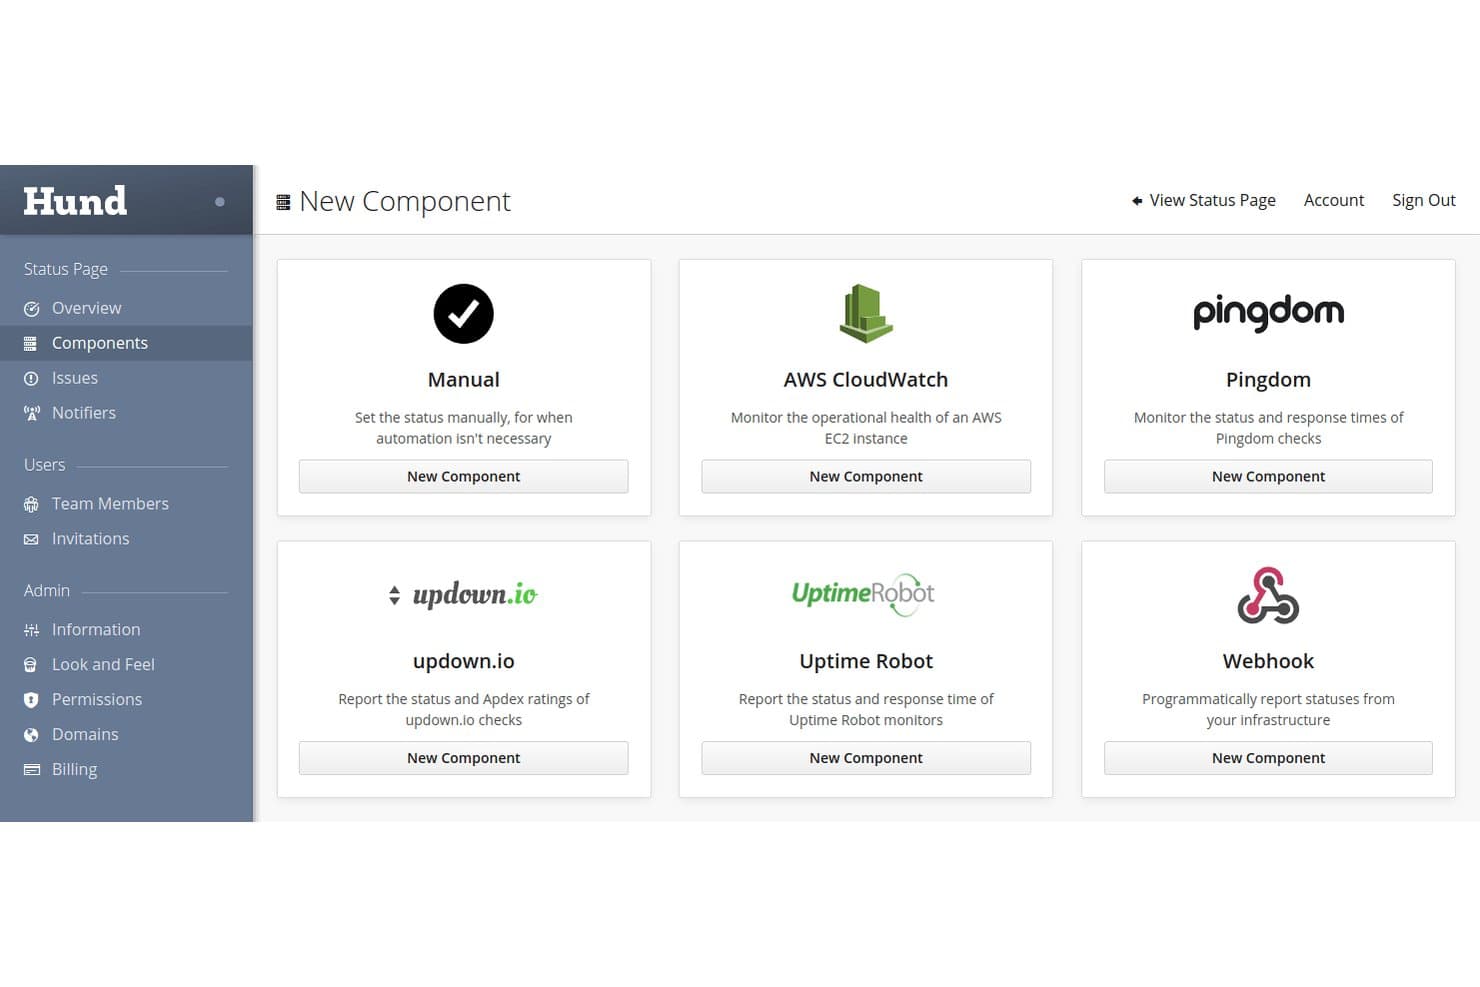
Hund.io supports multiple monitoring integrations like AWS, Pingdom, and Webhooks. Hund.io is a hosted status page platform with built-in service monitoring, multi-channel incident notifications, and automated workflows for tracking and communicating component health.
Who Is Hund.io Best For?
Hund.io is a strong fit for DevOps and IT ops teams in security-conscious organizations, particularly those navigating government compliance requirements like FedRAMP or ITAR.
Why I Picked Hund.io
I've included Hund.io in my top picks because it's one of the few status page platforms with purpose-built infrastructure for government compliance, including isolated deployments designed to meet FedRAMP, ITAR, and DoD SRG Level 2 and 4 requirements. I also like that its Sovereign Enterprise tier offers custom data residency and fully isolated, high-availability infrastructure, which is rare in this category. The audit trail is immutable and RBAC controls go down to individual objects, so access accountability is genuinely locked down.
Hund.io Key Features
- Watchdog monitoring: Built-in HTTP, TCP, DNS, and ICMP checks automatically test your services from multiple global regions and update component status without manual input.
- Dead Man's Switch: A webhook that watches scheduled jobs and internal check-ins, automatically opening an outage if a check-in is missed.
- Communication templates: Pre-built message templates with variables keep incident updates consistent across your team throughout the incident lifecycle.
- Terraform provider: An official Terraform provider lets you manage your status page infrastructure as code alongside the rest of your DevOps toolchain.
Hund.io Integrations
Hund.io integrates with PagerDuty, New Relic, AWS CloudWatch, Pingdom, UptimeRobot, Slack, Microsoft Teams, and GitHub. It also provides a REST API and webhooks for custom monitoring and incident workflows.
Pros and Cons
Pros:
- Immutable audits support access accountability
- Automated monitoring updates component health
- Government-grade compliance options
Cons:
- Third-party review coverage remains thin
- Reporting lacks documented SLA analytics
Learn more about Hund.io: Best for monitoring third-party service dependencies
- Free plan + 14-day free trial available
- From $72/month (billed annually)
Visit WebsiteCustomer Rating:5/5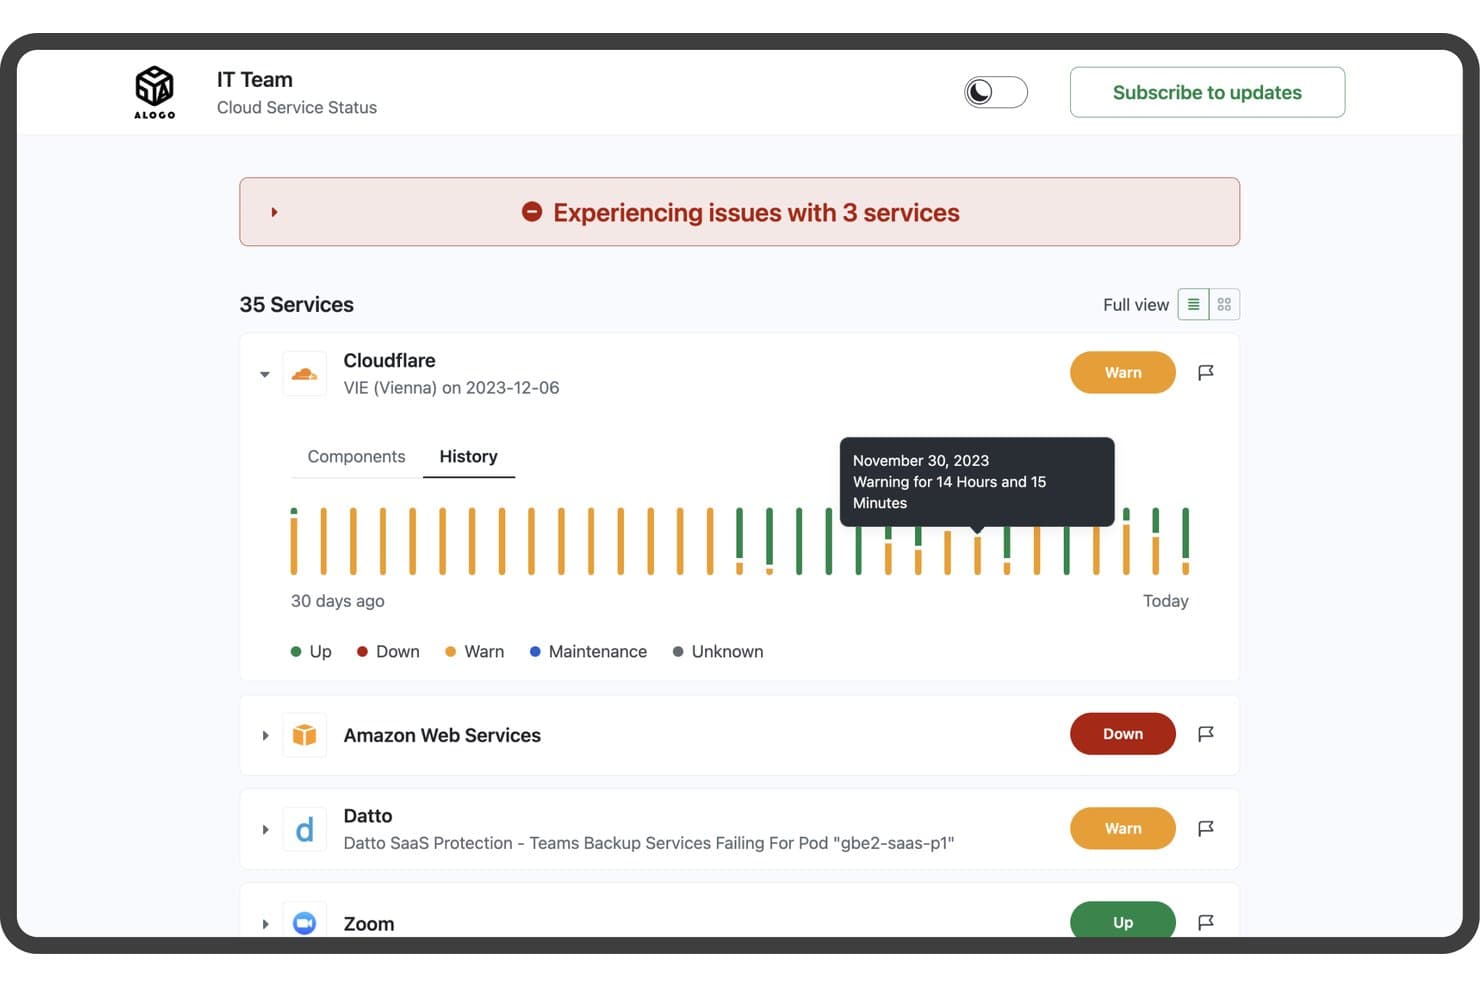
StatusGator tracks cloud service health with real-time status and history. StatusGator is a status dashboard tool that aggregates third-party service status pages alongside your own website, ping, and custom monitors into a single public or private status page with incident management, subscriber notifications, and uptime history.
Who Is StatusGator Best For?
StatusGator is a strong fit for IT operations and support teams that rely heavily on third-party SaaS tools and need to track vendor outages alongside their own infrastructure in one place.
Why I Picked StatusGator
StatusGator earns its spot on my shortlist because it tracks 10,780+ third-party vendor status pages alongside your own monitors in one place. I particularly like its Early Warning Signals feature, which detects outages before providers officially acknowledge them—flagging Google Workspace issues around four hours early, for example. When a SaaS dependency goes down, that lead time matters. Paired with automatic incident creation from third-party status pages, it gives IT ops and support teams a genuinely proactive view of vendor health.
StatusGator Key Features
- Structured incident lifecycle: Create incidents with defined phases (Investigating, Identified, Monitoring, Resolved), severity levels, and per-monitor status flags—then post timestamped updates to subscribers with each change.
- Scheduled maintenance windows: Set start and end times for planned outages, automatically move them to "In Progress," and let them self-resolve so your status page stays accurate without manual intervention.
- Multi-channel subscriber notifications: Alert stakeholders through email, SMS, Slack, Microsoft Teams, Google Chat, Discord, and mobile push—with component-level filtering so subscribers only hear about what affects them.
- Exportable uptime reports: Pull board history, status changes, and component summaries as CSV, JSON, or Excel files for any date range directly from the Reports section.
StatusGator Integrations
StatusGator offers documented integrations with PagerDuty, Opsgenie, Freshdesk, Zendesk, Slack, Microsoft Teams, Datadog, Cisco Meraki, Atlassian Statuspage, and AWS. It also supports API v3, webhooks, an MCP server, and private status ingestion from Azure, Google Cloud, and Microsoft 365.
Pros and Cons
Pros:
- Exportable uptime history supports transparency
- Early warnings before provider confirmation
- Third-party dependency visibility
Cons:
- Branding offers limited design control
- Custom service incidents require manual updates
Learn more about StatusGator: Best for Atlassian-connected incident communication
- Free plan available
- From $29/month
Visit WebsiteCustomer Rating:4.2/5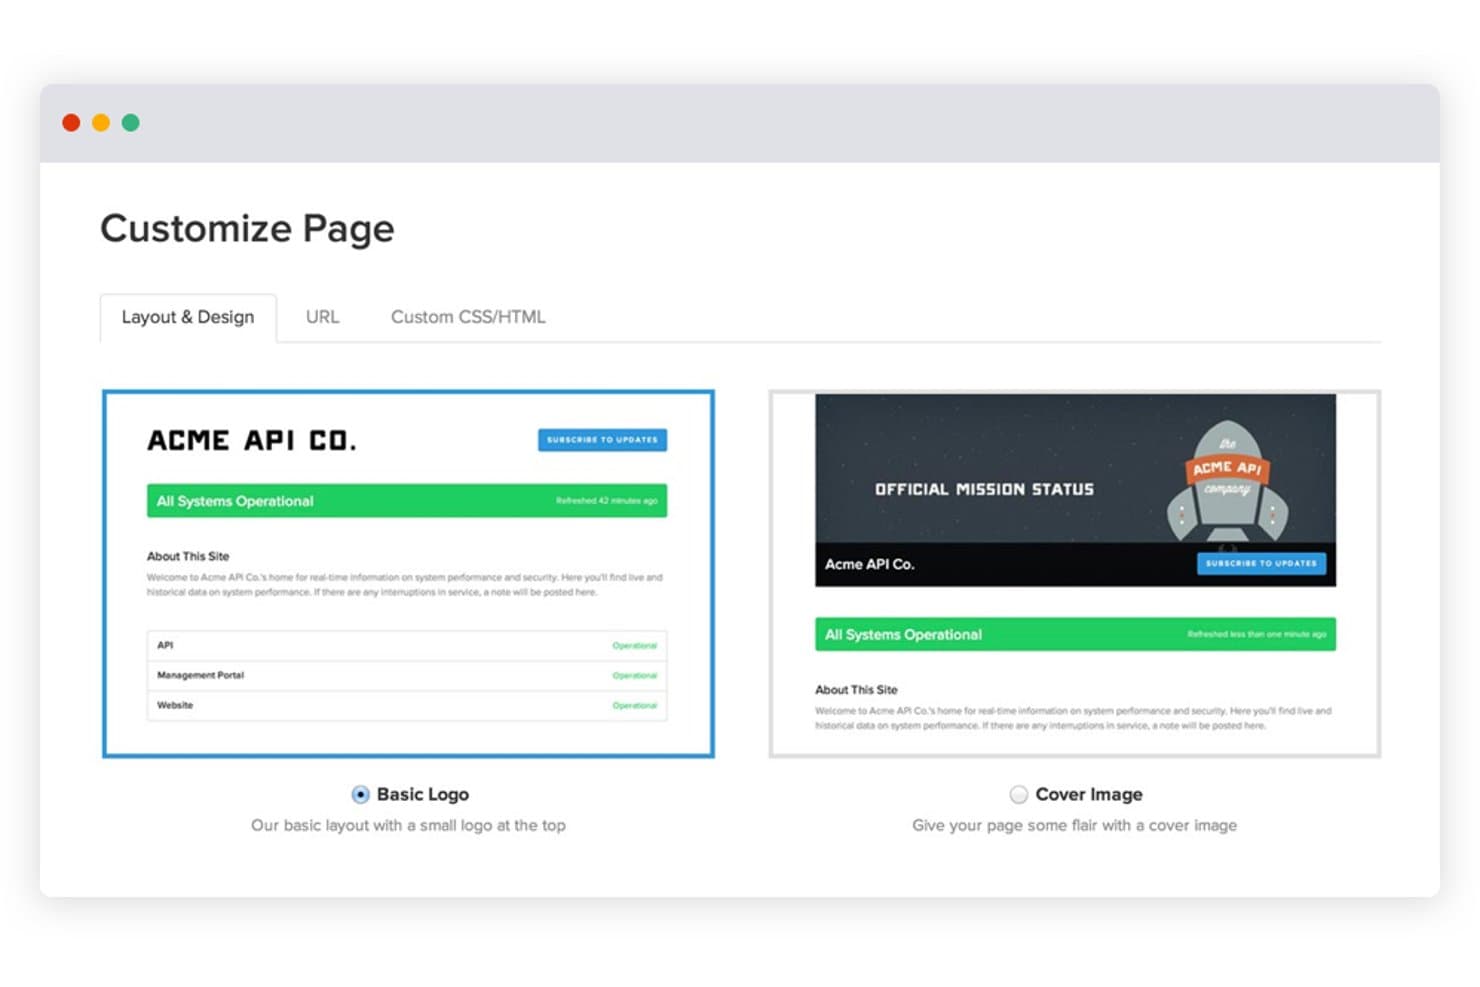
Statuspage lets users customize status page layouts with logo or cover image options. Statuspage is a hosted status dashboard tool from Atlassian that lets you publish public, private, and audience-specific status pages with incident updates, scheduled maintenance, component tracking, and multi-channel subscriber notifications.
Who Is Statuspage Best For?
Statuspage is a strong fit for teams already in the Atlassian ecosystem who need a mature, customer-facing incident communication tool.
Why I Picked Statuspage
Statuspage earns its spot on my shortlist because it's built specifically for Atlassian-connected teams that need a mature, customer-facing incident communication layer. I love how it supports three distinct page types: public pages for customers, private pages authenticated via Okta or Ping Identity, and audience-specific pages for separate user groups. When an incident hits, structured timestamped updates push automatically across email, SMS, Slack, and Teams, keeping subscribers informed without your team scrambling to send manual updates.
Statuspage Key Features
- Embeddable status widget: A pre-built widget you can add to your website or app to surface live component status without sending users to a separate page.
- Incident templates: Reusable message templates that let your team post consistent, pre-written incident updates quickly during an outage.
- Public metrics: A configurable display of live system performance data, supporting up to 50 metrics on Enterprise plans, shown directly on your status page.
- Third-party component tracking: A feature that lets you add external vendor statuses to your page so subscribers see upstream dependencies alongside your own services.
Statuspage Integrations
Statuspage offers native integrations with Slack, Microsoft Teams, Twitter, Okta, Ping Identity, OneLogin, and Bitium. It also provides REST API access and webhooks for custom integrations.
Pros and Cons
Pros:
- Provides embeddable widgets and historical uptime data
- Publishes timestamped updates across multiple channels
- Supports public, private, and audience-specific pages
Cons:
- Advanced controls require higher-tier plans
- Requires external monitoring for automated health checks
Learn more about Statuspage: Best for monitoring-driven status page automation
- Free plan available
- From $29/user/month (billed annually)
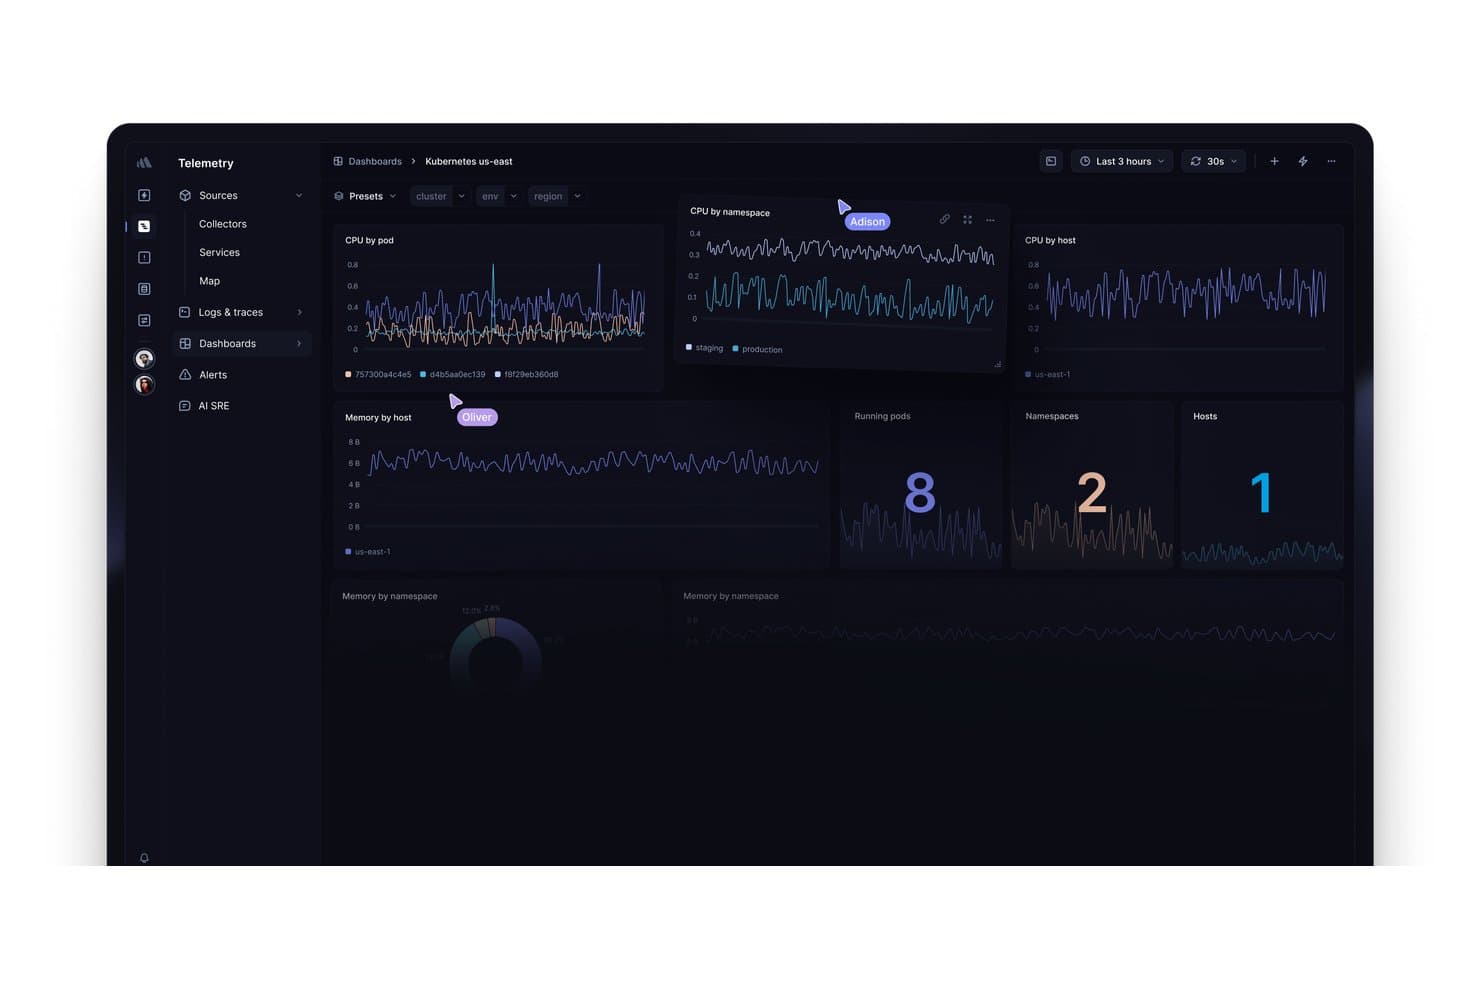
Better Stack displays Kubernetes metrics across CPU, memory, pods, and hosts. Better Stack is an observability platform that combines uptime monitoring, incident management, on-call scheduling, and hosted status pages in one unified product.
Who Is Better Stack Best For?
Better Stack is a strong fit for DevOps and SRE teams who want monitoring, on-call management, and status pages in one place rather than stitching together separate tools.
Why I Picked Better Stack
Better Stack earns its spot on my shortlist because it's the only tool here that ties monitoring directly to your status page, so incident updates post automatically when a monitor detects downtime. I love that you can set up automated status workflows across HTTP, SSL, DNS, and heartbeat monitors without writing a single line of code. On-call scheduling, AI-assisted post-mortems, and real-time response-time charts on the public page all live in the same product.
Better Stack Key Features
- Multi-type uptime monitoring: Run HTTP, SSL, DNS, TCP, heartbeat, and Playwright transaction checks from multiple global locations, each with a screenshot and second-by-second error timeline.
- Private status pages: Restrict internal status pages behind SSO, a password, or an IP allowlist, making them accessible only to specific teams or enterprise users.
- Subscriber email notifications: Let users subscribe to updates for the full page or individual components, with 1,000 subscriber slots included on paid plans.
- Multi-language page support: Translate your status page into any language and edit every string, so you can serve global audiences in their preferred language.
Better Stack Integrations
Better Stack integrates with Datadog, New Relic, Grafana, Prometheus, Zabbix, AWS, Azure, Google Cloud, Slack, and Microsoft Teams. It also supports REST API, Terraform, webhooks, and Zapier connectivity.
Pros and Cons
Pros:
- Multilingual pages support global stakeholders
- Response-time charts clarify service health
- Monitor incidents update status pages automatically
Cons:
- Daily incident grouping complicates outage reporting
- Subscriber notifications center mainly on email
Learn more about Better Stack: Best for AI-powered dashboard creation
- Free plan available
- From $20/month
Visit WebsiteCustomer Rating:5/5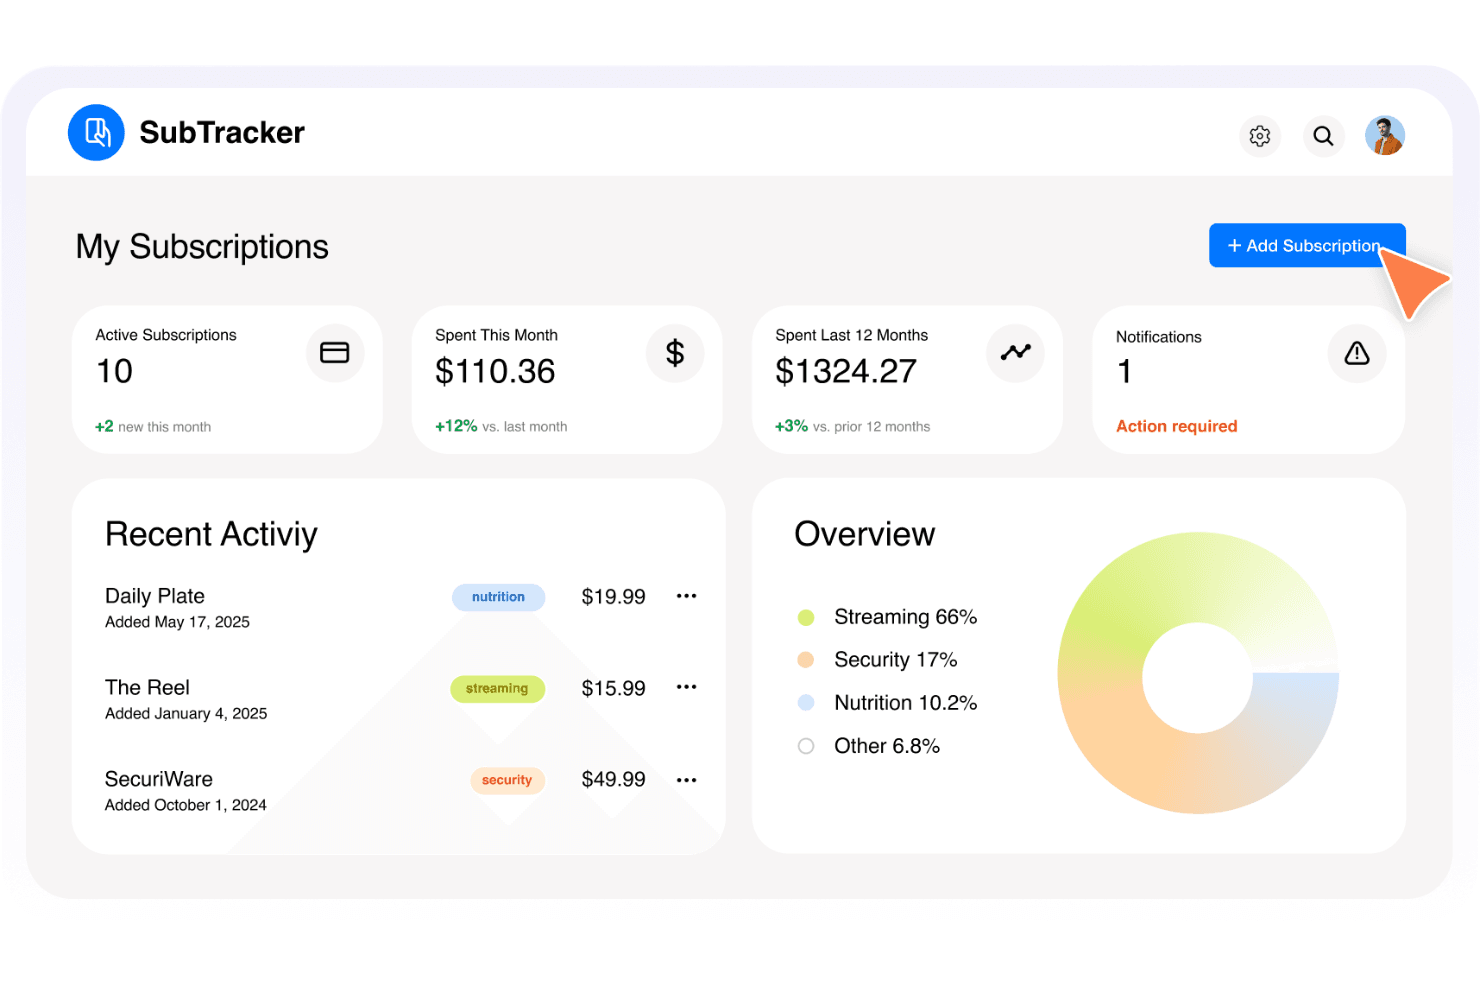
Base44 dashboard template selection interface. Base44 is a no-code, AI-powered app builder that lets you design and deploy custom web apps—including dashboards—by describing what you want in plain language, without writing any code.
Who Is Base44 Best For?
Base44 is a good fit for product managers who want to prototype a custom status dashboard without writing any code.
Why I Picked Base44
I picked Base44 as one of the best because it lets you build a fully custom status dashboard by describing what you want in plain language—no coding required. If you need a dashboard tailored to your product's specific components rather than a generic template, the AI generates the front end, database, and hosting in one go. I've found that product managers who want to prototype a bespoke status view, with custom data models and branding, can get something live in days rather than weeks.
Base44 Key Features
- Custom domain support: You can connect your own domain to give your app a branded, professional URL.
- Built-in database: Base44 generates a structured database alongside your app, so custom data models for service components are included automatically.
- One-click integrations: Connect to tools like Slack, SendGrid, and Gmail to build notification workflows directly into your app.
- Two-way GitHub sync: Export your full app source code to GitHub, giving you complete ownership of what you build.
Base44 Integrations
Base44 lists one-click integrations with Slack, SendGrid, Gmail, Google Drive, Notion, HubSpot, Salesforce, Stripe, and OpenAI, plus two-way GitHub sync on Elite. It has no documented native integrations with monitoring or alerting tools.
Pros and Cons
Pros:
- Exportable source code supports ownership
- Built-in database and hosting
- Rapid custom dashboard prototyping
Cons:
- AI fixes can consume credits amid bugs
- No native uptime monitoring
Learn more about Base44: Best for monitoring integrations with auto-updates
- Free plan available
- From $20/month
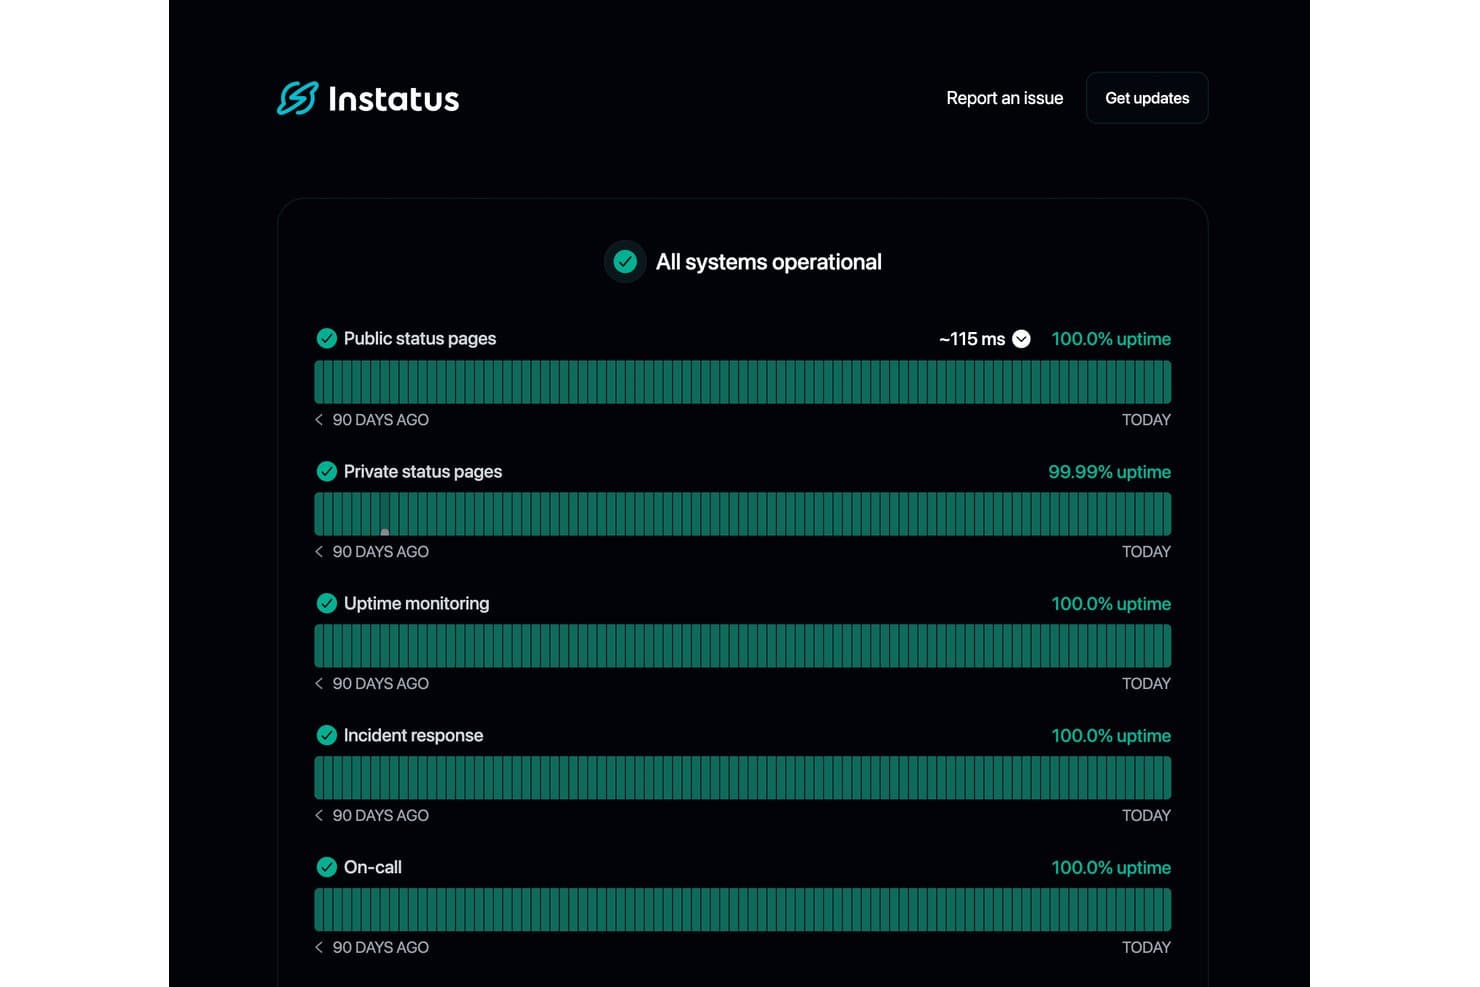
Instatus displays real-time uptime metrics across all monitored services. Instatus is a status dashboard platform that combines public and private status pages, built-in uptime monitoring, incident management, and multi-channel subscriber notifications in one tool.
Who Is Instatus Best For?
Instatus is a great fit for DevOps and SRE teams that want uptime monitoring, on-call escalations, and a public status page without juggling three separate tools.
Why I Picked Instatus
Instatus earns its spot on my shortlist because of how well it handles monitoring integrations with auto-updates. I love that when a connected tool like Datadog or PagerDuty detects an issue, Instatus automatically creates an incident and updates the status page, so my team isn't manually posting updates mid-outage. On-call escalations are built in too, which means the right people get looped in without a separate tool.
Instatus Key Features
- Subscriber notifications: Subscribers can receive incident and maintenance updates across email, SMS, Slack, Microsoft Teams, webhook, RSS, and X.
- Maintenance scheduling: Plan and publish scheduled maintenance windows with affected components, status updates, and automatic subscriber alerts before and during the event.
- Custom branding and page styling: Apply your logo, favicon, brand colors, and custom HTML, CSS, or JavaScript across up to five locations on your status page.
- Embeddable status widget: Embed a live status widget directly on your website or inside the Intercom messenger so users see real-time health updates in context.
Instatus Integrations
Instatus offers native integrations with Datadog, PagerDuty, Prometheus, Grafana, New Relic, Pingdom, UptimeRobot, Google Cloud Monitoring, Slack, and Microsoft Teams. It also supports API, webhook, email, Jira, and Zapier connections.
Pros and Cons
Pros:
- Deep branding supports trustworthy customer communication
- Flexible audience targeting clarifies component health
- Automated incident updates reduce manual status work
Cons:
- Uptime reporting lacks exportable SLA evidence
- Business features require a steep upgrade
Learn more about Instatus: Best for multi-audience incident communication
- 14-day free trial + free demo available
- From $49/month
Visit WebsiteCustomer Rating:5/5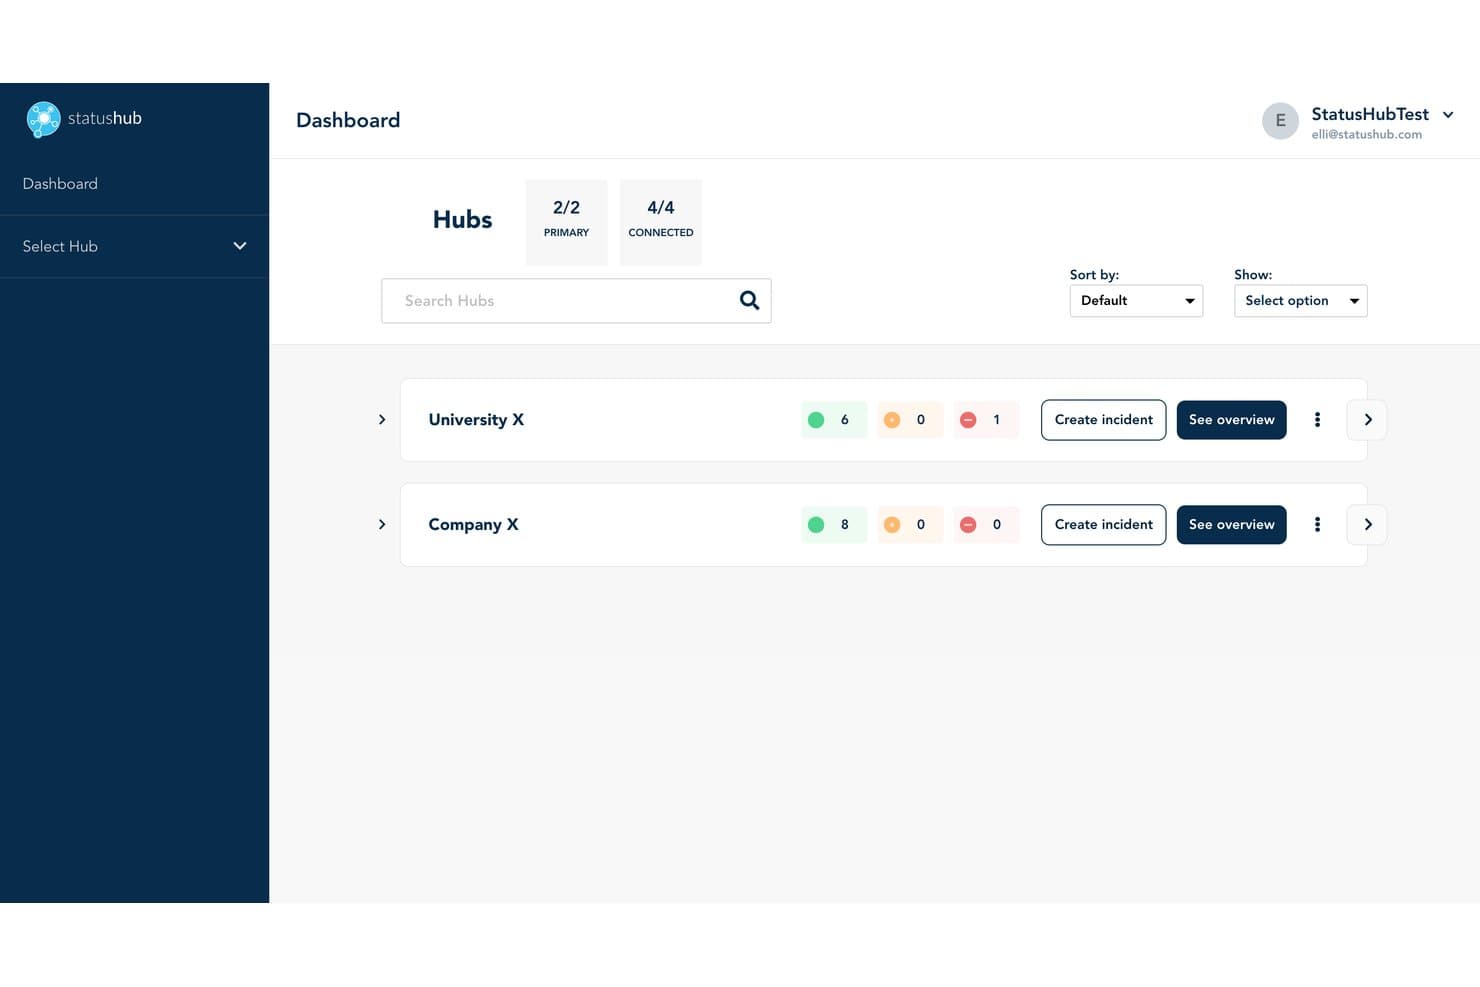
StatusHub lets users monitor multiple hubs and service health at a glance. StatusHub is a status dashboard platform that lets you run public and private status pages, manage incidents through structured workflows, and notify subscribers across multiple channels including email, SMS, Slack, and Microsoft Teams.
Who Is StatusHub Best For?
StatusHub is a strong fit for IT operations and customer support teams that need to communicate incidents to multiple distinct audiences, like internal staff, regional customers, or separate product lines.
Why I Picked StatusHub
I picked StatusHub as one of the best because its Connected Hubs feature is unlike anything else I've seen in this category. It lets you run separate, targeted status pages for distinct audiences from a single account, so your internal IT staff, regional customers, and enterprise clients each see only what's relevant to them. Pair that with structured ITIL-aligned incident stages and pre-built message templates, and your support team can post clear, consistent updates fast, even mid-incident.
StatusHub Key Features
- Multi-channel subscriber notifications: Subscribers self-select their preferred channel—email, SMS, Slack, Microsoft Teams, or webhook—and filter alerts by individual service.
- SAML 2.0 and OAuth private pages: Internal status pages sit behind single sign-on authentication, keeping sensitive incident updates visible only to authorized staff.
- Monitoring tool integrations: Connections to Pingdom, New Relic, UptimeRobot, PagerDuty, and others automatically update service statuses without manual input.
- Embeddable status widgets: Live service status can be embedded directly into your product, website, or support portal for in-context visibility.
StatusHub Integrations
StatusHub offers documented integrations with Pingdom, New Relic, UptimeRobot, SolarWinds Observability, PagerDuty, Opsgenie, Zendesk, Slack, Microsoft Teams, and Okta. Its REST API and webhooks support custom connectivity.
Pros and Cons
Pros:
- Templates guide consistent outage updates
- Private pages support internal incident communication
- Connected Hubs target distinct customer audiences
Cons:
- Ongoing management requires considerable effort
- Reporting lacks advanced uptime analytics
Learn more about StatusHub: Best for ITSM-connected incident status pages
- Free demo available
- Pricing upon request
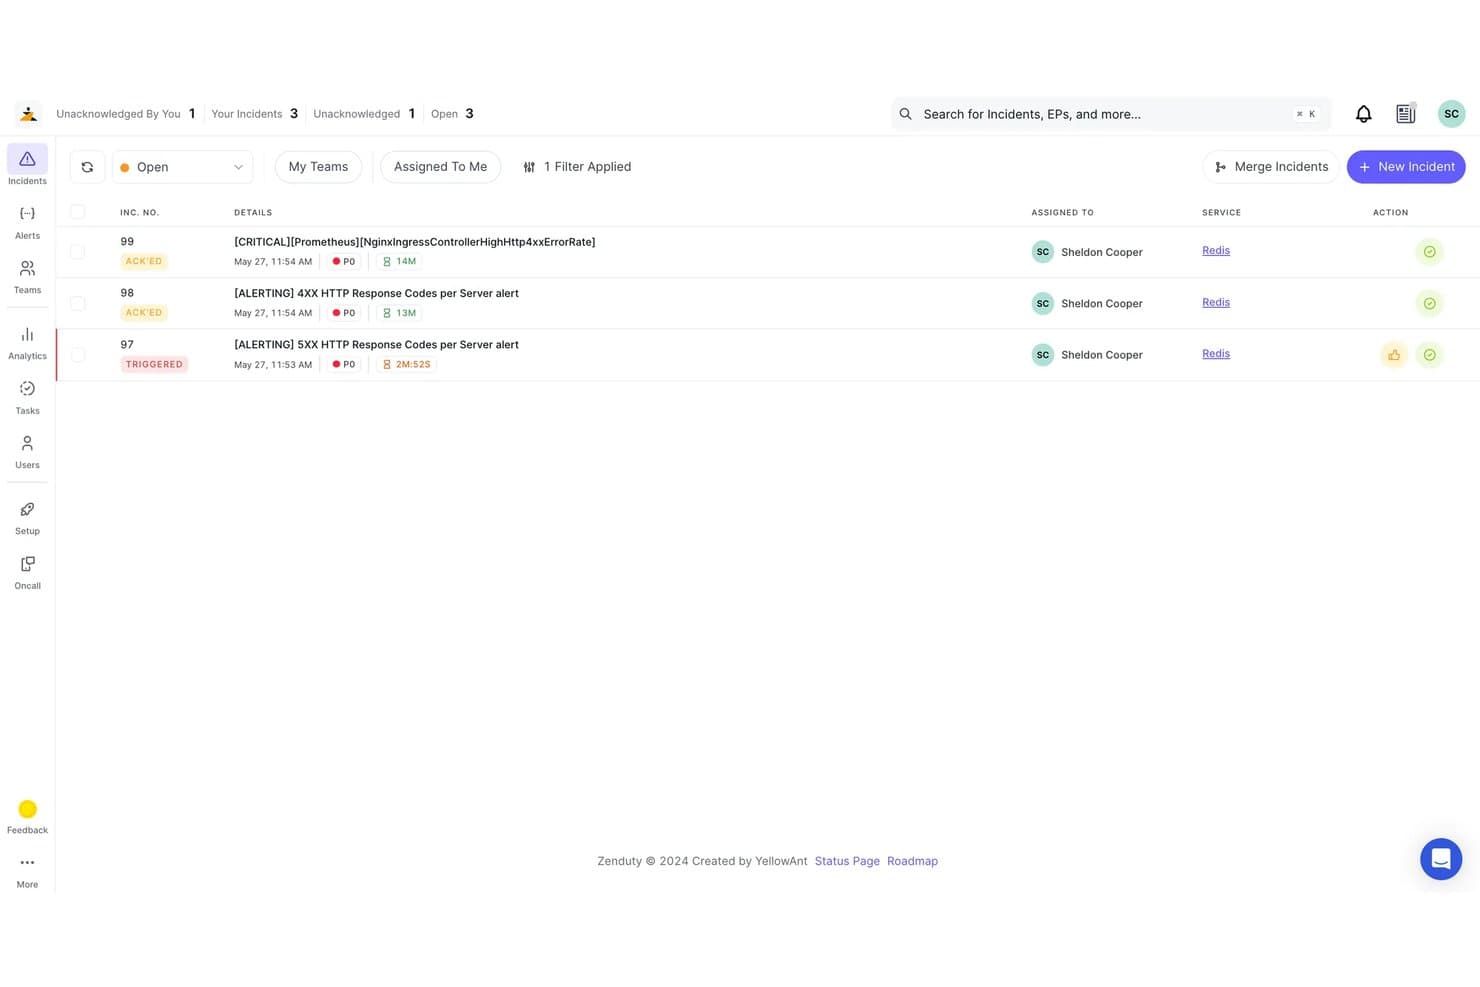
Zenduty lets users monitor and manage open incidents by priority and status. Xurrent is an ITSM and incident management platform that includes status pages with real-time incident syncing, audience-specific views, automated subscriber notifications, and 150+ monitoring tool integrations via its no-code Beacon connectors.
Who Is Xurrent Best For?
Xurrent is a strong fit for IT operations and DevOps teams that already run incident workflows and want their status pages to update automatically from those incidents.
Why I Picked Xurrent
Xurrent earns its spot on my shortlist because its status pages are wired directly into its incident management platform, meaning your public page updates the moment a responder changes an incident's state in IMR. I particularly like the Beacon connectors, which pull signals from over 150 monitoring tools and can automatically open, update, and resolve incidents without anyone touching the status page manually. Audience-specific views let you serve different status pages to different customer segments from one control center, each with its own components and notification rules.
Xurrent Key Features
- Scheduled maintenance windows: Set maintenance events with estimated end times, auto-close rules, and reminder notifications at configurable intervals before and during the window.
- Uptime SLA reporting: View component and group uptime across daily, weekly, monthly, and yearly ranges, measured against warning and critical thresholds you define, with CSV export.
- Role-based access with SSO and SCIM: Control who can view or manage pages using SAML, OpenID Connect, SCIM provisioning, and audit trails across your organization.
- Embeddable status widgets: Embed live status and uptime history widgets directly into portals, SharePoint sites, or other web properties without redirecting users to a separate page.
Xurrent Integrations
Xurrent offers 150+ integrations through Beacons, including Datadog, New Relic, Prometheus, Jira, ServiceNow, Slack, Microsoft Teams, GitHub, and GitLab. Its REST API supports custom integrations and status data workflows.
Pros and Cons
Pros:
- Postmortems connect outages to tracked actions
- Audience-specific views clarify product health
- Incident states update public pages automatically
Cons:
- Documentation spans overlapping legacy product brands
- Status pages require broader ITSM context
Learn more about Xurrent: Best for monitoring-native status page automation
- 14-day free trial + free demo available
- From $7/month (billed annually)
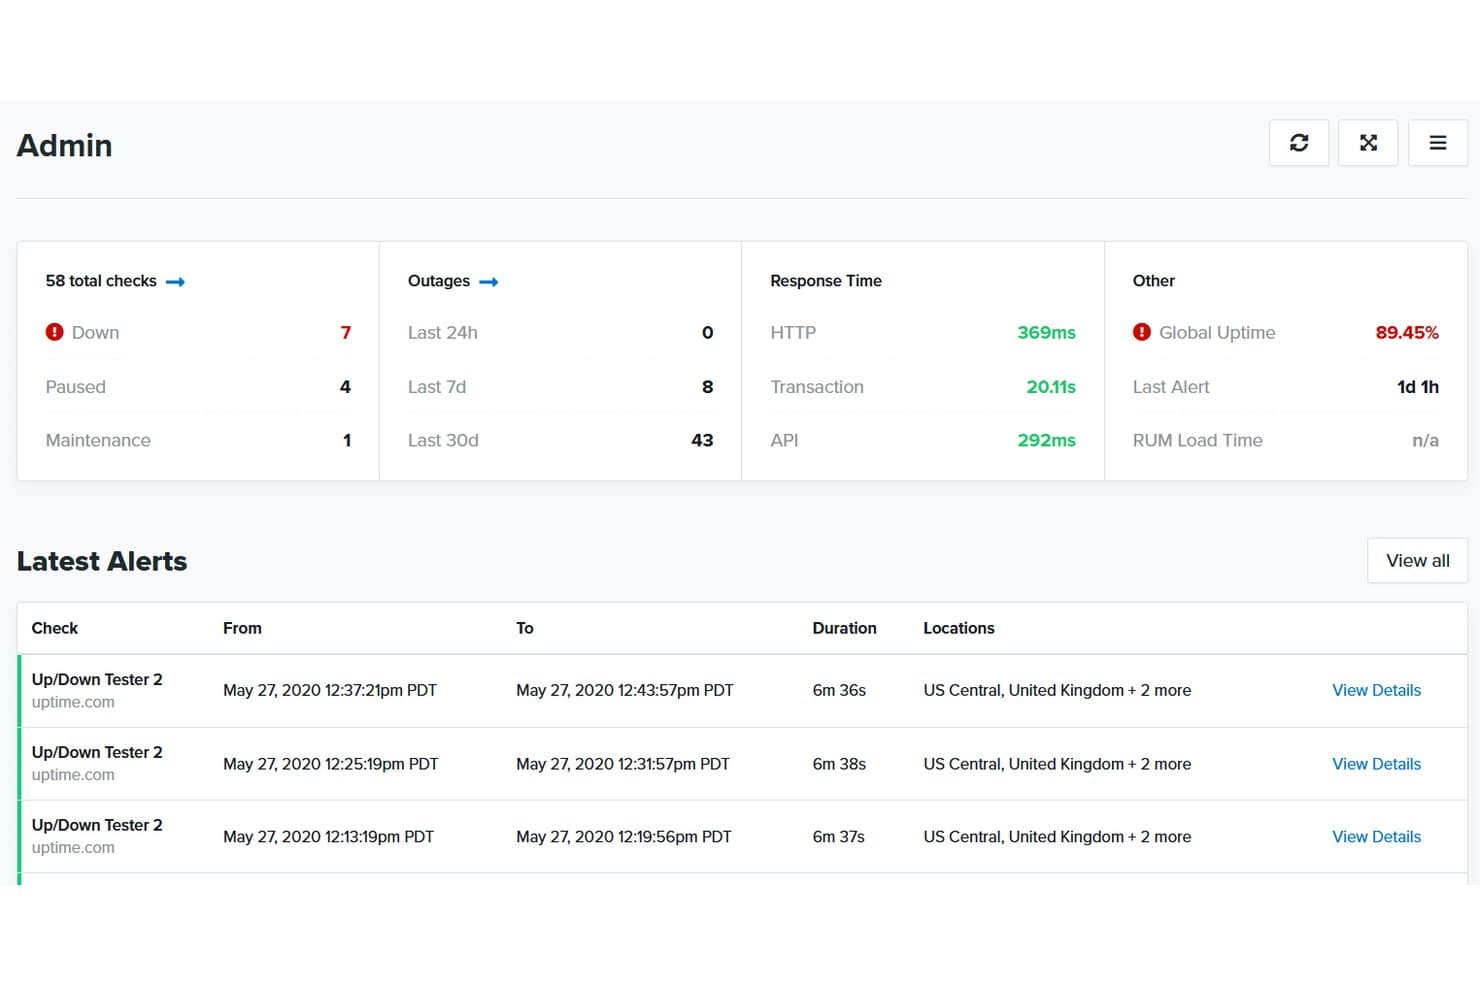
Uptime.com centralizes uptime checks, outages, and alerts in one dashboard. Uptime.com is a website monitoring platform that pairs uptime checks with hosted status pages, giving you incident management, component tracking, subscriber notifications, and SLA reporting in one place.
Who Is Uptime.com Best For?
Uptime.com is a strong fit for DevOps and IT operations teams that want monitoring and status pages managed from a single platform.
Why I Picked Uptime.com
I picked Uptime.com as one of the best because it's the only tool on this list where your monitoring checks and status page are genuinely the same system. When a check detects an outage, the linked component updates automatically, no manual post required. I also like that you can run multiple status pages from one account and clone them with their components and design intact, which is a real time-saver when managing several products or environments.
Uptime.com Key Features
- Subscriber component filtering: Subscribers choose which specific components they want to receive notifications about, so they only get updates relevant to them.
- Multi-tenant status pages: Separate, secure status views can be provisioned for different customer groups from a single account.
- Maintenance window scheduling: Planned maintenance events can be scheduled and published directly on your status page ahead of time.
- SLA reporting: Built-in SLA tracking and reporting lets you measure and share uptime performance data with stakeholders.
Uptime.com Integrations
Uptime.com integrates with PagerDuty, Slack, and Opsgenie, plus custom webhooks for sending alerts to other tools. Its API supports custom integrations.
Pros and Cons
Pros:
- Subscribers filter alerts by component
- Multi-tenant pages protect customer-specific service views
- Automatic component updates from monitoring checks
Cons:
- Custom HTML and CSS are plan-gated
- Advanced features require more configuration
Learn more about Uptime.com: Best for white-label status pages with 24/7 support
- Not available
- From $79/month
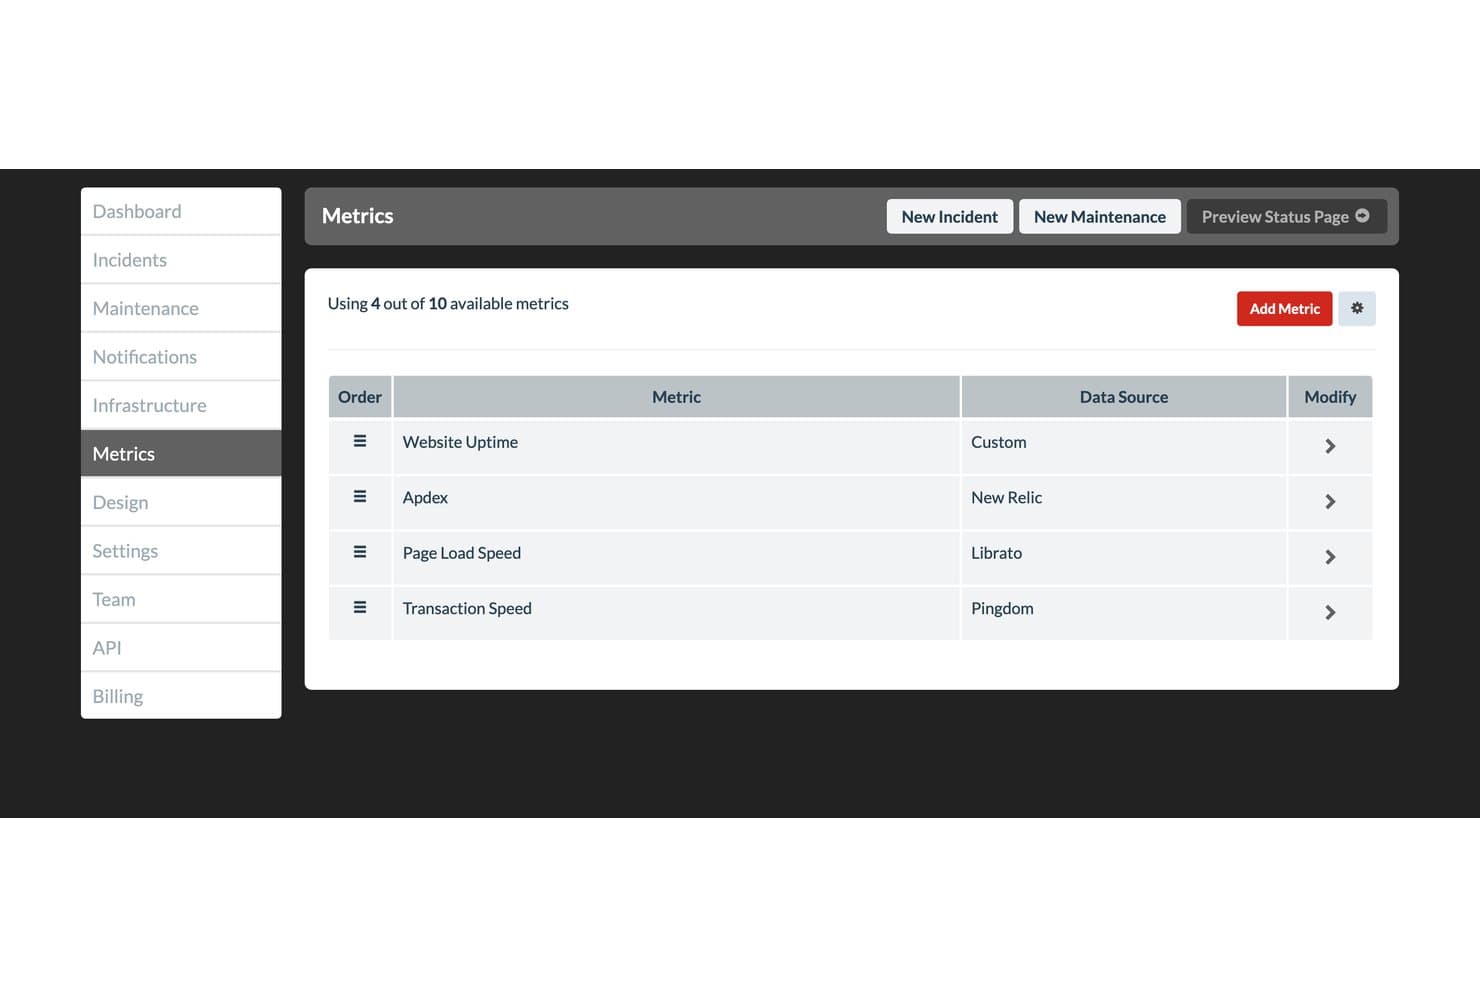
Status.io lets users monitor product health metrics from multiple data sources. Status.io is a hosted status page platform that lets you publish real-time incident and maintenance updates, manage component health, and notify subscribers across nine channels including email, SMS, Slack, and webhooks.
Who Is Status.io Best For?
Status.io is a strong fit for IT operations and DevOps teams that need a fully customizable, white-label status page with deep monitoring integrations and enterprise-grade access controls.
Why I Picked Status.io
Status.io earns its spot on my shortlist because it's one of the few status page tools that gives you true white-label control: custom domain, your own TLS/SSL certificate, and full HTML, CSS, and JavaScript injection to match your brand exactly. I also rate its 24/7 human support highly, which matters when you're managing an active incident at 2 a.m. and need a real answer fast. On top of that, automated maintenance windows start and end without manual intervention, so your status page stays accurate even when no one's watching.
Status.io Key Features
- Multi-channel subscriber notifications: Subscribers receive incident updates across nine channels, including email, SMS, Slack, Microsoft Teams, webhook, and RSS.
- Monitoring tool integrations: Status.io connects with PagerDuty, OpsGenie, Nagios, New Relic, Pingdom, and others to trigger automatic component status changes.
- Location map display: A geographic map shows component health by region, so users can quickly identify where an issue is occurring.
- Private page access controls: Pages can be restricted to specific team members, IP addresses, or users authenticated through SAML or OIDC identity providers.
Status.io Integrations
Status.io offers eight native status automation integrations, including PagerDuty, OpsGenie, Nagios, New Relic, Pingdom, Site24x7, StatusCake, and UptimeRobot. It also supports email integrations, plus Developer and Public APIs for custom connectivity.
Pros and Cons
Pros:
- Geographic component maps clarify regional outages
- Automated maintenance windows prevent outdated notices
- Full white-label control matches product branding
Cons:
- No native post-incident reporting or SLA tracking
- Ninety-day history limits long-term health analysis
Learn more about Status.io:
Diğer Durum Panosu Yazılımları
Kısa listeme giremeyen ancak yine de göz atmaya değer bazı ek durum panosu yazılımı seçenekleri şunlardır:
- 11ChecklyBest for monitoring-as-code status pages
- 12HyperpingBest for consolidated monitoring and status pages
- 13PagerDutyBest for incident-driven on-call status updates
- 14Site24x7Best for monitoring-native status page bundling
- 15Oh DearBest for monitoring-native agency status pages
- 16FireHydrantBest for ops-led incident status workflows
- 17incident.ioBest for Slack-native incident status workflows
- 18StatusDashboardBest for multi-channel status page notifications
- 19PulseticBest for monitoring-driven status page setup
How I Evaluate Status Dashboard Software
I split my evaluation into three parts: core functionality (does it host a real-time public status page and manage incidents with structured lifecycle stages?), standout features like monitoring tool integrations, and beyond-features factors like support quality and pricing value. Core functionality carries the most weight.
Core Functionality (Table Stakes For This List)
When I'm selecting tools for my list, I score each one on a scale from 0 (does not offer the functionality) to 5 (excels in this area) for each core functionality listed below. I then convert the total into a percentage to help assess each tool's overall fit, with extra weight on any functionalities I've deemed essential.
- Public Status Page (Essential): I evaluate whether the hosted page updates in real time across multiple components with clear visual indicators visitors can parse at a glance.
- Incident Management (Essential): Structured lifecycle stages matter here—investigating, identified, monitoring, resolved—with timestamped updates subscribers can follow.
- Component Monitoring: I look for the ability to define, group, and independently track services so teams can pinpoint which system is degraded without guessing.
- Subscriber Notifications: Multi-channel delivery across email, SMS, and webhooks is the baseline. I check whether subscribers can self-select which components they follow.
- Uptime History and Metrics: Historical uptime percentages and incident timelines help stakeholders assess reliability trends over weeks or months, not just current state.
- Customization and Branding: Custom domains, color theming, and logo placement all factor in. Your status page should look like your product, not a third-party tool.
Once I have a list of tools that meet the criteria, I consider what sets each platform apart.
Differentiating Factors (What Sets Vendors Apart)
Here's how I compare and contrast different vendors:
Standout Features
Monitoring tool integrations are the first thing I check. Native connectors to tools like Datadog, PagerDuty, or New Relic let status pages update automatically when an alert fires, so your team isn't copying incident details by hand at 2 a.m. I also evaluate status page automation alongside maintenance scheduling. Automated incident triggers paired with pre-announced maintenance windows mean stakeholders see real-time transitions without anyone drafting a manual post mid-outage. Finally, I look at embeddable widgets and API access, which let you surface live status directly inside your product's UI or internal dashboards.
Beyond Features
I evaluate how easily non-technical stakeholders can adopt the tool. If your support or marketing team can't post an incident update without filing an engineering ticket, adoption stalls fast. I also check whether the vendor publishes its own uptime history—a status page provider that hides its own incidents is a red flag. Finally, I look at data export options, since teams often need to pull uptime and SLA metrics into quarterly business reviews or compliance audits.
Durum Panosu Yazılımı Nasıl Seçilir?
Uzun özellik listeleri ve karmaşık fiyatlandırma yapılarına kendinizi kaptırmanız kolaydır. Kendinize özgü yazılım seçimi sürecinizi yürütürken odağınızı korumanıza yardımcı olmak için aklınızda bulundurmanız gereken faktörleri içeren bir kontrol listesi hazırladım:
| Faktör | Dikkate Alınması Gerekenler |
|---|---|
| FaktörÖlçeklenebilirlik | Dikkate Alınması GerekenlerYazılımın işletmenizle birlikte büyüyüp büyüyemeyeceğini değerlendirin. Kullanıcı sınırlarını ve veri kapasitesini göz önünde bulundurun. Bir araç, ekibinizin hem şu anki hem de gelecekteki büyüklüğünü desteklemelidir. |
| FaktörEntegrasyonlar | Dikkate Alınması GerekenlerMevcut araçlarınızla uyumluluğu kontrol edin. Yazılımın Slack, Jira ve güvendiğiniz diğer platformlara sorunsuz şekilde bağlanabildiğinden emin olun. |
| FaktörÖzelleştirilebilirlik | Dikkate Alınması GerekenlerYazılımı ihtiyaçlarınıza ne ölçüde uyarlayabileceğinizi belirleyin. Panoları, uyarıları ve bildirimleri iş akışınıza uyacak şekilde düzenleme seçenekleri arayın. |
| FaktörKullanım kolaylığı | Dikkate Alınması GerekenlerKullanıcı arayüzünü değerlendirin. Eğitim süresini azaltmak ve benimsenmeyi artırmak için arayüzün tüm ekip üyeleri açısından sezgisel olduğundan emin olun. |
| FaktörUygulama ve işe alıştırma | Dikkate Alınması GerekenlerGereken kurulum süresini ve kaynakları göz önünde bulundurun. Aksaklıkları en aza indirmek için anlaşılır kılavuzlar, destek ve hızlı kurulum sunan araçları tercih edin. |
| FaktörMaliyet | Dikkate Alınması GerekenlerFiyatlandırma modellerini ve bunlara nelerin dahil olduğunu karşılaştırın. Bütçenize uygun olduğundan ve ihtiyaç duyduğunuz özellikler için değer sunduğundan emin olun. Gizli ücretlere dikkat edin. |
| FaktörGüvenlik önlemleri | Dikkate Alınması GerekenlerVeri koruma önlemlerini doğrulayın. Bilgilerinizi korumak için şifreleme, sektör standartlarına uygunluk ve düzenli güvenlik güncellemeleri sunan araçları arayın. |
| FaktörDestek erişilebilirliği | Dikkate Alınması GerekenlerSunulan destek düzeyini kontrol edin. Zamanında yardım alabilmek için erişilebilirliği, yanıt sürelerini ve sohbet, telefon ve e-posta gibi destek kanallarını göz önünde bulundurun. |
Durum Panosu Yazılımı Nedir?
Durum panosu yazılımı, sistemlerin ve hizmetlerin gerçek zamanlı durumunu basit bir panoda gösteren bir araçtır. BT çalışanları, destek ekipleri ve DevOps mühendisleri, işlerin çalışıp çalışmadığını takip etmek ve bir şeyler ters gittiğinde kullanıcılara hızlı güncellemeler paylaşmak için bunu kullanır. Sorunları hızlıca fark etmenize, herkesi gelişmelerden haberdar etmenize ve sorunlar kontrolden çıkmadan önce müdahale etmenize yardımcı olur.
Özellikler
Durum panosu yazılımı seçerken aşağıdaki temel özelliklere dikkat edin:
- Gerçek zamanlı izleme: Sistem durumu hakkında anında güncellemeler sağlayarak sorunların hızlıca tespit edilmesine ve bunlara yanıt verilmesine olanak tanır.
- Özelleştirilebilir uyarılar: İhtiyaçlarınıza göre uyarlanmış bildirimler oluşturmanıza olanak tanıyarak ekibinizin kritik olaylardan haberdar olmasını sağlar.
- Entegrasyon olanakları: İş akışlarını kolaylaştırmak ve iletişimi geliştirmek için Slack ve Jira gibi mevcut araçlara bağlanır.
- Geçmiş verilerin analizi: Geçmiş olaylar hakkında içgörüler sunarak kalıpların belirlenmesine ve gelecekteki sorunların önlenmesine yardımcı olur.
- Kullanıcı dostu arayüz: Kullanım kolaylığı sağlayarak eğitim süresini azaltır ve ekibin benimsemesini teşvik eder.
- Marka özelleştirmesi: Durum sayfasını şirketinizin kimliğiyle uyumlu hâle getirmenize olanak tanıyarak kullanıcı güvenini ve tanınırlığını artırır.
- Çok kanallı iletişim: Çeşitli platformlarda güncellemeleri destekleyerek tüm paydaşların nerede olurlarsa olsunlar bilgilendirilmesini sağlar.
- Otomatik olay raporlama: Belgeleme sürecini basitleştirerek zaman kazandırır ve iletişimde tutarlılık sağlar.
- Güvenlik özellikleri: Şifreleme ve uyumluluk önlemleriyle verileri koruyarak bilgilerinizi yetkisiz erişime karşı güvence altına alır.
Avantajlar
Durum panosu yazılımını uygulamak ekibiniz ve işletmeniz için çeşitli avantajlar sağlar. Yararlanabileceğiniz avantajlardan bazıları şunlardır:
- Geliştirilmiş olay yanıtı: Gerçek zamanlı izleme ve uyarılar, ekibinizin sorunlara hızlıca tepki vermesine yardımcı olarak kesinti süresini en aza indirir.
- Geliştirilmiş iletişim: Çok kanallı güncellemeler, tüm paydaşların zamanında bilgi almasını sağlayarak olaylar sırasında yaşanan karmaşayı azaltır.
- Veriye dayalı içgörüler: Geçmiş verilerin analizi, eğilimleri fark etmenize ve olası sorunları proaktif bir şekilde ele almanıza olanak tanır.
- Artırılmış şeffaflık: Özelleştirilebilir durum sayfaları kullanıcıları bilgilendirerek güven oluşturur ve destek taleplerini azaltır.
- Marka tutarlılığı: Marka özelleştirmesi, durum güncellemelerini şirket kimliğinizle uyumlu hâle getirerek profesyonel imajınızı güçlendirir.
- Verimli belgeleme: Otomatik olay raporlama zaman kazandırır ve olaylar sırasında ve sonrasında iletişimde tutarlılık sağlar.
Maliyetler ve Fiyatlandırma
Durum panosu yazılımını seçmek, mevcut çeşitli fiyatlandırma modellerinin ve planların anlaşılmasını gerektirir. Maliyetler özelliklere, ekip büyüklüğüne, eklentilere ve diğer unsurlara göre değişir. Aşağıdaki tablo, durum panosu yazılımı çözümlerindeki yaygın planları, ortalama fiyatlarını ve genellikle sunulan özellikleri özetlemektedir:
Durum Panosu Yazılımı İçin Plan Karşılaştırma Tablosu
| Plan Türü | Ortalama Fiyat | Yaygın Özellikler |
|---|---|---|
| Plan TürüÜcretsiz Plan | Ortalama Fiyat$0 | Yaygın ÖzelliklerTemel izleme, sınırlı uyarılar ve temel entegrasyonlar. |
| Plan TürüKişisel Plan | Ortalama Fiyat$5-$25/kullanıcı/ay | Yaygın ÖzelliklerGerçek zamanlı izleme, özelleştirilebilir uyarılar ve marka seçenekleri. |
| Plan Türüİşletme Planı | Ortalama Fiyat$30-$75/kullanıcı/ay | Yaygın ÖzelliklerGelişmiş analizler, çok kanallı iletişim ve gelişmiş güvenlik özellikleri. |
| Plan TürüKurumsal Plan | Ortalama Fiyat$100-$200/kullanıcı/ay | Yaygın ÖzelliklerKapsamlı raporlama, özel destek ve tam entegrasyon olanakları. |
Durum Gösterge Paneli Yazılımı Hakkında SSS
Durum gösterge paneli yazılımıyla ilgili sık sorulan bazı soruların yanıtları:
Kesintiler sırasında durum güncellemelerimin tutarlılığını nasıl koruyabilirim?
Güncellemeleri kimin ve ne zaman paylaşabileceği konusunda net bir süreç belirlemek yardımcı olur. Ekibinizin her mesajda aynı üslubu, biçimi ve ayrıntı düzeyini kullanmasını sağlayın. Bu, kesintiler veya bakım etkinlikleri sırasında hem kullanıcıların hem de ekip arkadaşlarının kafasının karışmasını önler ve herkesin aynı doğrultuda ilerlemesini sağlar.
Kesinti sırasında durum sayfamı ne sıklıkla güncellemeliyim?
Bir sorun doğrulanır doğrulanmaz paylaşım yapmalı, ardından sorun çözülene kadar düzenli olarak güncellemeler yayınlamalısınız. Önemli bir ilerleme olmasa bile kısa bilgilendirmeler, kullanıcılara ekibinizin sorun üzerinde hâlâ çalıştığı konusunda güvence verir. Sorun düzeltildikten sonra, ne yapıldığını ve hizmetlerin ne zaman normale döndüğünü açıklayan bir kapanış notu ekleyin.
Ekibim büyük olaylar sırasında iletişimi nasıl yönetebilir?
Bir olay gerçekleşmeden önce net roller belirleyin: bir kişi güncellemeleri paylaşmalı, başka biri kullanıcı sorularıyla ilgilenmeli ve bir diğeri teknik müdahaleyi koordine etmelidir. Bu sorumlulukları birbirinden ayırmak gecikmeleri ve çelişkili mesajları önler. Önceden belirlenmiş bir iletişim takvimi de olay boyunca tutarlılığın korunmasına yardımcı olur.
Birden çok hizmeti tek bir gösterge panelinde düzenlemenin en iyi yolu nedir?
İlgili sistemleri net kategoriler altında gruplayın ve kısa, açıklayıcı adlar kullanın. Bu, izleyicilerin uzun bir listeyi taramak zorunda kalmadan etkilenen hizmeti hızlıca bulmasına yardımcı olur. Yapıyı basit tutmak, acil durumlarda gösterge panelinin okunmasını ve güncellenmesini kolaylaştırır.
Tekrarlanan kesintilerden sonra güveni nasıl koruyabilirim?
Şeffaflık çok önemlidir. Sorunları her zaman hızlıca kabul edin, dürüst durum ayrıntıları verin ve çözüm zaman çizelgelerini net bir şekilde paylaşın. Öngörülebilir bir güncelleme düzenini takip ettiğinizde, kesinti yeniden yaşansa bile kullanıcılar raporlama sürecinize güvenmeye başlar.