

Ao navegar pelo mundo acelerado da gestão de produtos, enfrenta desafios constantes. Conciliar dados, tendências de mercado e exigências dos consumidores pode ser uma tarefa avassaladora. O software de análise automatizada de tendências está aqui para ajudar. Permite-lhe poupar tempo e fornece informações que o ajudam a tomar decisões fundamentadas.
Com base na minha experiência, estas ferramentas podem transformar o seu fluxo de trabalho, permitindo-lhe concentrar-se no seu produto e na sua equipa. Testei e analisei várias soluções de software para lhe apresentar uma lista imparcial das melhores opções disponíveis.
Neste artigo, descobrirá como cada ferramenta pode responder às suas necessidades específicas, desde a visualização de dados até aos alertas em tempo real. Vamos explorar as melhores opções, que podem aliviar a sua carga de trabalho e melhorar o seu processo de tomada de decisões.
Why Trust Our Software Recommendations
6,700+
Reviews
20
Industry experts
16+
Evaluation factors
14
Years
Our team has been testing and reviewing software since 2012. As product managers ourselves, we know how difficult—and important—it is to choose the right software.
For this guide, we evaluated tools using hands-on testing and independent research, scoring tools using our selection criteria.
Our reviews reflect our human editorial judgment, not a sales pitch.
Expert reviewers:
- Andrew LumbySenior TPM
- Cristiano ValimSenior UI/UX Lead


Tabela comparativa de software de análise automatizada de tendências
A tabela abaixo compara os detalhes dos preços das minhas principais escolhas de software de análise automatizada de tendências.
| Tool | Best For | Trial Info | Price | ||
|---|---|---|---|---|---|
| 1 | Best for AI-powered associative data indexing | 30-day free trial | From $300/month (billed annually) | Website | |
| 2 | Best for AI chat across enterprise data | 30-day free trial | Pricing upon request | Website | |
| 3 | Best for root-cause trend explainability | 7-day free trial | Pricing upon request | Website | |
| 4 | Best for operational metric anomaly detection | Free demo available | Pricing upon request | Website | |
| 5 | Best for planning and forecasting in one place | Free demo available | Pricing upon request | Website | |
| 6 | Best for external signal trend intelligence | Free demo available | Pricing upon request | Website | |
| 7 | Best for AI-driven enterprise forecasting at scale | 14-day free trial | Pricing upon request | Website | |
| 8 | Best for consumer trend root-cause analysis | Free demo available | Pricing upon request | Website | |
| 9 | Best for media spike root-cause analysis | Free demo available | From $10,000/year (billed annually) | Website | |
| 10 | Best for public conversation trend intelligence | Free demo available | Pricing upon request | Website |


Análise do melhor software de análise automatizada de tendências
Abaixo encontra os meus resumos detalhados do melhor software de análise automatizada de tendências que entrou na minha seleção. As minhas análises apresentam uma visão detalhada das principais funcionalidades, vantagens e desvantagens, integrações e casos de utilização ideais de cada ferramenta, ajudando-o a encontrar a melhor opção para si.
 1Best for AI-powered associative data indexing
Qlik
- 30-day free trial
- From $300/month (billed annually)
Visit WebsiteCustomer Rating:4.4/5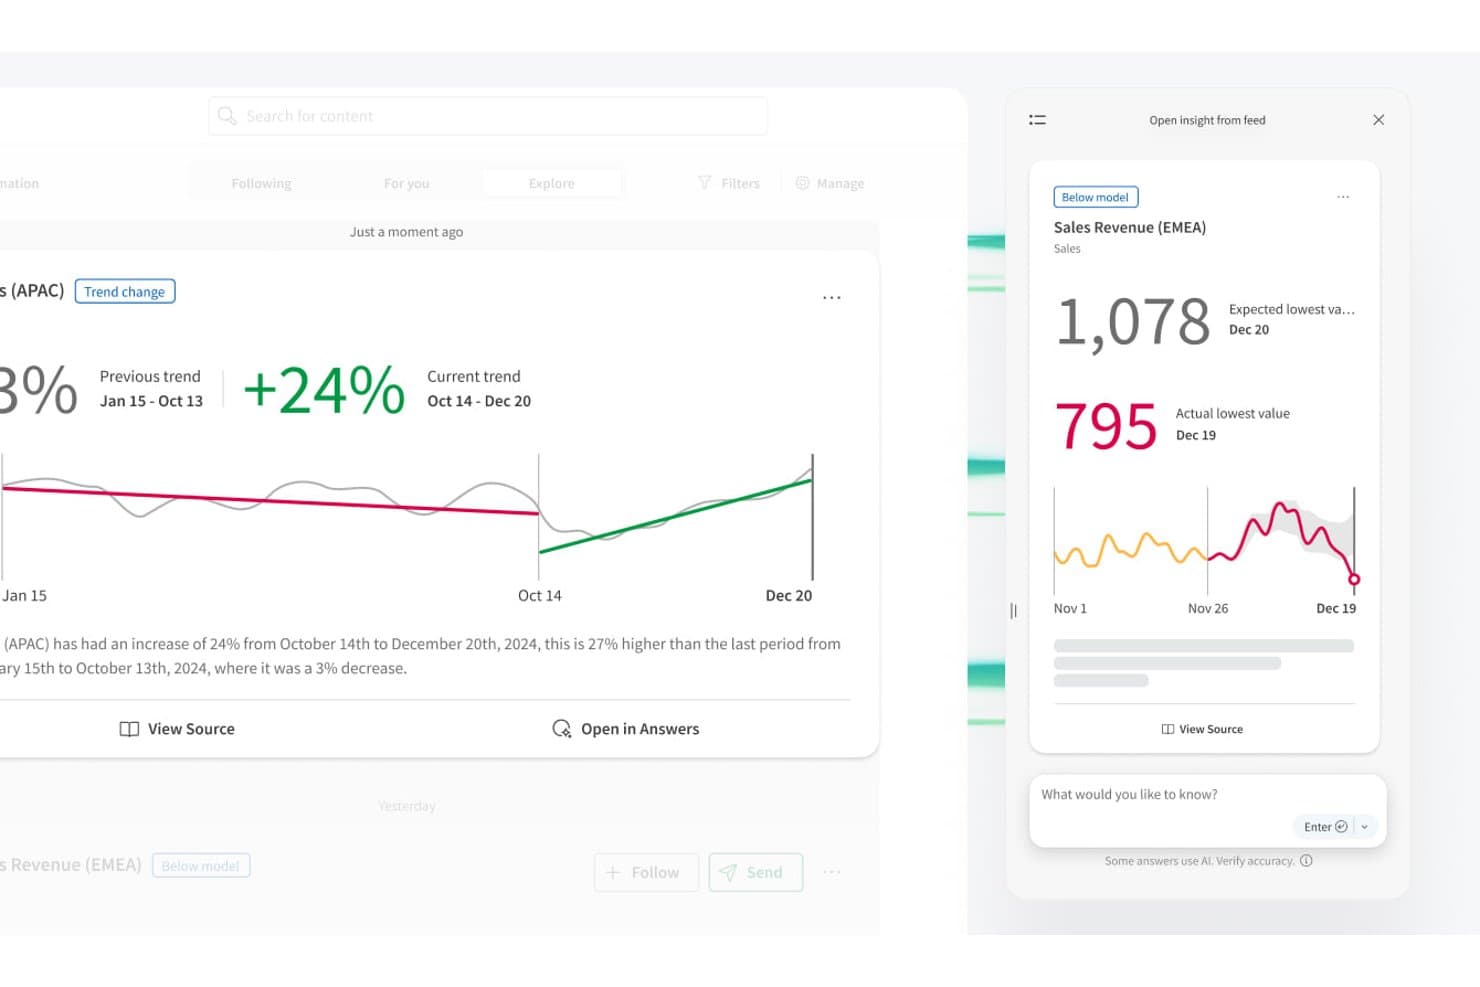
Qlik automatically detects trend changes and flags below-model anomalies. Qlik is a cloud analytics platform that combines an associative data engine, AI-powered anomaly detection, no-code AutoML forecasting, and multi-source data aggregation to surface patterns and trend shifts across your data.
Who Is Qlik Best For?
Qlik is a strong fit for BI analysts and data managers at mid-to-large organizations who need to explore relationships across complex, multi-source datasets.
Why I Picked Qlik
Qlik earns its spot on my shortlist because its associative engine approaches trend detection differently from every other tool here. Instead of querying one metric at a time, it indexes relationships across your entire dataset simultaneously, so you can spot correlations and blind spots that linear queries simply won't surface. I also love that the Discovery Agent delivers threshold-free anomaly detection, flagging trend shifts and baseline changes in plain language without requiring you to write a single alert rule.
Qlik Key Features
- Key Driver Analysis: An AutoML-powered feature that ranks which variables are influencing a target metric and explains what's driving shifts in your data.
- Qlik Automate: A no-code workflow builder that triggers actions in connected tools like Slack, Salesforce, and Microsoft Teams when data conditions are met.
- Multivariate time-series forecasting: Qlik Predict trains models that detect seasonality and trend patterns across multiple variables simultaneously, with no code required.
- Direct Query: Queries live data from sources like Snowflake and Databricks without loading it into memory, enabling near-real-time analysis.
Qlik Integrations
Qlik offers hundreds of integrations, including Salesforce, Slack, Microsoft Teams, GitHub, Snowflake, Databricks, Google BigQuery, SAP, and SharePoint. APIs and SDKs support custom connections, while Direct Query connects live cloud data sources.
Pros and Cons
Pros:
- Multivariate forecasting explains trend drivers
- Threshold-free anomaly detection reduces alert maintenance
- Associative indexing reveals hidden data relationships
Cons:
- Proprietary scripting slows team adoption
- Trend insights typically wait for reloads
Learn more about Qlik: 2Best for AI chat across enterprise data
Domo
- 30-day free trial
- Pricing upon request
Visit WebsiteCustomer Rating:4.4/5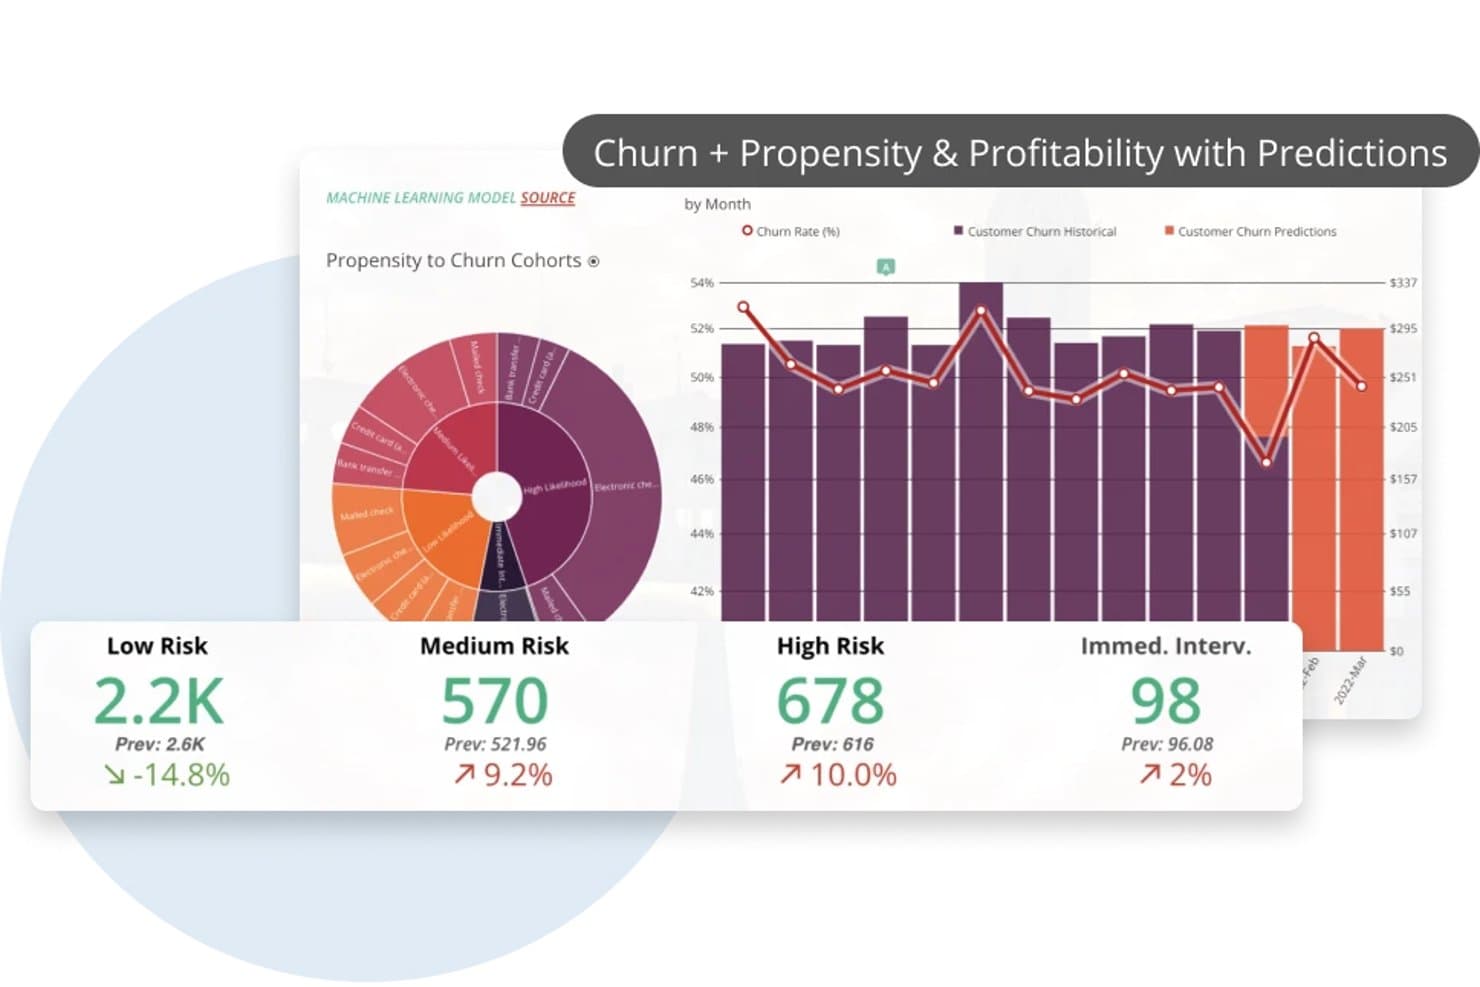
Domo predicts customer churn risk using ML-powered trend analysis. Domo is an enterprise BI and analytics platform that combines data ingestion from 1,000+ sources, no-code transformation, AI-powered natural language querying, forecasting, and automated anomaly detection.
Who Is Domo Best For?
Domo is a strong fit for enterprise BI analysts and data managers who need to query, visualize, and monitor data across dozens of sources from a single platform.
Why I Picked Domo
I picked Domo as one of the best because its AI Chat v2 lets you ask multi-part questions across several enterprise datasets in plain language and get charts or cards back instantly. I love that you can interrogate live-queried data from Snowflake, BigQuery, or Redshift without moving it first. Pair that with configurable anomaly alerts that trigger on any calculated metric, and your team catches shifts in the data before they become problems.
Domo Key Features
- Forecasting Universal Model: Adds configurable forecasts with confidence intervals to line or bar charts, letting you set seasonality and forecast period directly in App Studio.
- Magic ETL data science tiles: Includes multivariate outlier detection and sentiment analysis tiles you can build into your data pipelines without writing code.
- Configurable metric alerts: Lets you set rule-based alerts on any calculated metric, with conditions like threshold breaches or percentage changes, triggered on every data update or on a schedule.
- Scenario simulation variables: Adds interactive what-if variables to dashboards so you can model different inputs and see how outcomes shift in real time.
Domo Integrations
Domo offers 1,000+ pre-built connectors, including Salesforce, Google Analytics, Snowflake, BigQuery, Databricks, and Redshift. It also supports custom integrations through APIs, Java and Python SDKs, webhooks, Connector Dev IDE, Domo Workbench, and SFTP.
Pros and Cons
Pros:
- Alerts monitor calculated metric changes
- Forecasts include configurable confidence intervals
- AI chat answers multi-part data questions
Cons:
- Forecasting needs manual seasonality configuration
- Anomaly detection requires assembling separate components
Learn more about Domo: Best for root-cause trend explainability
- 7-day free trial
- Pricing upon request
Visit WebsiteCustomer Rating:4.4/5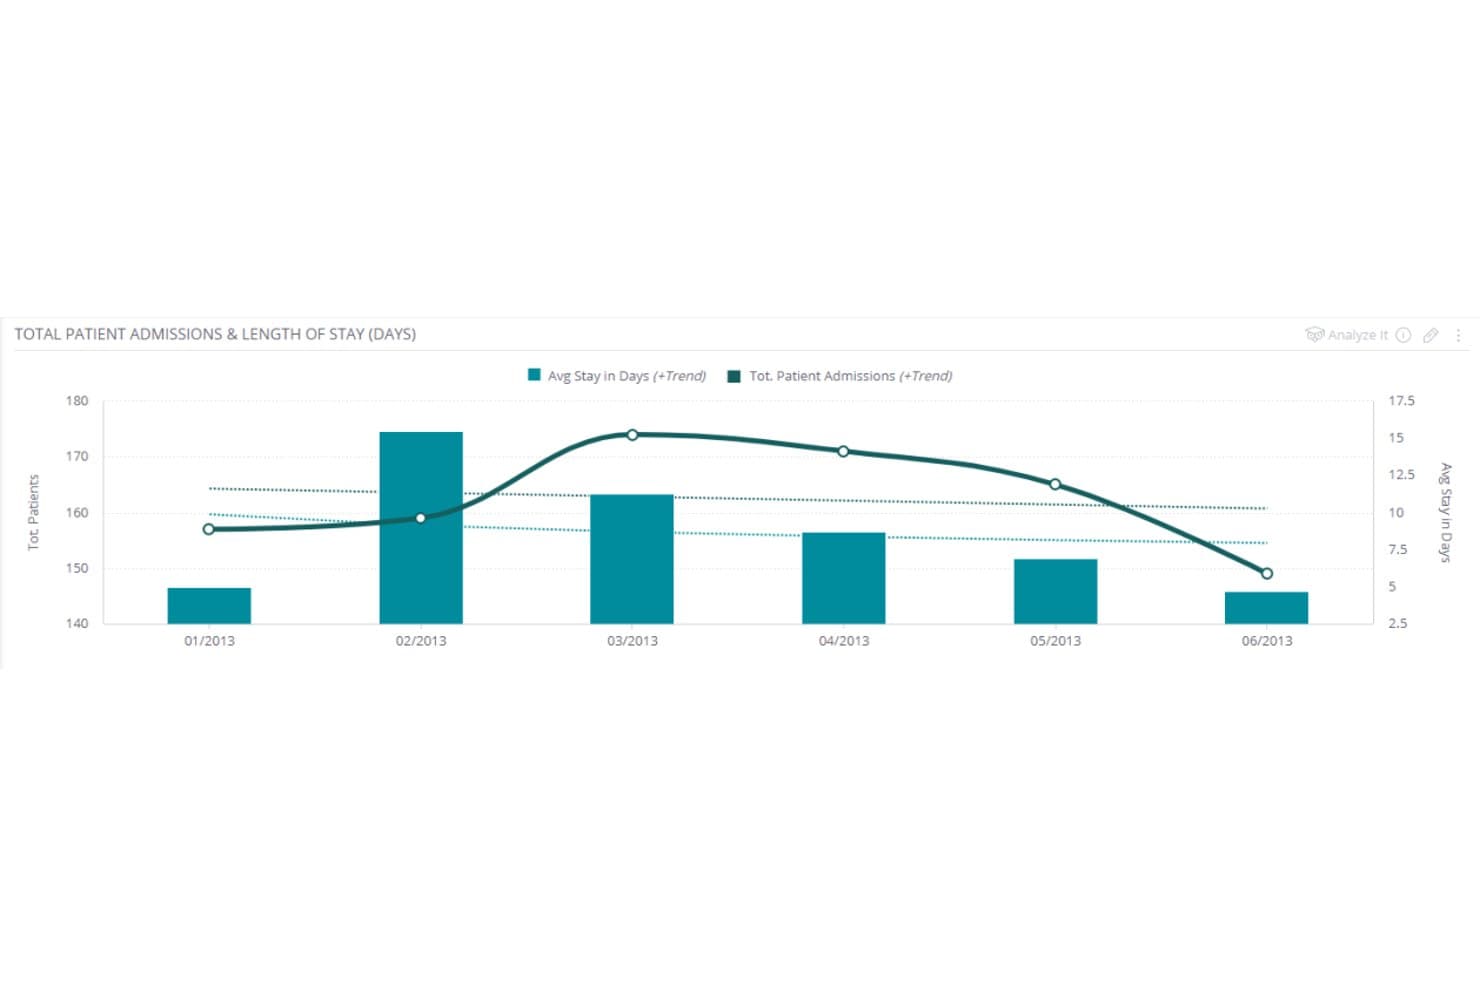
Sisense overlays trend lines on bar charts to reveal patient admission patterns. Sisense is an embedded analytics and BI platform that combines AI-driven trend analysis, automated anomaly detection, multi-source data aggregation, predictive forecasting, and natural language querying to surface patterns across structured datasets.
Who Is Sisense Best For?
Sisense is a strong fit for BI analysts and product managers who need to explain the "why" behind metric shifts, not just see them.
Why I Picked Sisense
I picked Sisense as one of the best because its Explanations feature does something I haven't seen done as thoroughly elsewhere: it automatically ranks hundreds of contributing factors behind a KPI shift, showing you not just that revenue dropped, but which customer segments, regions, or product lines drove it. Pair that with ensemble forecasting (ARIMA, Prophet, CatBoost, and more working together) and you get a platform that connects the "what happened" to the "what's likely next" without jumping between tools.
Sisense Key Features
- Pulse monitoring: Set plain-language conditions through the AI Assistant to watch for threshold crossings, ranking changes, or anomalies, and get alerts via Slack, email, or webhook.
- Multi-source data blending: Connect 200+ data sources through live connections, ElastiCube consolidation, or a hybrid model to build a unified analytical dataset.
- Natural language querying: Ask questions in plain language using the AI Assistant or Simply Ask to get direct numeric answers, deltas, and trend summaries without building a chart.
- Multivariate forecasting: Add an explaining variable to forecasts using CatBoost, ElasticNet, and Random Forest models, with a relationship score showing how strongly variables connect.
Sisense Integrations
Sisense documents 200+ data connectors, including Snowflake, Amazon Redshift, Google BigQuery, and Azure Synapse. It also offers REST APIs, the Compose SDK, and Zapier for custom and workflow integrations.
Pros and Cons
Pros:
- Connects dashboards to governed natural-language analysis
- Combines ensemble forecasting with anomaly detection
- Ranks hundreds of potential KPI drivers
Cons:
- Large datasets may slow dashboard refreshes
- Data modeling can delay initial deployment
Learn more about Sisense: Best for operational metric anomaly detection
- Free demo available
- Pricing upon request
Visit WebsiteCustomer Rating:4.5/5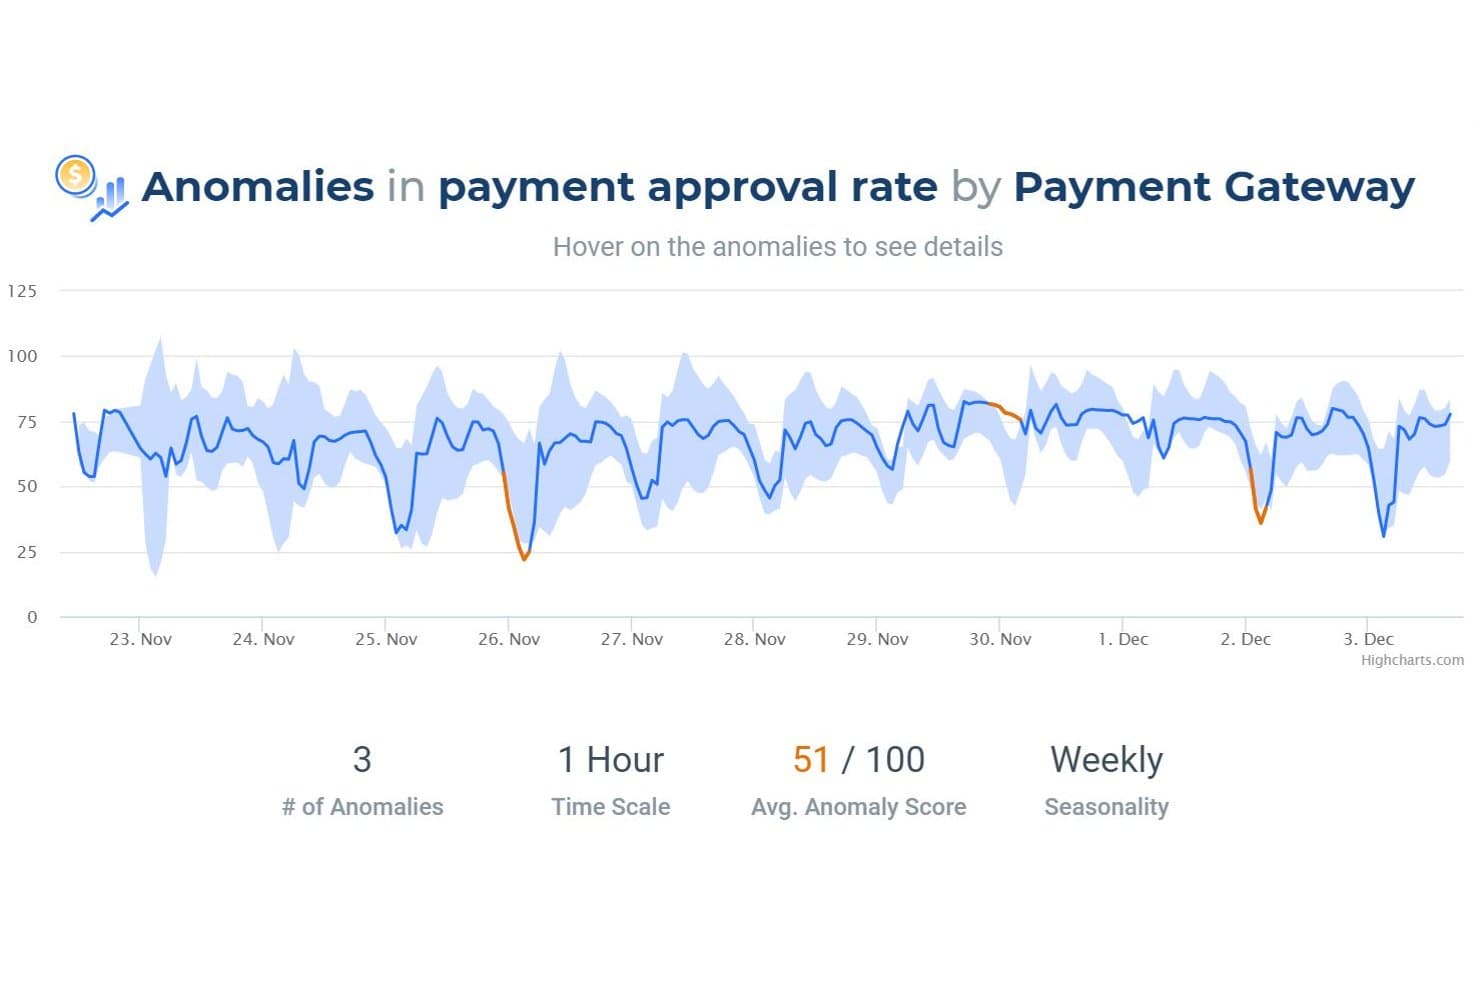
Anodot detects payment approval rate anomalies with scoring and seasonality. Anodot is a business monitoring platform that uses unsupervised machine learning to detect anomalies, correlate incidents, and forecast trends across structured operational and time-series metrics.
Who Is Anodot Best For?
Anodot is a strong fit for engineering, payments, and operations teams at mid-to-large companies that need to monitor high-volume time-series metrics and get alerted to anomalies before they become costly incidents.
Why I Picked Anodot
I picked Anodot as one of the best because its patented Deep 360 Monitoring engine detects anomalies across operational metrics without any manual threshold configuration. I love how it groups correlated anomalies into single, scored incidents and surfaces leading dimensions like geography, payment gateway, or customer segment to show exactly where a metric broke down. Its Autonomous Forecast layer automatically builds and retrains models using real-time data streams, so my team can spot emerging metric trends before they become incidents.
Anodot Key Features
- Influencing event tagging: Add known events like product launches, holidays, or promotions so the system excludes expected changes from anomaly detection.
- Alert Console: Manage all anomaly alerts in one interface, with assignees, alert types, and custom "Alert Actions" that trigger automated responses or investigations.
- Autonomous Forecast model library: The system selects, trains, and retrains forecasting models from a built-in library using deep learning, without any manual model configuration.
- External factor inputs: Connect outside data like weather forecasts or event schedules to your forecasting models to improve prediction accuracy.
Anodot Integrations
Anodot offers documented integrations with Snowflake, Databricks, Google BigQuery, Apache Kafka, Amazon Kinesis, Azure Event Hubs, Google Analytics, Adobe Analytics, Mixpanel, and Power BI. It also provides a REST API and Python SDK for custom integrations.
Pros and Cons
Pros:
- Surfaces root causes through metric dimensions
- Groups related shifts into scored incidents
- Detects anomalies without manual thresholds
Cons:
- Alerts can overwhelm without careful tuning
- Visualization feels dated for stakeholder storytelling
Learn more about Anodot: Best for planning and forecasting in one place
- Free demo available
- Pricing upon request
Visit WebsiteCustomer Rating:4.3/5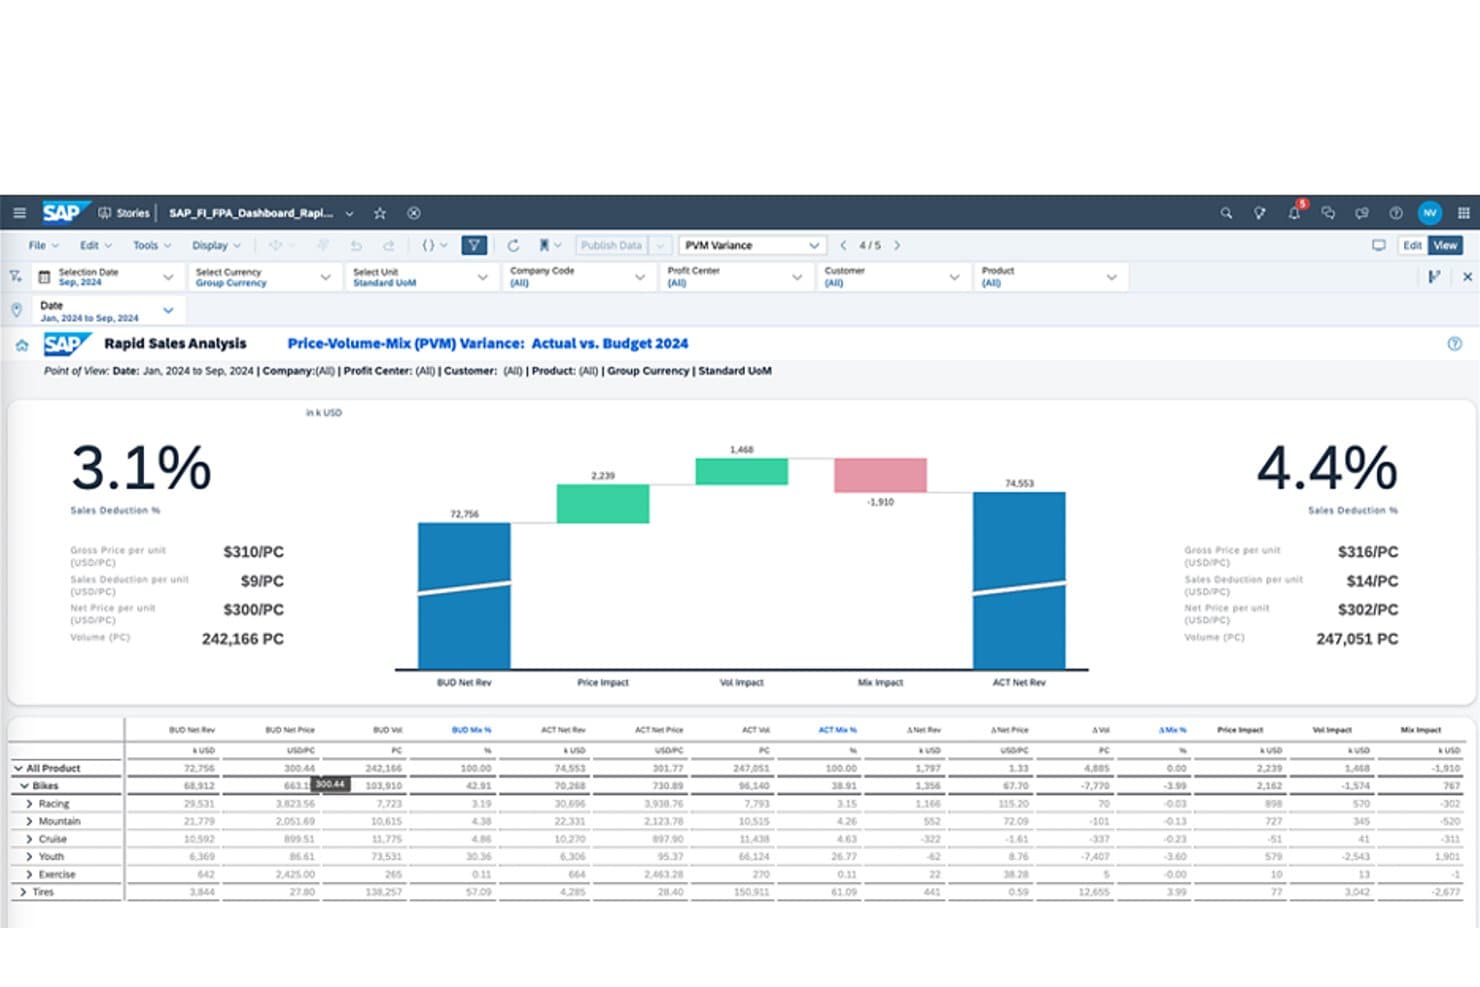
SAP Analytics Cloud visualizes budget vs. actual variance with PVM analysis. SAP Analytics Cloud is an enterprise analytics platform that combines BI, predictive forecasting, and planning, using automated ML models, Smart Insights, and live data connections to surface patterns and trends across your data.
Who Is SAP Analytics Cloud Best For?
SAP Analytics Cloud is a strong fit for enterprise BI analysts and finance teams already working within the SAP ecosystem who need forecasting and planning in one place.
Why I Picked SAP Analytics Cloud
I picked SAP Analytics Cloud because it's one of the few tools that keeps planning and forecasting in the same workspace as your BI, so there's no exporting forecasts into a separate planning tool. Smart Predict runs time-series models directly on your data and feeds results into planning models, while Smart Insights breaks down which dimensions are driving a change the moment you flag a data point. That combination makes it genuinely useful when your team needs to move from spotting a trend to acting on it without switching platforms.
SAP Analytics Cloud Key Features
- Smart Insights: Analyzes a selected data point to rank the dimensions driving a variance, with a written explanation and supporting chart.
- Data Change Insights: Monitors charts for significant value changes on a scheduled cadence and sends notifications via email or mobile app.
- Compass simulation: Runs Monte Carlo simulations to model best, worst, and expected outcomes based on your chosen drivers.
- Just Ask: Lets you query your data using plain-language questions and returns charts or tables without writing any code.
SAP Analytics Cloud Integrations
SAP Analytics Cloud has native integrations across the SAP ecosystem, including SAP HANA, S/4HANA, BW/4HANA, and SAP Datasphere, plus Google BigQuery, Snowflake, SQL databases, and OData. APIs support custom integrations.
Pros and Cons
Pros:
- Compass models expected and extreme outcomes
- Smart Insights explains major trend drivers
- Forecasts feed directly into planning models
Cons:
- Smart Insights needs user-selected data points
- Change alerts require scheduled monitoring
Learn more about SAP Analytics Cloud: Best for external signal trend intelligence
- Free demo available
- Pricing upon request
Visit WebsiteCustomer Rating:4.2/5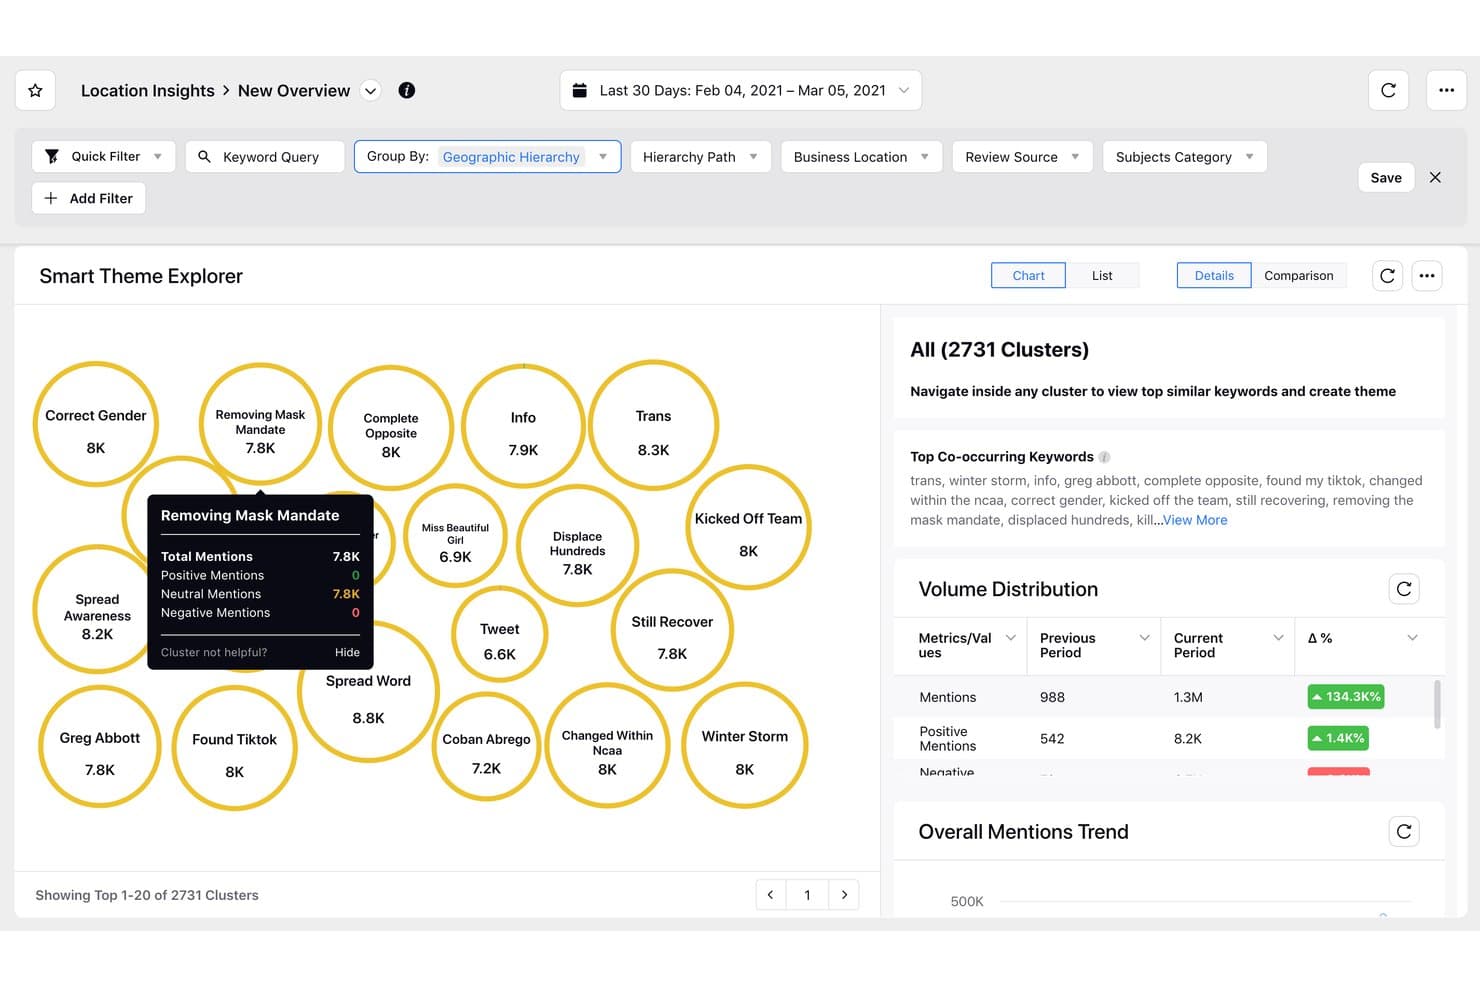
Sprinklr Insights clusters trending topics by mention volume and sentiment. Sprinklr Insights is a consumer and market intelligence platform that monitors social channels, news, reviews, and media sources to surface themes, trends, anomalies, and competitive signals through AI-driven analysis.
Who Is Sprinklr Insights Best For?
Sprinklr Insights is a strong fit for enterprise market researchers and brand intelligence teams that need to monitor and analyze high volumes of external signals across social, news, and review channels.
Why I Picked Sprinklr Insights
I picked Sprinklr Insights because no other tool on this list monitors external signals at quite this scale: 30+ social channels, 400K+ media sources, and 900+ e-commerce review domains, all analyzed by AI that automatically surfaces themes, trends, and anomalies without manual querying. I especially like the Copilot root-cause analysis, which doesn't just flag a spike in negative sentiment but explains what's driving it and suggests next steps.
Sprinklr Insights Key Features
- Smart Alerts with severity scoring: AI-based anomaly alerts cover volume, sentiment, engagement, and star ratings, with a 1–10 severity score to filter noise.
- Trend forecasting: Projects metrics like mentions, engagement, and reach up to 90 days ahead using a mathematical model applied to the last 365 days of daily data.
- Natural-language querying via Copilot: Accepts custom prompts, retains context across questions, and grounds answers in your dashboard data.
- Competitive benchmarking dashboards: Out-of-the-box dashboards compare share of voice, brand awareness, and CSAT against named competitors.
Sprinklr Insights Integrations
Sprinklr Insights offers a marketplace integration with Snowflake and a documented Tableau connection, plus APIs for custom integrations. Sprinklr claims 100+ integrations across marketing, sales, and CRM tools, but doesn’t identify the full set.
Pros and Cons
Pros:
- Tracks social, news, and review signals
- Root-cause analysis explains what drives trends
- AI surfaces anomalies across billions of data points
Cons:
- Onboarding takes considerable time for teams
- Dashboards can become dense and difficult
Learn more about Sprinklr Insights: Best for AI-driven enterprise forecasting at scale
- 14-day free trial
- Pricing upon request
Visit WebsiteCustomer Rating:4.3/5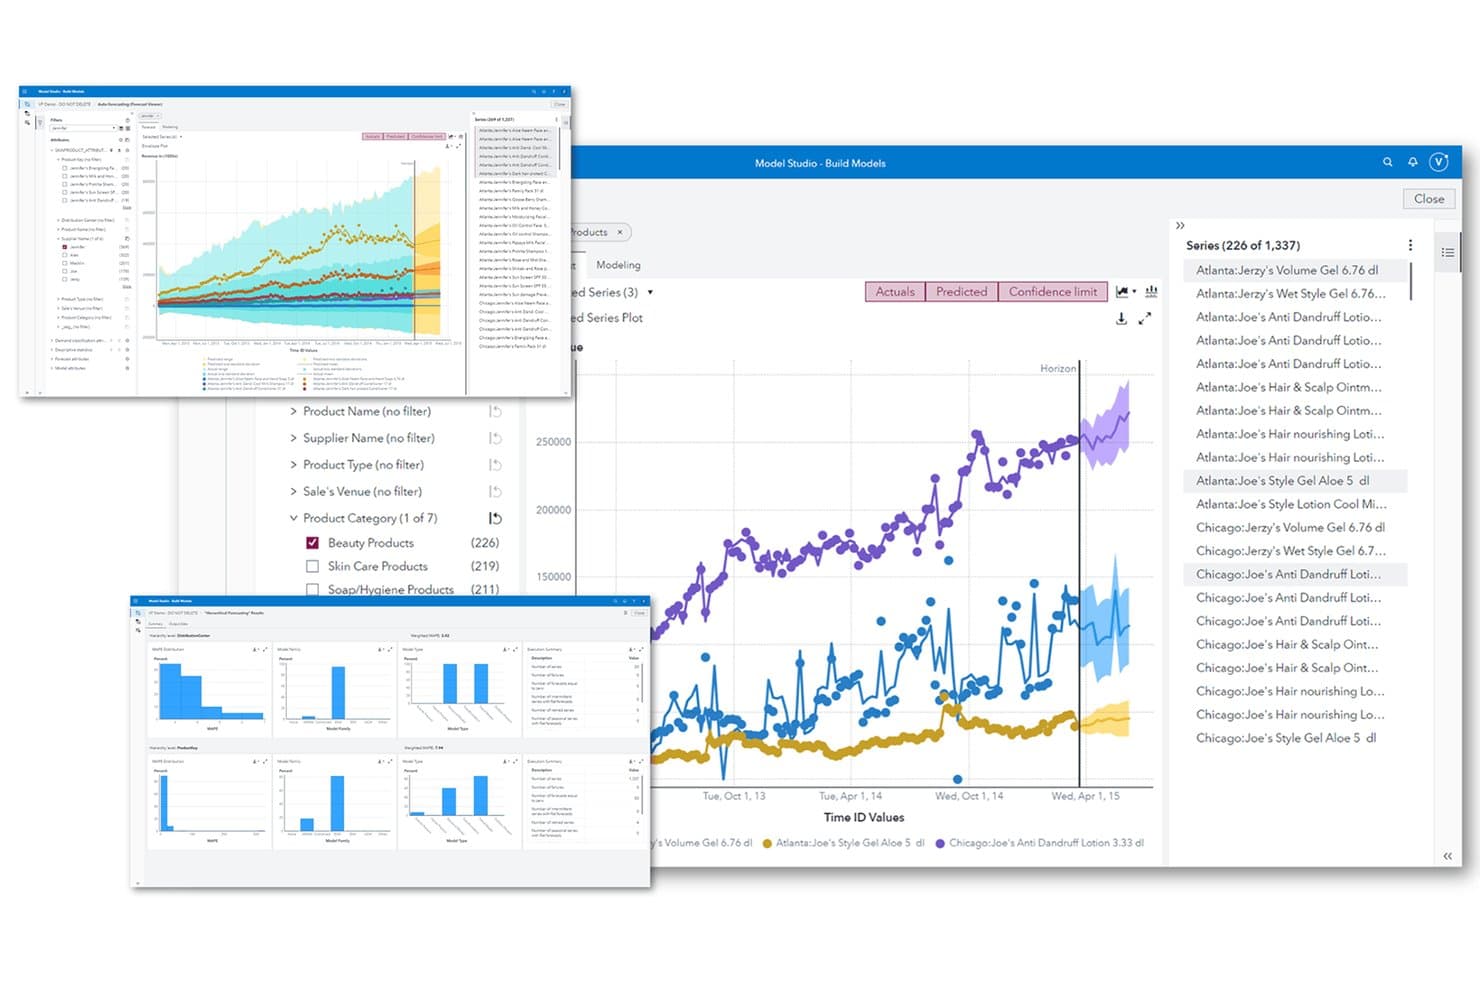
SAS Viya automates trend forecasting across product series and categories. SAS Viya is an enterprise analytics platform that combines automated pattern detection, predictive time-series forecasting, real-time event stream processing, and text analytics for trend analysis across structured and unstructured data.
Who Is SAS Viya Best For?
SAS Viya is a strong fit for data and analytics teams in large enterprises that need AI-driven forecasting, pattern detection, and model governance under one platform.
Why I Picked SAS Viya
SAS Viya earns its spot on my shortlist because its forecasting depth is genuinely hard to match at enterprise scale. I'm particularly impressed by Visual Forecasting's hierarchical modeling, which keeps product-to-category-to-total forecasts consistent automatically, and its per-series ensemble approach, which selects the best-performing model for each individual time series. Add Automated Explanation, which surfaces variable contributions in plain language, and large analytics teams get both predictive accuracy and clear justification for every forecast output.
SAS Viya Key Features
- Visual Text Analytics: Groups unstructured documents into themes automatically using unsupervised machine learning, assigning each document a relevance score per topic.
- Event Stream Processing: Ingests and analyzes streaming data in real time, processing millions of events per second from multiple sources simultaneously.
- SAS Viya Copilot: A conversational AI assistant that builds dashboards, explores data, and generates written data stories from plain-language prompts.
- Model drift detection: Monitors deployed models continuously for data, concept, and model drift, surfacing explanations when performance degrades.
SAS Viya Integrations
SAS Viya connects to 80+ data sources, including Snowflake, Databricks, Amazon Redshift, SQL Server, Oracle, PostgreSQL, and Parquet. It also supports Microsoft 365, AWS, Azure, Google Cloud, REST APIs, and SDKs for Python, R, Java, and Lua.
Pros and Cons
Pros:
- Topic clustering surfaces trends in documents
- Automated explanations reveal forecast drivers
- Hierarchical forecasts maintain consistent totals
Cons:
- Threshold alerts miss subtle trend shifts
- Streaming requires the appropriate Viya edition
Learn more about SAS Viya: Best for consumer trend root-cause analysis
- Free demo available
- Pricing upon request
Visit WebsiteCustomer Rating:4.3/5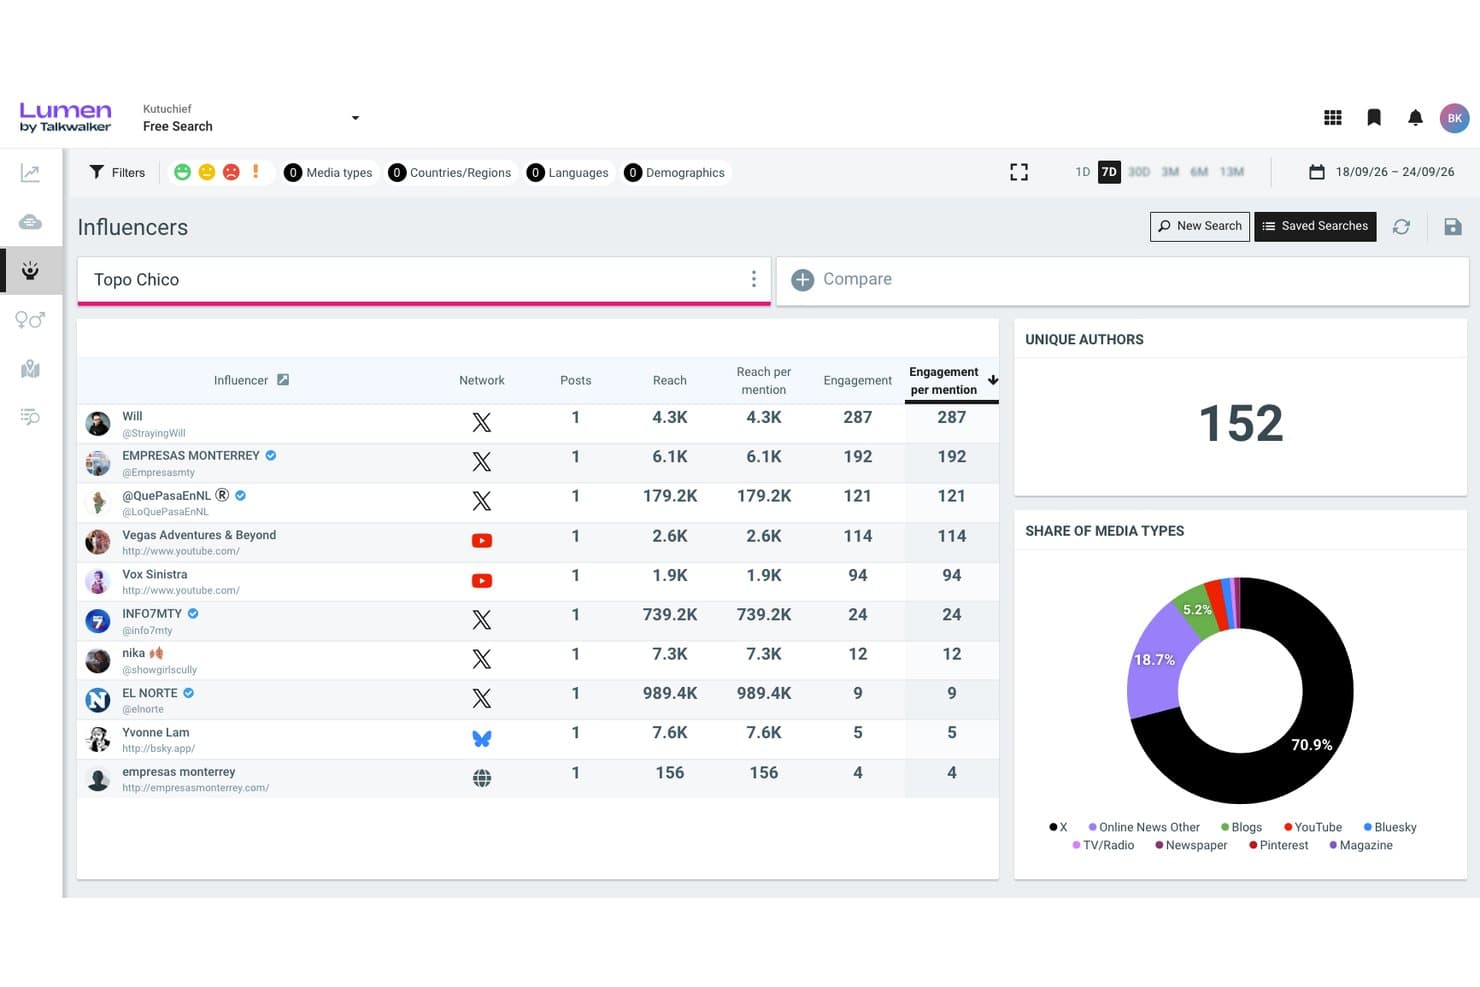
Lumen by Talkwalker ranks influencers by engagement and reach metrics. Lumen by Talkwalker is a social listening and consumer intelligence platform that monitors external data sources—social networks, news, reviews, podcasts, and more—to detect trend patterns, cluster conversation themes, and surface real-time signals through AI-driven analysis and custom dashboards.
Who Is Lumen by Talkwalker Best For?
Lumen by Talkwalker is a strong fit for market researchers and consumer insights teams who need to trace trends back to their root causes across social, news, and review data.
Why I Picked Lumen by Talkwalker
I've included Lumen by Talkwalker in my top picks because it goes beyond spotting trends to actually explaining what's driving them. Its Blue Silk AI clusters conversations by topic and subtopic, traces shifts back to root causes like competitor activity or demographic changes, and flags which signals are gaining real traction. I especially like the Conversation Clusters view, which maps related themes visually so you can see at a glance whether a rising topic is organic or noise.
Lumen by Talkwalker Key Features
- LLM Insights: Tracks how AI assistants like ChatGPT, Gemini, and Claude describe your brand, including mention rate, share of voice, and sentiment across models.
- 90-day predictive modeling: Forecasts topic volumes and KPIs—like hits, reach, and engagement—to show whether a trend is likely to last or fade.
- AI Summaries: Generates scheduled summaries (daily, weekly, or monthly) with a custom focus setting you can align to a specific role, like PR or insights.
- Real-time alerting: Sends notifications across email, Slack, Microsoft Teams, and Google Chat for volume thresholds, sentiment shifts, and viral content detection.
Lumen by Talkwalker Integrations
Talkwalker claims 100+ integrations, including Hootsuite, Google Analytics 360, Tableau, Meta for Business, and X/Twitter. Its Search, Streaming, Export Task, and histogram APIs support custom connections.
Pros and Cons
Pros:
- Visualizes emerging themes through conversation clusters
- Detects shifts across extensive external data
- Traces trends to demographic and competitor causes
Cons:
- Sentiment errors can require manual corrections
- Forecasting stops at a fixed 90-day horizon
Learn more about Lumen by Talkwalker: Best for media spike root-cause analysis
- Free demo available
- From $10,000/year (billed annually)
Visit WebsiteCustomer Rating:4.1/5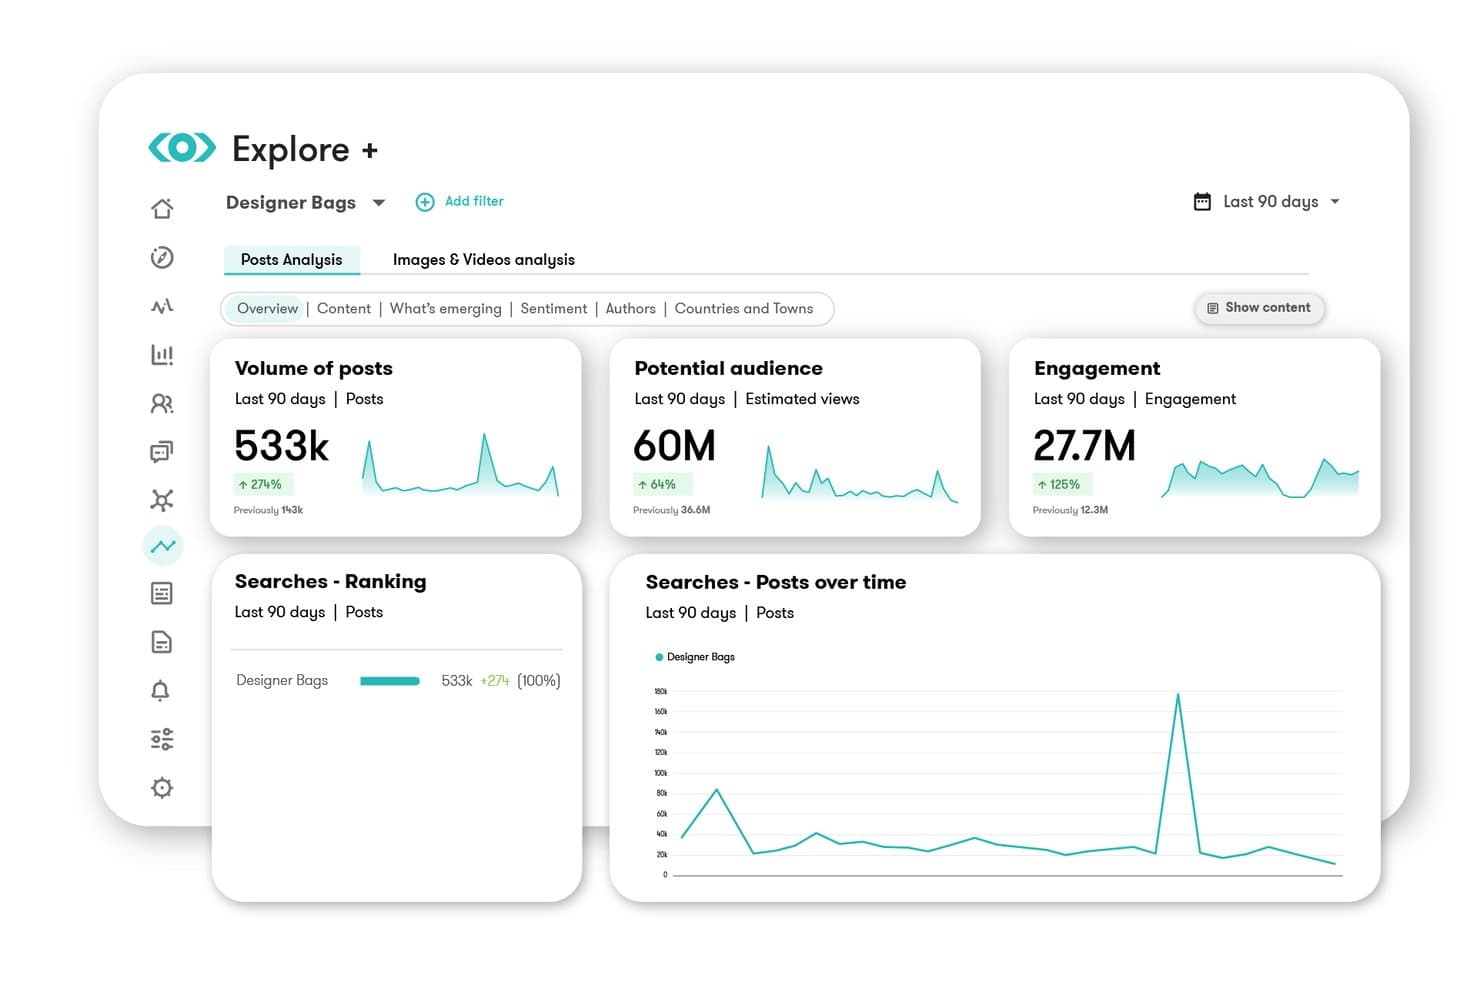
Meltwater tracks post volume, audience reach, and engagement trends over time. Meltwater is a media and social listening platform that monitors news, social networks, broadcast, and AI-generated content to surface emerging trends, detect volume and sentiment spikes, and deliver real-time alerts across your team.
Who Is Meltwater Best For?
Meltwater is a strong fit for PR, communications, and marketing teams that need to monitor external media and social signals at scale and quickly understand what's driving coverage spikes.
Why I Picked Meltwater
I picked Meltwater because its AI Spike Analysis does something I haven't seen matched elsewhere: it doesn't just flag a volume surge, it tells you exactly what caused it, breaking down the spike by source, top hashtags, sentiment, and geography. When mentions jump 500% overnight, that context is what separates a useful alert from a panic. I also like that it monitors over 6 million sources continuously, including Reddit's full data stream and paywalled outlets like the FT and WSJ, so spikes in hard-to-find corners of the web don't slip through.
Meltwater Key Features
- Continuous multi-source monitoring: Ingests over 1.3 billion documents daily from 6 million+ sources, including paywalled outlets, Reddit, TikTok, and broadcast media.
- Mira AI assistant: Answers plain-language questions about your data, builds dashboards automatically, and generates executive briefings with cited sources.
- Multi-channel alerting: Delivers spike and sentiment alerts within 2–5 minutes via Slack, Microsoft Teams, email, SMS, or mobile push.
- Trends Center: Aggregates trending topics from TikTok, X, Instagram, Facebook, Reddit, and news into a single unified view.
Meltwater Integrations
Meltwater has documented integrations with Slack, Microsoft Teams, Microsoft 365, Salesforce, Claude, and ChatGPT. Its standard, Explore+, and Mira APIs, plus MCP server, support custom connections.
Pros and Cons
Pros:
- Alerts arrive within minutes across channels
- Monitors massive external datasets continuously
- Explains spike drivers by source and geography
Cons:
- Export formatting limits downstream analysis
- Boolean queries need trial and error
Learn more about Meltwater: 10Best for public conversation trend intelligence
Pulsar
- Free demo available
- Pricing upon request
Visit WebsiteCustomer Rating:4.3/5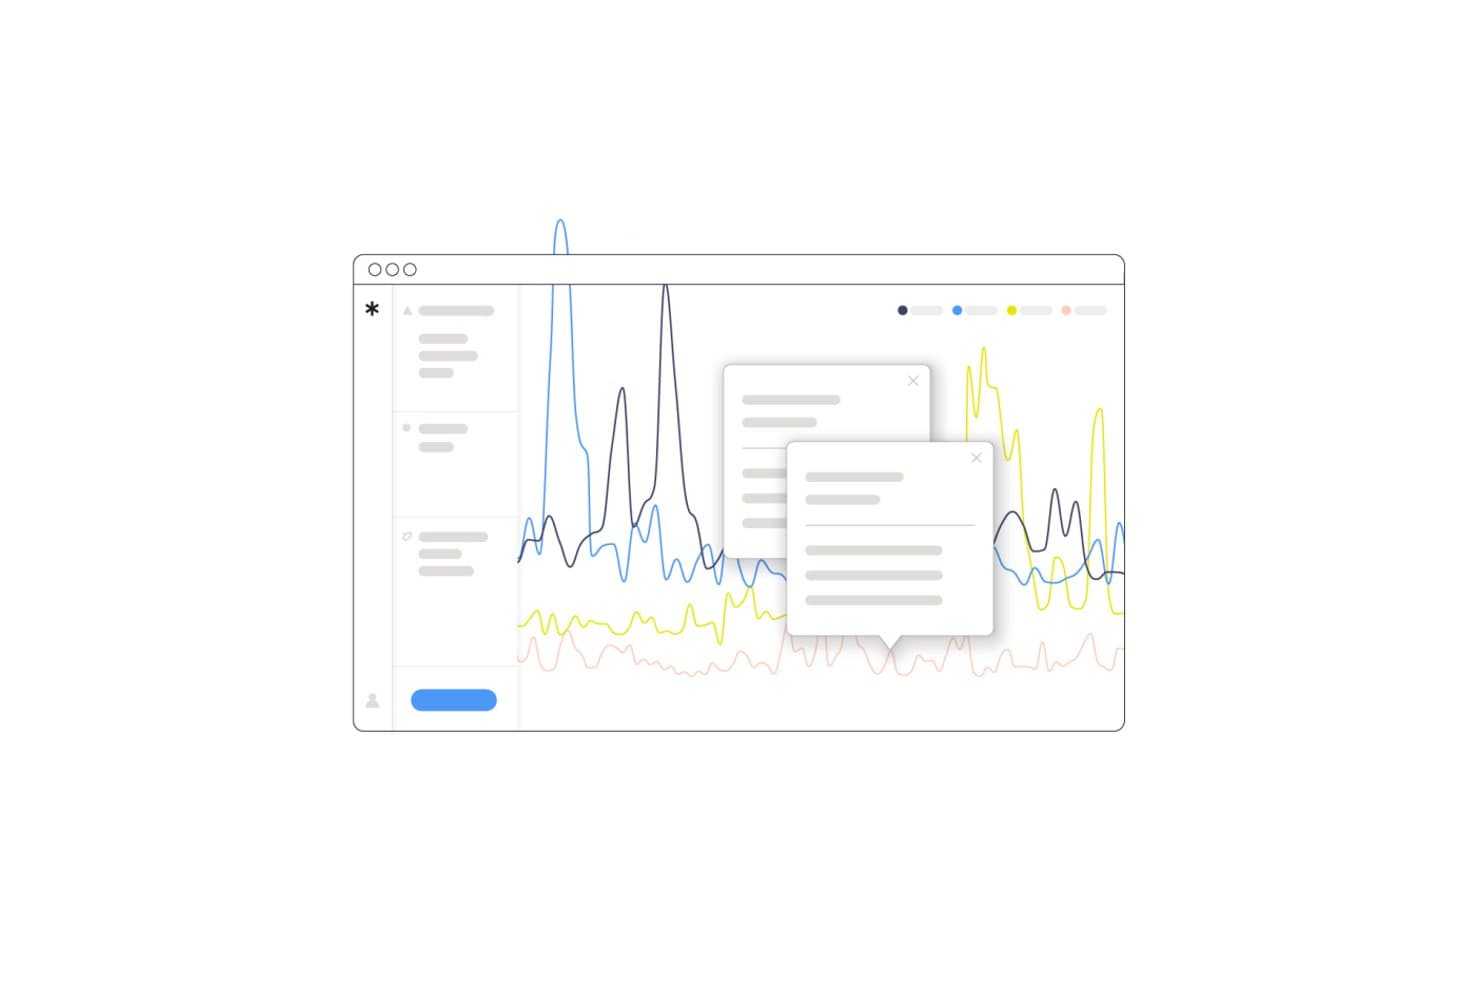
Pulsar surfaces real-time trend spikes with interactive data tooltips. Pulsar is a social and audience intelligence platform that monitors public conversations across 45+ source types—including social media, news, broadcast, and reviews—to surface trends, detect emerging narratives, and analyze sentiment and community behavior at scale.
Who Is Pulsar Best For?
Pulsar is a strong fit for market researchers and brand strategists who need to track how public narratives evolve across social media, news, and broadcast at a global scale.
Why I Picked Pulsar
I've included Pulsar in my top picks because it's purpose-built for tracking how public narratives form, spread, and shift across social media, news, and broadcast at once. Its Narratives AI automatically groups content into ranked narrative clusters, so I can see which storylines are gaining momentum versus fading, without writing a single Boolean query. I also rely on its community detection layer to pinpoint exactly which audience groups are driving a trend before it peaks.
Pulsar Key Features
- Multi-source data aggregation: Pulls in conversations across 45+ source types—including social media, licensed news, broadcast, forums, and reviews—from 195 countries and 200+ languages.
- KPI alerts with AI summaries: Fires alerts when sentiment, volume, or visibility crosses a threshold, with optional GPT-4-generated summaries explaining what triggered the change.
- Community detection: Maps audience groups by online behavior and connections to show which communities are driving a trend, not just that a trend exists.
- Instant alerts: Delivers notifications within minutes via email, in-app, or mobile push in 20+ languages when conversation shifts happen.
Pulsar Integrations
Pulsar integrates with Hootsuite, Audiense, and StatSocial, with Gephi exports and MCP access. Its full API supports custom connections to BI tools, CRMs, and dashboards, while first-party data can be added through CSV upload.
Pros and Cons
Pros:
- Explains trend drivers through community detection
- Combines global public conversation sources
- Tracks emerging narratives before volume spikes
Cons:
- Forecasts narrative momentum, not business metrics
- Boolean queries require substantial setup
Learn more about Pulsar:
Outro software de análise automatizada de tendências
Eis algumas opções adicionais de software de análise automatizada de tendências que não entraram na minha seleção, mas que vale a pena conhecer:
- 11BrandwatchBest for AI-assisted social media trends
- 12QuidBest for licensed social and market signal monitoring
- 13Power BIBest for Microsoft ecosystem trend reporting
- 14ThoughtSpotBest for NLP-driven KPI trend detection
- 15DetermBest for spike alerts with AI-driven explanations
- 16TelliusBest for root-cause trend investigation
How I Evaluate Automated Trend Analysis Software
I split my evaluation into three parts, with the most weight on core functions: spot anomalies and keep product, customer, and market signals current. Next, I look for standout features such as sentiment clusters that group recurring feedback themes. Finally, I consider value beyond features, including onboarding, support, and pricing as data sources grow.
Core Functionality (Table Stakes For This List)
When I'm selecting tools for my list, I score each one on a scale from 0 (does not offer the functionality) to 5 (excels in this area) for each core functionality listed below. I then convert the total into a percentage to help assess each tool's overall fit, with extra weight on any functionalities I’ve deemed essential.
- Pattern Detection (Essential): I look for automatic detection of recurring shifts or anomalies, such as a sudden drop in activation across customer segments, without manual statistical analysis.
- Continuous Monitoring (Essential): I evaluate update frequency and source coverage to see whether teams can catch a change in retention or demand before the next planning review.
- Multi-Source Aggregation: I check whether a tool can bring product metrics, customer feedback, and external market signals together for cross-source analysis.
- Trend Forecasting: I assess whether forecasts use historical and current patterns to project outcomes, such as likely demand changes, and support planning decisions.
- Visualization and Reporting: I look for clear dashboards and reports that make changes in product performance or customer behavior easy to explain to stakeholders.
- Shift Alerts: I assess whether configurable alerts flag meaningful deviations, such as a sudden rise in support complaints, without creating excessive noise.
Once I have a list of tools that meet the criteria, I consider what sets each platform apart.
Differentiating Factors (What Sets Vendors Apart)
Here's how I compare and contrast different vendors:
Standout Features
Root-cause explainability matters most to me. I look for tools that don't just flag a spike in churn but surface the likely drivers behind it, such as a recent pricing change or a drop in onboarding completion. Scenario simulation is the natural next step: I evaluate whether a tool lets me model a roadmap shift against forecasted trends before committing resources. I also check for sentiment and topic clustering that groups support tickets and reviews into themes I can act on during prioritization.
Beyond Features
I evaluate how quickly a team can connect its existing stack and start seeing actionable trends. Some platforms offer guided setup with prebuilt templates, while others require dedicated data engineering before you see a single insight. I also check whether licensing scales fairly as data volume or seat count grows, since a tool that prices per tracked trend can get expensive fast once you expand beyond one product line. Finally, I look at how directly trend outputs feed into prioritization or roadmap tools, because insights that live in a separate dashboard rarely change real decisions.
Como escolher software de análise automatizada de tendências
É fácil ficar atolado em listas extensas de funcionalidades e estruturas de preços complexas. Para o ajudar a manter-se concentrado enquanto percorre o seu processo único de seleção de software, eis uma lista de verificação dos fatores a ter em conta:
| Fator | O que considerar |
|---|---|
| FatorEscalabilidade | O que considerarO software consegue acompanhar o crescimento da sua empresa? Considere se consegue processar volumes de dados e números de utilizadores crescentes sem uma quebra de desempenho. |
| FatorIntegrações | O que considerarConsegue ligar-se às suas ferramentas existentes, como CRM, ERP ou plataformas de marketing? Certifique-se de que se integra facilmente na sua atual pilha tecnológica. |
| FatorPersonalização | O que considerarPode adaptar o software para responder aos seus fluxos de trabalho e necessidades específicas? Procure opções para ajustar painéis e relatórios de modo a corresponderem aos seus processos. |
| FatorFacilidade de utilização | O que considerarA interface é intuitiva para a sua equipa? Teste-a com utilizadores não técnicos para garantir que conseguem navegar sem formação extensa nem frustração. |
| FatorImplementação e integração inicial | O que considerarCom que rapidez pode a sua equipa começar a utilizá-lo eficazmente? Avalie a qualidade dos materiais de formação e do apoio disponíveis durante o processo de integração inicial. |
| FatorCusto | O que considerarO preço está de acordo com o seu orçamento? Esteja atento a taxas ou custos ocultos que possam surgir à medida que a utilização aumenta. Compare com ferramentas semelhantes para avaliar a relação qualidade-preço. |
| FatorMedidas de segurança | O que considerarComo protege o software os seus dados? Verifique a existência de encriptação, conformidade com as leis de proteção de dados e atualizações de segurança regulares. |
| FatorDisponibilidade do apoio | O que considerarExiste ajuda quando precisa dela? Procure opções de apoio 24 horas por dia, 7 dias por semana, e um gestor de conta dedicado para ajudar com quaisquer problemas ou dúvidas. |
O que é um software de análise automatizada de tendências?
O software de análise automatizada de tendências é uma ferramenta que identifica padrões e alterações nos dados ao longo do tempo. Profissionais como especialistas de marketing, analistas e gestores de produto utilizam estas ferramentas para obter informações e tomar decisões fundamentadas. A visualização de dados, a análise preditiva e os alertas em tempo real ajudam a compreender as tendências e a reagir rapidamente. Estas ferramentas permitem aos utilizadores antecipar os movimentos do mercado e otimizar estratégias.
Funcionalidades
Ao selecionar um software de análise automatizada de tendências, esteja atento às seguintes funcionalidades essenciais:
- Visualização de dados: Fornece gráficos claros e interativos para ajudar os utilizadores a compreender tendências de dados complexas.
- Análise preditiva: Utiliza dados históricos para prever tendências futuras, permitindo uma tomada de decisões proativa.
- Alertas em tempo real: Notificam os utilizadores sobre alterações ou padrões significativos à medida que ocorrem, permitindo respostas atempadas.
- Análise de sentimentos: Analisa as opiniões e emoções dos consumidores para avaliar a perceção pública de marcas ou produtos.
- Painéis personalizáveis: Permitem aos utilizadores adaptar a interface para apresentar os dados mais relevantes para as suas necessidades específicas.
- Capacidades de integração: Ligam-se a ferramentas e plataformas existentes para garantir um fluxo de dados uniforme entre sistemas.
- Previsão de tendências: Identifica tendências emergentes e prevê o seu potencial impacto no mercado.
- Informações de mercado: Oferece informações sobre tendências do setor e atividades dos concorrentes para fundamentar o planeamento estratégico.
- Relatórios interativos: Fornecem relatórios detalhados que os utilizadores podem explorar para obter informações mais aprofundadas sobre os dados.
- Medidas de segurança: Garantem a proteção dos dados através de encriptação e conformidade com os regulamentos de privacidade dos dados.
Benefícios
A implementação de um software de análise automatizada de tendências proporciona vários benefícios à sua equipa e à sua empresa. Eis alguns dos benefícios que pode esperar:
- Tomada de decisões fundamentada: Ao analisar tendências e previsões de dados, a sua equipa pode tomar decisões fundamentadas.
- Eficiência de tempo: Os processos automatizados reduzem o tempo de análise
manualdos dados, permitindo que a sua equipa se concentre em tarefas estratégicas. - Desenvolvimento proativo de estratégias: A análise preditiva ajuda a antecipar alterações do mercado e a ajustar estratégias antes de as tendências afetarem a sua empresa.
- Melhor compreensão do mercado: Os alertas em tempo real e as informações de mercado proporcionam uma visão mais aprofundada da dinâmica do setor e das atividades dos concorrentes.
- Melhores informações sobre os clientes: A análise de sentimentos fornece informações valiosas sobre as opiniões dos consumidores, ajudando a adaptar os produtos e os esforços de marketing.
- Informações personalizáveis: Os painéis personalizáveis garantem que vê os dados mais relevantes, melhorando a produtividade e a concentração.
- Inovação orientada por dados: Ao identificar tendências emergentes, a sua equipa pode inovar e antecipar-se às exigências do mercado.
Custos e preços
Selecionar um software de análise automatizada de tendências exige compreender os modelos e planos de preços disponíveis. Os custos variam consoante as funcionalidades, o tamanho da equipa, os complementos, entre outros fatores. A tabela abaixo resume os planos comuns, os seus preços médios e as funcionalidades normalmente incluídas nas soluções de software de análise automatizada de tendências:
Tabela de comparação de planos para software de análise automatizada de tendências
| Tipo de plano | Preço médio | Funcionalidades comuns |
|---|---|---|
| Tipo de planoPlano gratuito | Preço médio$0 | Funcionalidades comunsVisualização básica de dados, análise limitada de tendências e capacidades de elaboração de relatórios restritas. |
| Tipo de planoPlano pessoal | Preço médio$10-$30/utilizador/mês | Funcionalidades comunsVisualização de dados melhorada, análise preditiva básica e painéis personalizáveis. |
| Tipo de planoPlano empresarial | Preço médio$50-$100/utilizador/mês | Funcionalidades comunsConjunto completo de visualização de dados, análise preditiva avançada, alertas em tempo real e análise de sentimentos. |
| Tipo de planoPlano empresarial de grande dimensão | Preço médio$150-$2,000+/utilizador/mês | Funcionalidades comunsConjunto de dados abrangente, opções completas de personalização, inteligência de mercado aprofundada, capacidades de integração e apoio dedicado ao cliente. |
Perguntas frequentes sobre software de análise automatizada de tendências
Eis algumas respostas a perguntas frequentes sobre software de análise automatizada de tendências:
Que setores beneficiam mais do software de análise automatizada de tendências?
Setores como o retalho, as finanças e o marketing beneficiam significativamente do software de análise automatizada de tendências. Os retalhistas podem acompanhar as preferências dos consumidores e ajustar o inventário, enquanto os analistas financeiros podem prever as tendências do mercado e tomar decisões de investimento informadas. Os profissionais de marketing utilizam estas ferramentas para compreender o comportamento do público e criar campanhas direcionadas. Se trabalha num setor orientado por dados, estas ferramentas podem ajudá-lo a manter-se competitivo, fornecendo informações que fundamentam decisões estratégicas.
As pequenas empresas podem utilizar eficazmente o software de análise automatizada de tendências?
Sim, as pequenas empresas podem utilizar eficazmente o software de análise automatizada de tendências. Muitas soluções oferecem planos escaláveis para equipas pequenas com orçamentos limitados. Estas ferramentas ajudam as pequenas empresas a identificar oportunidades de mercado e a monitorizar os concorrentes sem necessitarem de grandes equipas de dados. Ao escolher uma ferramenta de IA com uma interface intuitiva e funcionalidades essenciais, pode tirar partido destas informações para tomar decisões baseadas em dados que apoiem o crescimento.
Como posso garantir a exatidão dos dados no software de análise automatizada de tendências?
Para garantir a exatidão dos dados, atualize regularmente o software e integre-o com fontes de dados fiáveis. Utilize ferramentas que ofereçam feeds de dados em tempo real e faça uma verificação cruzada dos resultados com outras plataformas de análise. A formação da sua equipa nas melhores práticas de introdução e análise de dados também pode ajudar a manter a exatidão. Se o software o permitir, personalize as regras de validação de dados para detetar erros antecipadamente e garantir que as informações obtidas são fiáveis.
É necessária experiência técnica para utilizar software de análise automatizada de tendências?
Não, a maioria dos softwares de análise automatizada de tendências foi concebida para utilizadores com diferentes níveis de experiência técnica. Muitas plataformas oferecem interfaces intuitivas e disponibilizam tutoriais ou recursos de apoio para ajudar a começar. No entanto, algumas funcionalidades avançadas podem exigir uma compreensão básica da análise de dados. Se é novo nestas ferramentas, procure software com um bom apoio ao cliente e materiais de formação que ajudem tanto a si como à sua equipa a adquirir competência.