
Mouseflow-arvostelu 2026: hyvät ja huonot puolet, ominaisuudet ja hinnoittelu
Mouseflow on erinomainen käyttäjien käyttäytymisen analysoinnissa intuitiivisen käyttöliittymänsä ja kattavien tietojensa ansiosta, mikä tekee siitä huippuvalinnan verkkosivuston konversioasteiden parantamiseen.

We review tools independently, and commissions help fund our testing. See our transparency policy, our methodology, or suggest a tool.
Mouseflow is a user behavior analytics tool for product and UX teams who need to understand exactly how visitors move through a website—where they click, where they drop off, and what's breaking the experience. I'd consider it a strong fit if you want more granular session filtering and longer data retention than Hotjar offers, without paying enterprise-level prices.
Mouseflow Evaluation Summary
4.7/5
- From $25/month (billed annually)
- Free plan available
Why Trust Our Software Recommendations
6,700+
Reviews
20
Industry experts
16+
Evaluation factors
14
Years
Our team has been testing and reviewing software since 2012. As product managers ourselves, we know how difficult—and important—it is to choose the right software.
For this guide, we evaluated tools using hands-on testing and independent research, scoring tools using our selection criteria.
Our reviews reflect our human editorial judgment, not a sales pitch.
Expert reviewers:
- Andrew LumbySenior TPM
- Cristiano ValimSenior UI/UX Lead


Mouseflow Overview
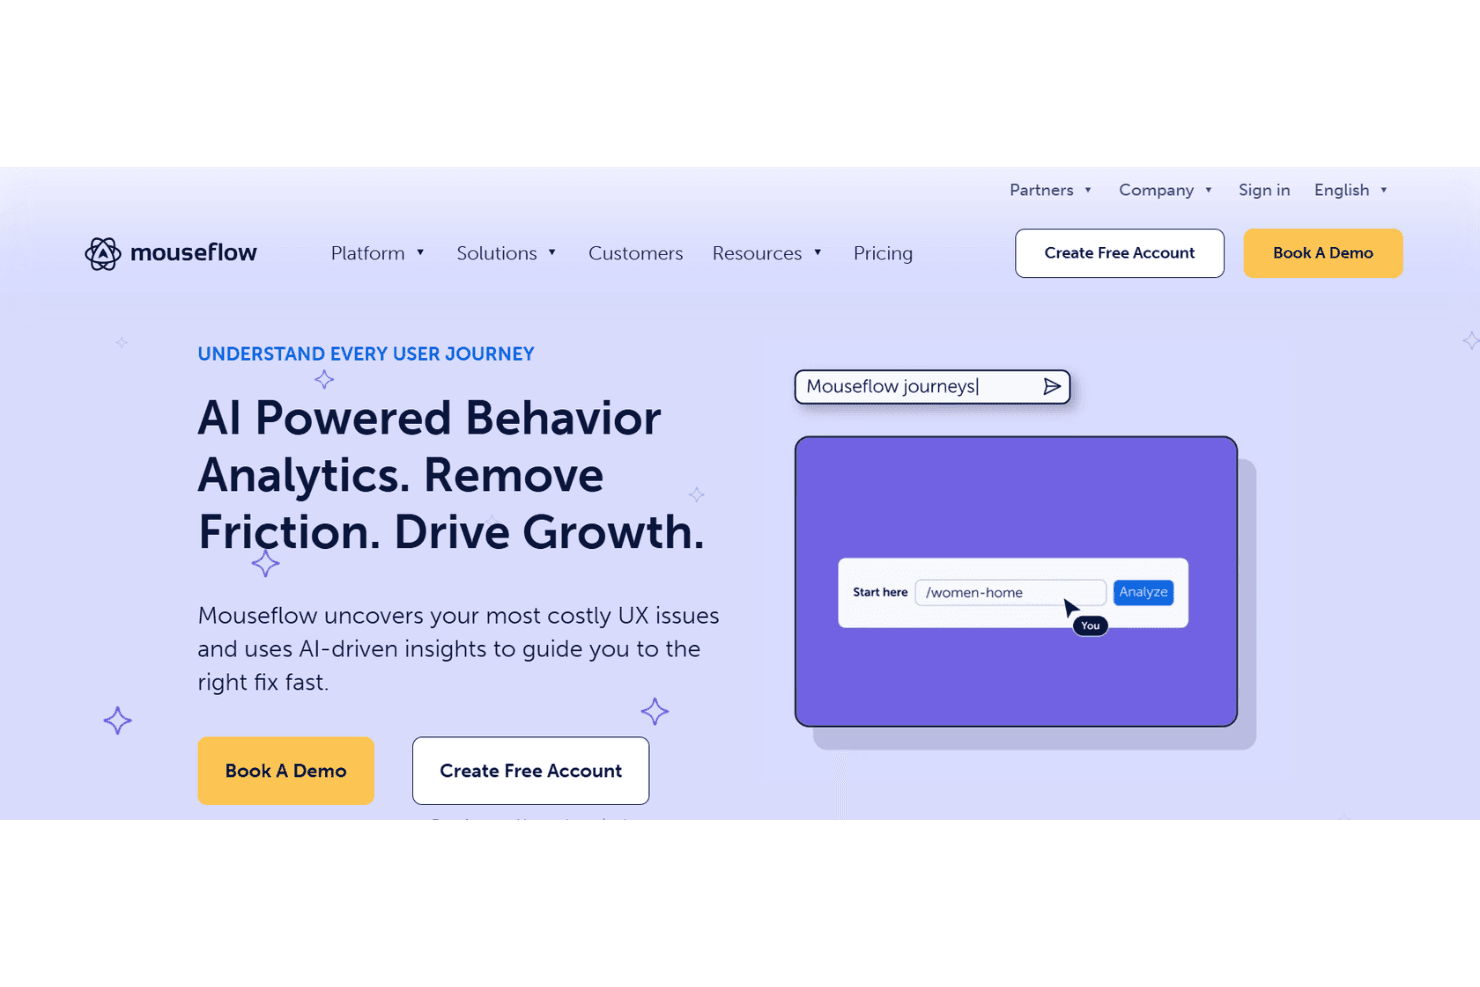
Mouseflow stands out for the depth of insight it can give you into what’s actually happening on your website, helping you move beyond basic traffic metrics and understand the reasons behind user behavior. If you’re trying to make data-driven improvements, these insights can help you prioritize changes that have the biggest impact on engagement and conversions. That said, you might find that the platform takes some time to fully learn, and costs can rise as your site traffic grows or as you need more advanced capabilities.
Pros
- You can easily track user sessions with detailed replay features.
- Heatmaps provide clear insights into where users interact most on your site.
- The interface is intuitive, making it simple for your team to navigate and analyze data.
Cons
- You might find the initial setup a bit complex.
- Customer support responses can be slower than expected at times.
- Limited features in the free plan.
Is Mouseflow Right For Your Needs?
Who Would be a Good Fit for Mouseflow?
Mouseflow suits marketing teams in e-commerce and SaaS industries focused on optimizing user experience and boosting conversions. If your team needs detailed insights into user interactions, Mouseflow's session replays and heatmaps provide valuable data. It's especially beneficial for teams aiming to reduce bounce rates and improve site navigation, as you can visually track user behavior and pinpoint areas for improvement.
- E-commerce WebsitesMouseflow helps you understand customer journeys and optimize checkout processes with its session replay feature.
- SaaS CompaniesYour team can analyze user engagement and improve product onboarding using Mouseflow's detailed heatmaps and session analytics.
- Digital Marketing TeamsYou can track the effectiveness of landing pages and campaigns through Mouseflow's visual data insights.
- UX DesignersMouseflow's capabilities allow you to identify design flaws by observing real user interactions and behaviors.
- Travel and HospitalityLook deep into issues like booking abandonment with Mouseflow’s UX insights. Evaluate typical user flow and make adjustments to guide travelers through the funnel more effectively.
- Product ManagersMouseflow's insights help you understand how users interact with your website, guiding you to tailor it for better engagement.
Who Would be a Bad Fit for Mouseflow?
Mouseflow may not be the best choice if your team only needs simple website analytics rather than detailed behavioral insights. Because pricing scales based on the number of sessions tracked, costs can rise quickly for high-traffic sites or teams with limited budgets. You may also find the platform less suitable if your organization prefers fully automated insights, since extracting value often requires reviewing recordings and analyzing behavior data manually.
- Non-Tech Savvy UsersMouseflow's detailed analytics may overwhelm you if you're not comfortable with complex data interpretation.
- Startups with Tight BudgetsYou might find Mouseflow's pricing prohibitive if your budget is limited and you need cost-effective solutions.
- Small Nonprofit OrganizationsThe features may be more than you need if your primary focus isn't on detailed user behavior analysis.
- Teams Looking for Basic Website AnalyticsIf you only need simple metrics like page views or traffic sources, Mouseflow’s behavioral analytics tools may be more complex than necessary.
- High-Traffic Websites With Limited BudgetsSince pricing scales with the number of sessions recorded, very high-traffic sites may find the cost increases quickly.
- Organizations Wanting Fully Automated InsightsMouseflow provides rich data, but your team may still need to manually review session recordings and filters to uncover patterns.
How We Test & Score Tools
We’ve spent years building, refining, and improving our software testing and scoring system. The rubric is designed to capture the nuances of software selection and what makes a tool effective, focusing on critical aspects of the decision-making process.
Below, you can see exactly how our testing and scoring works across seven criteria. It allows us to provide an unbiased evaluation of the software based on core functionality, standout features, ease of use, onboarding, customer support, integrations, customer reviews, and value for money.
Core Functionality (25% of final scoring)
The starting point of our evaluation is always the core functionality of the tool. Does it have the basic features and functions that a user would expect to see? Are any of those core features locked to higher-tiered pricing plans? At its core, we expect a tool to stand up against the baseline capabilities of its competitors.
Standout Features (25% of final scoring)
Next, we evaluate uncommon standout features that go above and beyond the core functionality typically found in tools of its kind. A high score reflects specialized or unique features that make the product faster, more efficient, or offer additional value to the user.
We also evaluate how easy it is to integrate with other tools typically found in the tech stack to expand the functionality and utility of the software. Tools offering plentiful native integrations, 3rd party connections, and API access to build custom integrations score best.
Ease of Use (10% of final scoring)
We consider how quick and easy it is to execute the tasks defined in the core functionality using the tool. High scoring software is well designed, intuitive to use, offers mobile apps, provides templates, and makes relatively complex tasks seem simple.
Onboarding (10% of final scoring)
We know how important rapid team adoption is for a new platform, so we evaluate how easy it is to learn and use a tool with minimal training. We evaluate how quickly a team member can get set up and start using the tool with no experience. High scoring solutions indicate little or no support is required.
Customer Support (10% of final scoring)
We review how quick and easy it is to get unstuck and find help by phone, live chat, or knowledge base. Tools and companies that provide real-time support score best, while chatbots score worst.
Customer Reviews (10% of final scoring)
Beyond our own testing and evaluation, we consider the net promoter score from current and past customers. We review their likelihood, given the option, to choose the tool again for the core functionality. A high scoring software reflects a high net promoter score from current or past customers.
Value for Money (10% of final scoring)
Lastly, in consideration of all the other criteria, we review the average price of entry level plans against the core features and consider the value of the other evaluation criteria. Software that delivers more, for less, will score higher.
Core Features
Session Replay
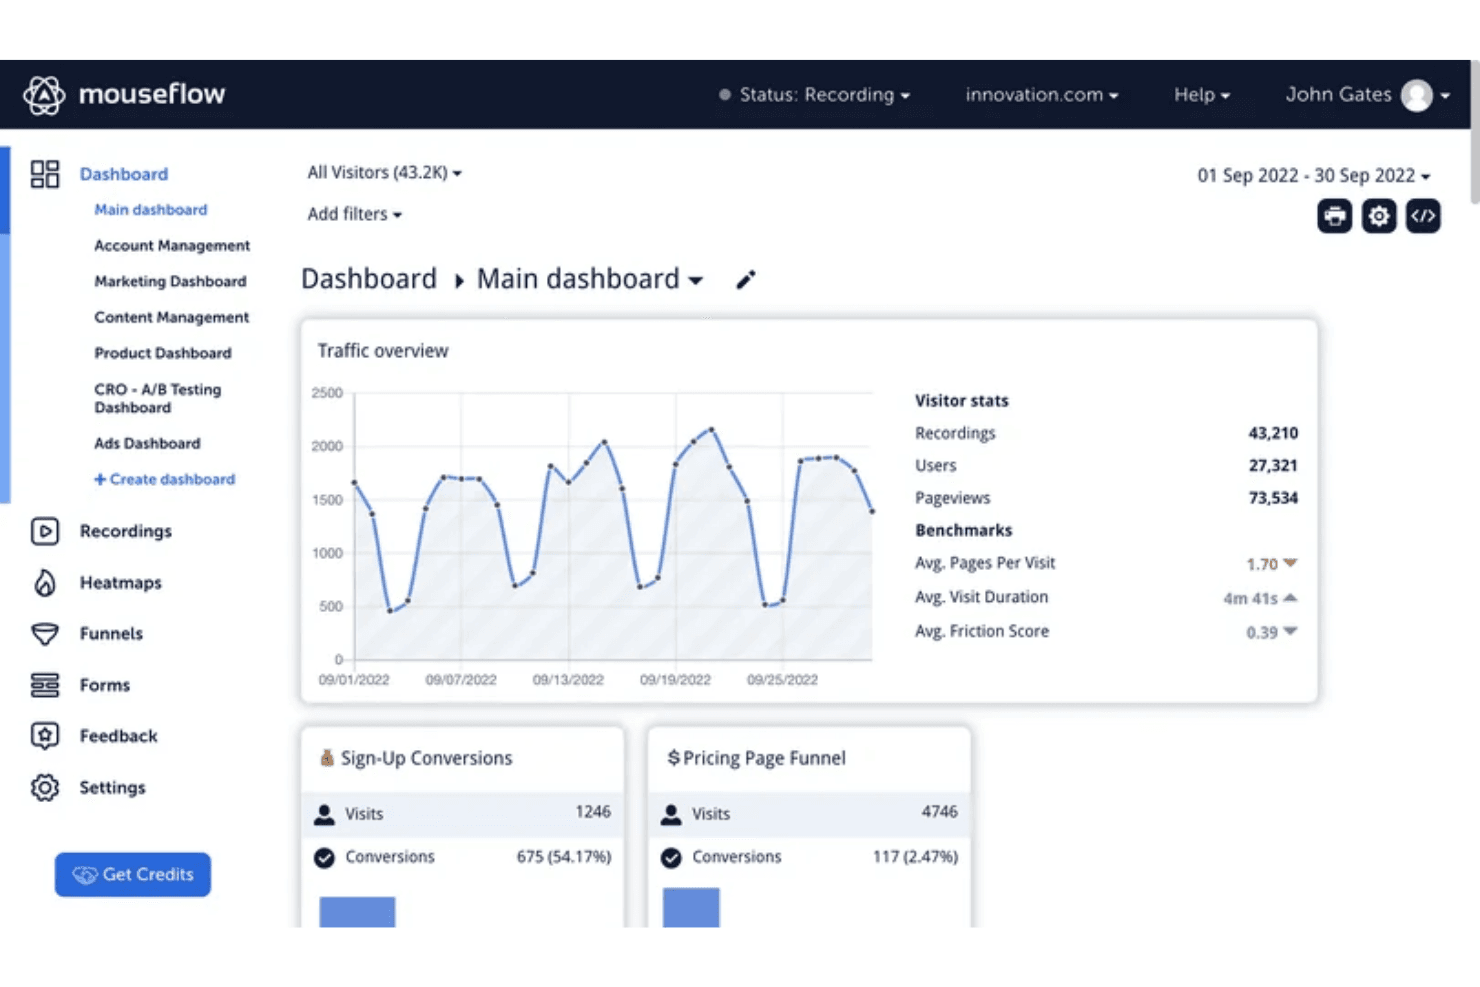
You can watch real recorded sessions to see exactly how visitors navigate your site. This helps your team identify pain points and improve user experience.
Heatmap Tools
Access seven types of heatmaps, including click, movement, attention, friction, interactive, geo, and scroll heatmaps. These help you visualize where users click, move, get the most engaged or experience the most friction.
Funnel Analysis
Track how users move through conversion funnels on your site. This allows you to pinpoint where drop-offs occur and optimize those stages.
Form Analytics
See specific form interactions where website visitors struggle, including which fields cause abandonment. Improve form completion rates by addressing these issues.
Feedback Campaigns
Collect direct user feedback with targeted surveys. You can gather insights straight from your visitors about their experiences.
Ease of Use
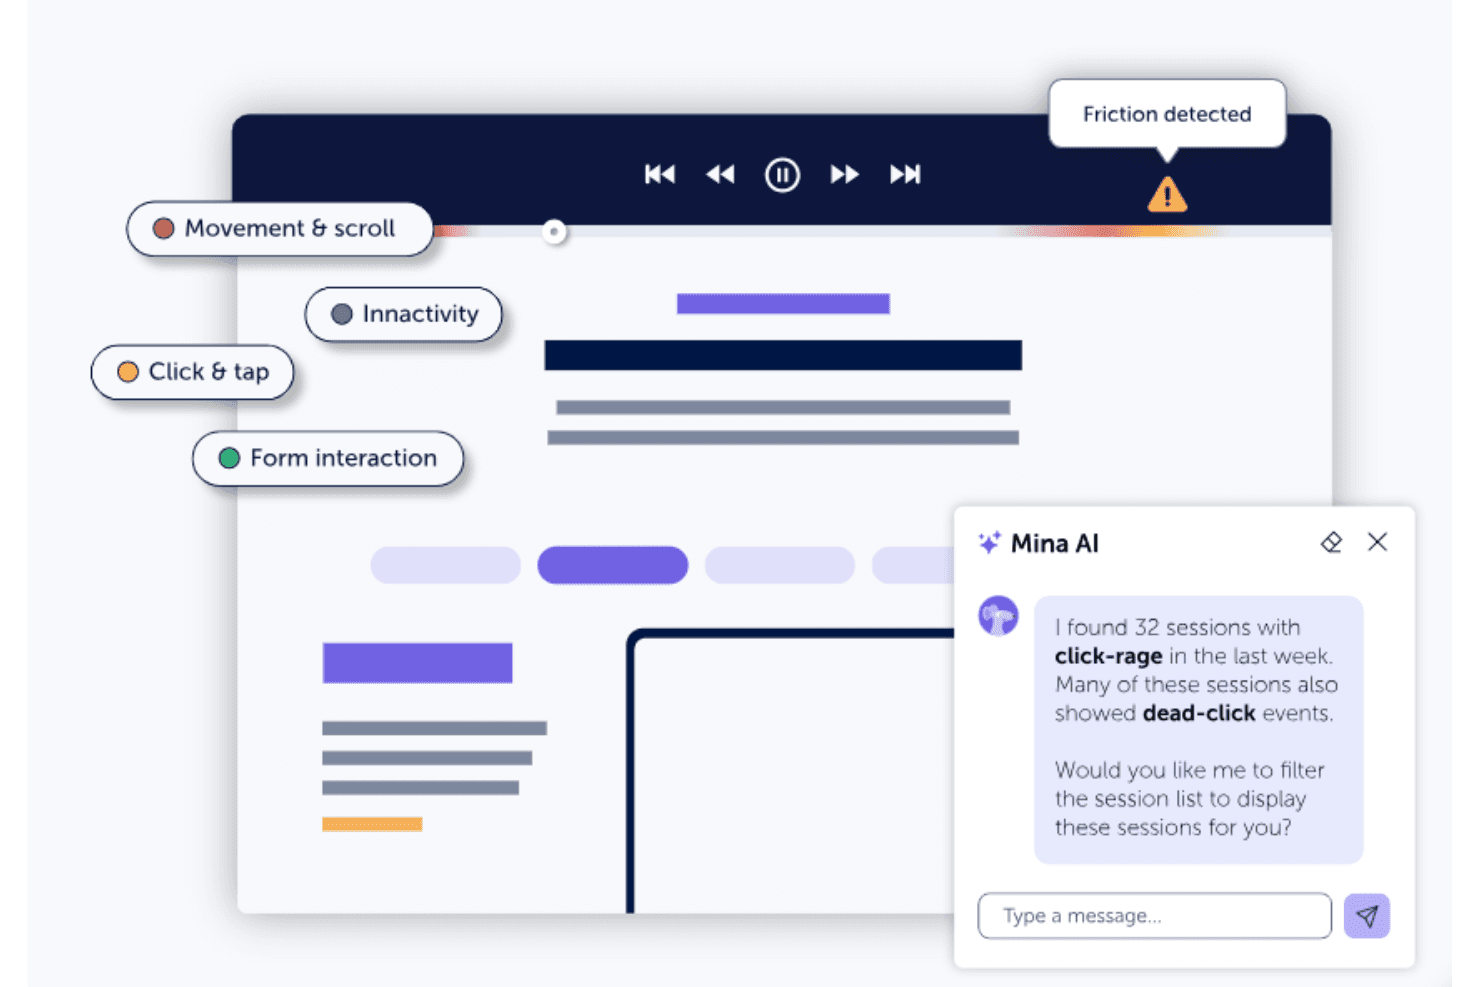
Mouseflow stands out for its user-friendly interface, making it accessible even if you're new to analytics. The usability of the dashboard is intuitive, allowing your team to navigate easily and find the data you need. While setup might be a bit complex initially, the clear layout and straightforward navigation simplify ongoing use. Compared to other tools, Mouseflow's design helps you focus on insights rather than getting bogged down in complexity, enhancing your team's productivity.
Integrations
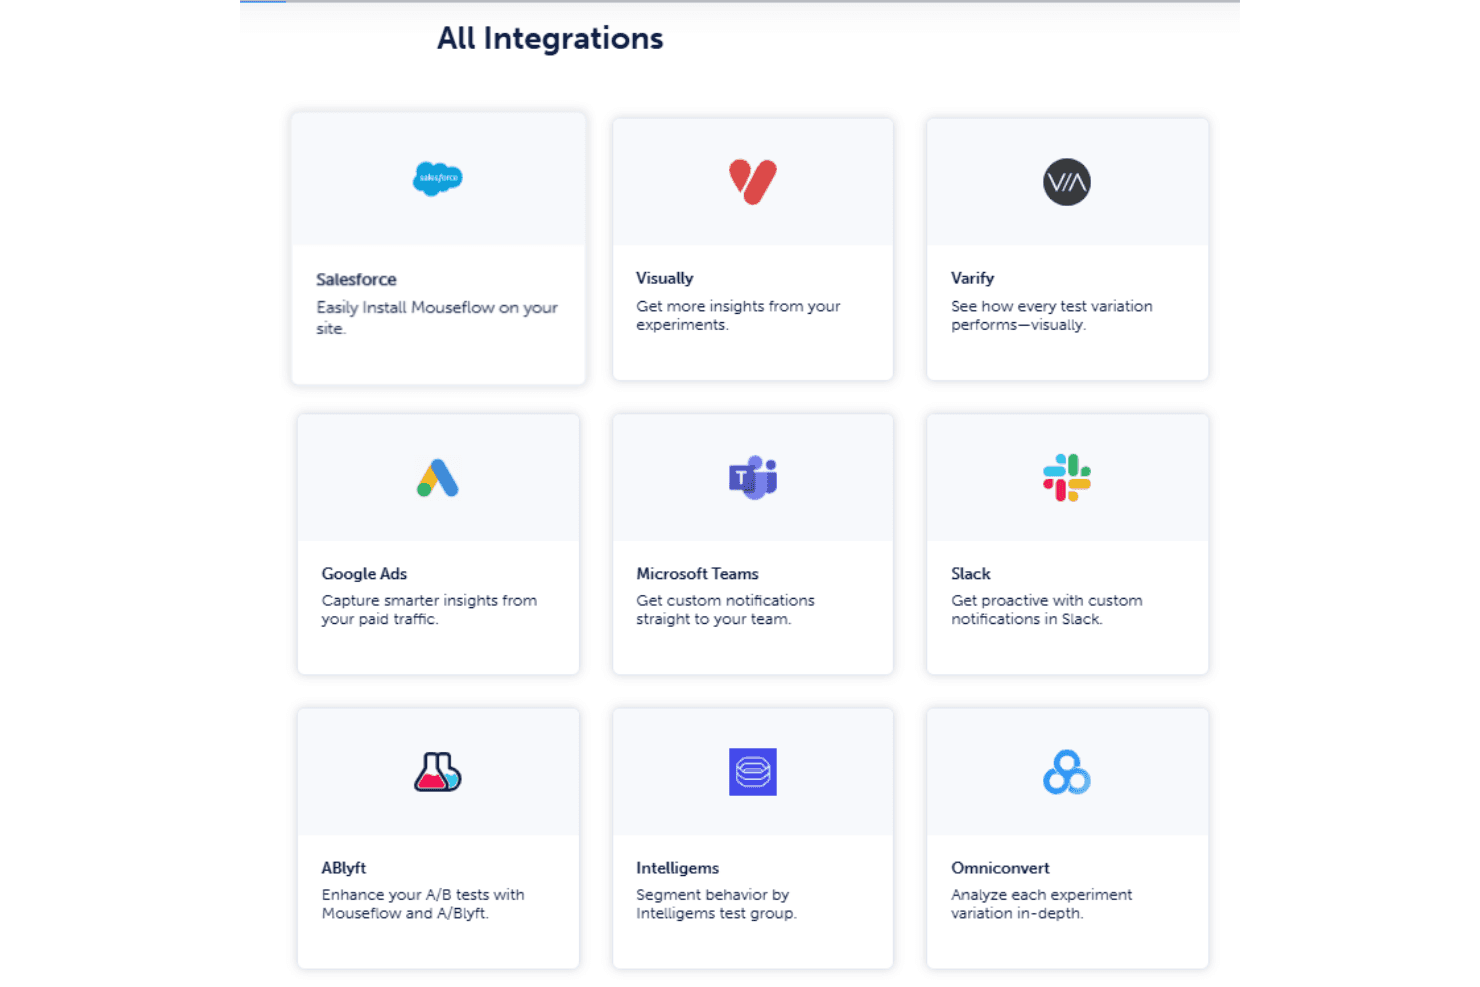
Mouseflow integrates with HubSpot, Shopify, Google Analytics, Google Tag Manager, AB Tasty, Optimizely, and Segment, allowing you to connect user behavior data with marketing, analytics, experimentation, and data-routing tools. It also provides developer access through its API, enabling custom implementations and tailored integrations for teams with more advanced technical needs.
Mouseflow Specs
- A/B Testing: No
- AI Integration: No
- Analytics: Yes
- API: Yes
- Big Data: No
- Campaign Management: No
- Conversion Tracking: Yes
- Custom Reports: No
- Dashboard: Yes
- Data Export: Yes
- Data Import: No
- Data Visualization: Yes
- External Integrations: Yes
- Feedback Management: No
- Keyword Tracking: Yes
- Landing Pages: No
- Link Tracking: Yes
- Multi-User: Yes
- Notifications: Yes
- Process Reporting: No
- Referral Tracking: Yes
- Sentiment Analysis: No
- SEO: No
- Workflow Management: No


